How to Cite


Share

This work is licensed under a Creative Commons Attribution 4.0 International License.
Abstract
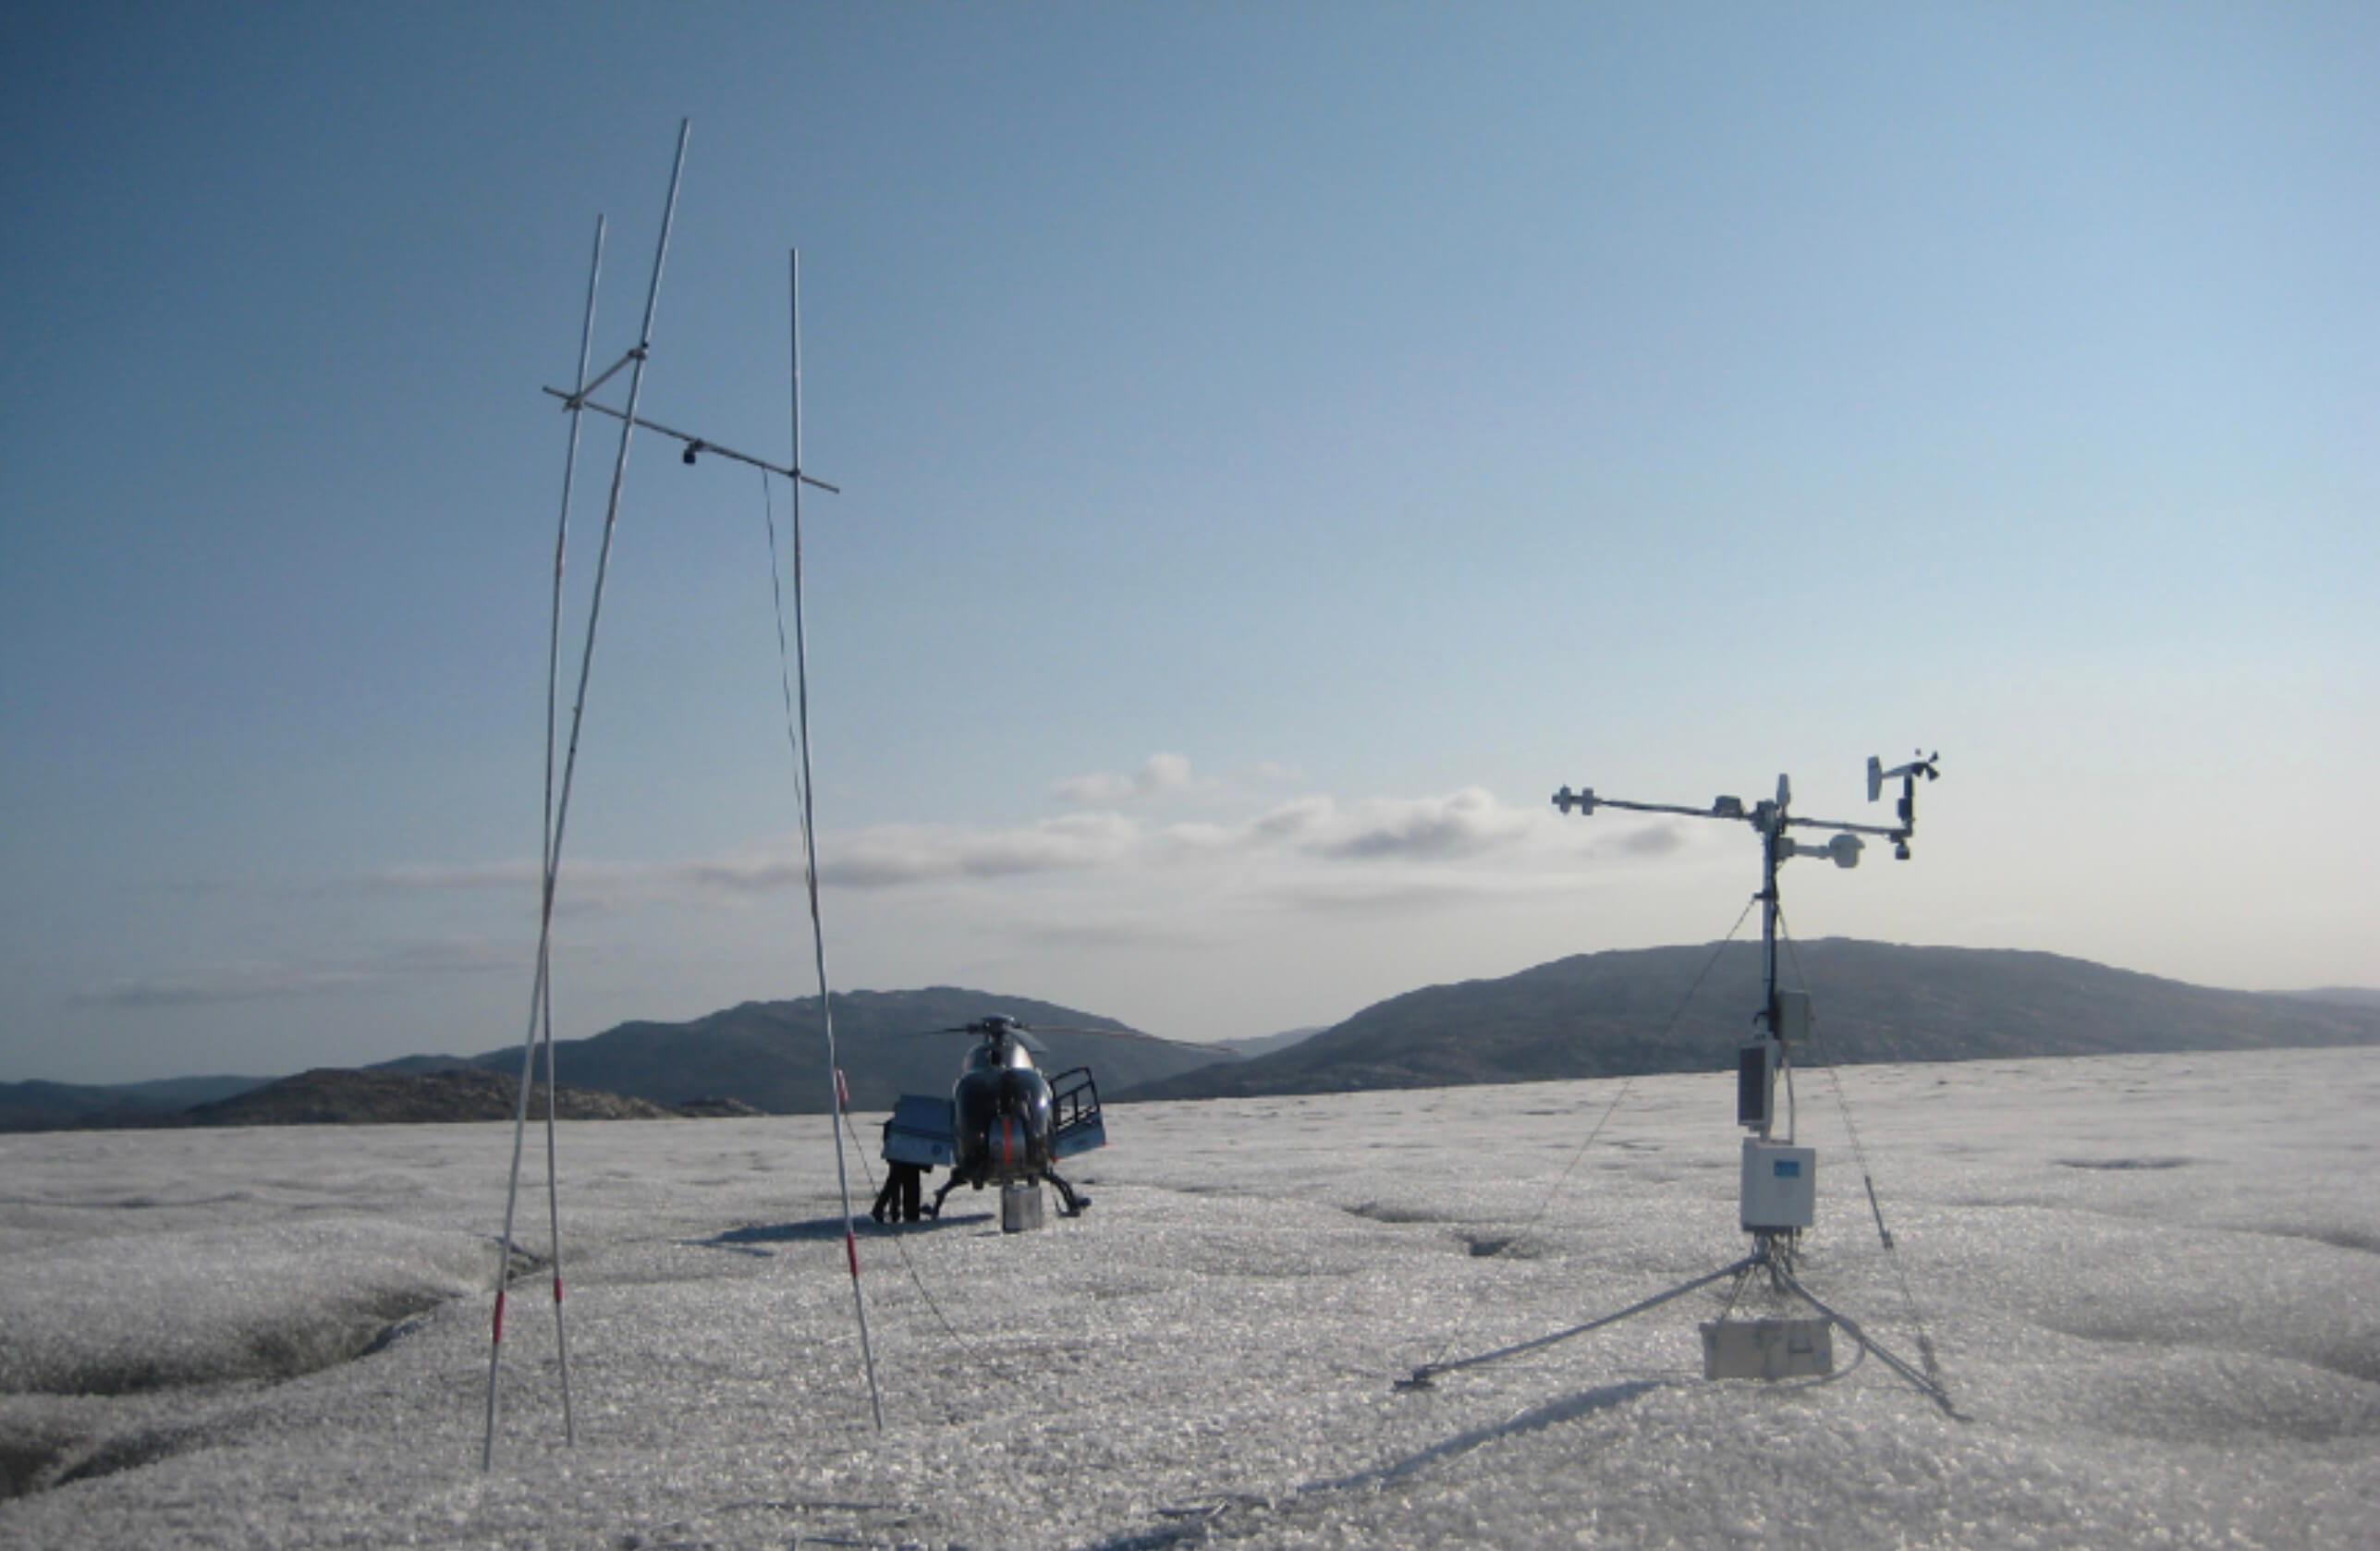
The Greenland ice sheet has experienced an average mass loss of 142 ± 49 Gt/yr from 1992 to 2011 (Shepherd et al. 2012), making it a significant contributor to sea-level rise. Part of the ice- sheet mass loss is the result of increased dynamic response of outlet glaciers (Rignot et al. 2011). The ice discharge from outlet glaciers can be quantified by coincident measurements of ice velocity and ice thickness (Thomas et al. 2000; van den Broeke et al. 2016). As part of the Programme for monitoring of the Greenland Ice Sheet (PROMICE; Ahlstrøm et al. 2008), three airborne surveys were carried out in 2007, 2011 and 2015, with the aim of measuring the changes in Greenland ice-sheet thicknesses. The purpose of the airborne surveys was to collect data to assess the dynamic mass loss of the Greenland ice sheet (Andersen et al. 2015). Here, we present these datasets of observations from ice-penetrating radar and airborne laser scanning, which, in combination, make us able to determine the ice thickness precisely. Surface-elevation changes between surveys are also presented, although we do not provide an in-depth scientific interpretation of these.
How to Cite
Share
Downloads
Editors Adam A. Garde, Ole Bennike and W. Stuart Watt
The 22 contributions in this issue of Review of Survey activities demonstrate the broad field of activities performed by the Geological Survey of Denmark and Greenland and external partners.
Seven papers on Danish geology comprise an investigation of reservoir sandstones for oil [...]