 |
DATA ARTICLE | SHORT  |
Danish groundwater pCO2: a multi-decadal national data set
Hyojin Kim*, Lærke Thorling  , Rasmus Jakobsen
Abstract
This data set provides a comprehensive assessment of groundwater partial pressure CO2 (pCO2) across Denmark, spanning more than three decades (1988–2024). Using groundwater chemistry data from the national borehole database, Jupiter, pCO2 levels were calculated and compared using two distinct approaches: (1) geochemical modelling via PHREEQC; and (2) simplified carbonate equilibria using only pH and alkalinity. While the latter is widely used for its simplicity, the PHREEQC method offers more accurate estimates by accounting for ionic strength and complexation. Despite Denmark’s extensive public archive of groundwater chemistry, pCO2 values have remained largely unavailable to the scientific community due to data complexity. This data set addresses this data gap through rigorous cleaning and the flagging of potentially contaminated samples to ensure high data fidelity. The resulting long-term, large-scale overview is essential for elucidating the role of groundwater in the carbon cycle and its spatiotemporal dynamics. Furthermore, these data establish critical baseline conditions necessary for monitoring and protecting groundwater resources in the context of the future CO2 injection and storage in deep geological reservoirs.
Tabular abstract:
| Geographical coverage | Denmark |
| Temporal coverage | 1989–2024 |
| Subject(s) | Geochemistry and geochronology, Soils and biogeochemistry |
| Data format(s) | Calculated geochemical data in xlsx format. |
| Sample collection and analysis | Calculated using PRHEEQC and carbonate equilibria based on groundwater chemistry data |
| Parameters | Field measured pH, alkalinity, % charge balance error, pCO2, concentrations of B, NH4, Si, Total P, DOC and HS¯ |
| Related publications | None |
| Potential application(s) for these data | Defining baseline of groundwater pCO2 prior to CO2 injection for geological storage. Basic research on groundwater’s role in terrestrial carbon cycle. |
Citation: Kim et al. 2026: GEUS Bulletin 62. 8427. https://doi.org/10.34194/3g3zan56
Copyright: GEUS Bulletin (eISSN: 2597-2154) is an open access, peer-reviewed journal published by the Geological Survey of Denmark and Greenland (GEUS). This article is distributed under a CC-BY 4.0 licence, permitting free redistribution, and reproduction for any purpose, even commercial, provided proper citation of the original work. Author(s) retain copyright.
Received: 05 Feb 2026; Re-submitted: 30 Jun 2026; Accepted: 04 Jul 2026; Published: 05 Sep 2026
Competing interests and funding: The authors declare no competing interest.
This work was funded by the Danish Research Reserve (Forskningsreserven 2025).
*Correspondence: hk@geus.dk
Keywords: groundwater chemistry, dissolved inorganic carbon, PHREEQC, freshwater carbonate system
Abbreviations:
DGU: Danish Geological Survey
DOC: Dissolved organic carbon
GRUMO: National Groundwater Monitoring Program
IC: Ion Chromatography
ICP-OES: Inductively Coupled Plasma – Optical Emission Spectroscopy
LOD: limit of detection
MS: Mass Spectrometry
MST: Ministry of Environment
pCO2: partial pressure of CO2
TA: measured total alkalinity
Edited by: Kristian Svennevig (GEUS, Denmark)
Reviewed by: Two anonymous reviewers
1 Introduction
Although sensors for direct measurement of aquatic partial pressure of CO2 (pCO2) are available, their high cost limits their employment, particularly in large-scale national monitoring networks. Instead, pCO2 is generally derived indirectly from water chemistry. A common and simple approach involves estimating pCO2 from alkalinity and pH using the following equation (Eq. 1):

where KH represents Henry’s Law Constant for CO2 (3.4 × 10⁻² mol/L/atm at 25°C), and Ka1 is the first dissociation constant of carbonic acid (10–6.35 at 25°C).
This approach assumes that the measured total alkalinity (TA) is predominantly composed of bicarbonate (HCO3–) and carbonate (CO32– ) ions, and the contributions of non-carbonic alkalinity such as N-alkalinity (NH4+), S-alkalinity (HS– and S2–), Si-alkalinity (HSiO3– and SiO32–), B-alkalinity (B(OH)4–), P-alkalinity (H3PO4, HPO42–, and PO43–), and organic acid (Org–) are negligible (Eq. 2; Stumm & Morgan 1996):
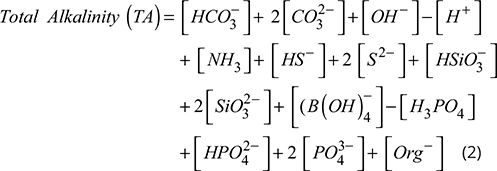
While this simplification is valid for most neutral freshwater conditions, it can lead to an overestimation of pCO2 in environments where non-carbonic alkalinity is high, such as organic-rich, acidic conditions or highly reduced conditions (Stumm & Morgan 1996; Abril et al. 2015).
To mitigate these limitations, geochemical modelling such as PHREEQC (Parkhurst & Appelo 2013) is employed. Unlike the simple carbonate equilibria approach, PHREEQC treats alkalinity as an input parameter that includes both carbonate and non-carbonate alkalinity. It computes pCO2 comprehensively by accounting for ionic strength, ion speciation, charge, and mass balance. Furthermore, the calculated charge balance error can serve as diagnostic tool for analytical quality, ensuring the robustness of the resulting estimates (Pötter et al. 2021).
In Denmark, despite the availability of extensive, long-term groundwater chemistry records, the carbonate system has historically received limited attention, as monitoring efforts have prioritised agricultural contamination. Furthermore, the inherent complexity of the national database requires specific expertise to extract reliable pCO2 estimates. This study presents a nationwide pCO2 data set for Danish groundwater calculated via PHREEQC, provided alongside estimates derived from (Eq. 1) for comparative analysis.
2 Data sources
All available groundwater chemistry data were retrieved from the national borehole database, Jupiter (Hansen & Pjetursson 2011; Fig. 1), in April 2024. The data set primarily comprises samples collected under the Danish National Groundwater Monitoring Program (GRUMO; Thorling et al. 2025), supplemented by the Groundwater Quality Control of abstraction wells for public water supply program (Boringskontrol; Miljø og Ligestillingsministeriet 2025) and various ad-hoc independent projects.
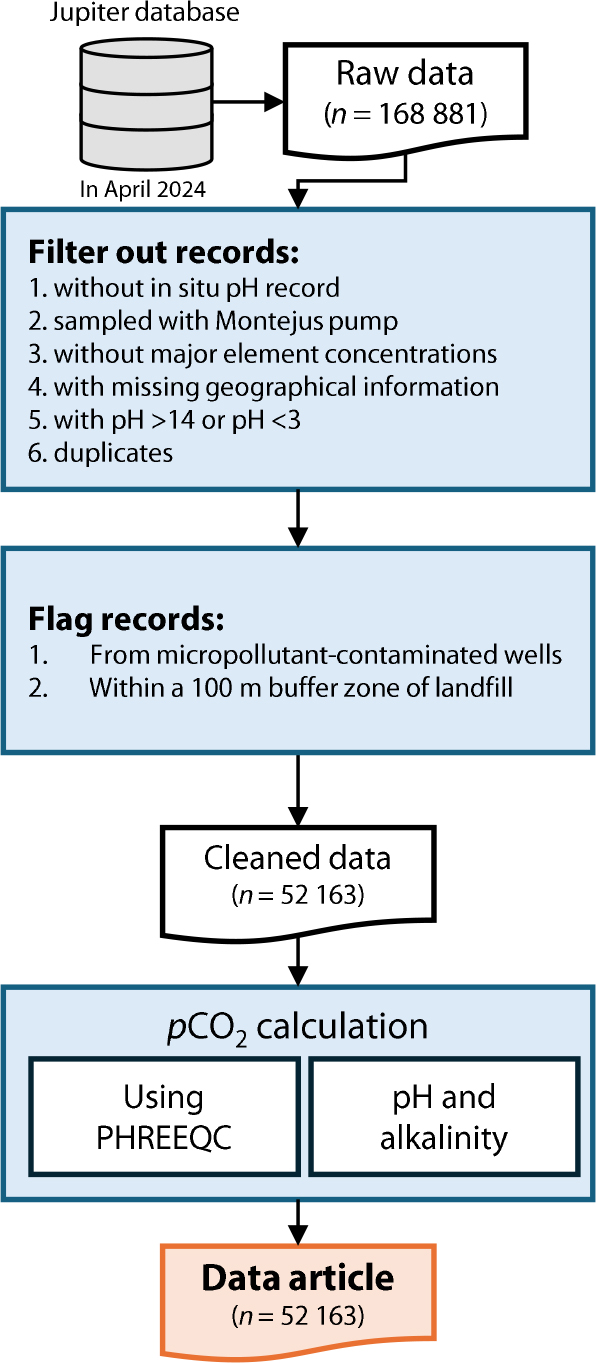
Fig. 1 Flow chart of data processing and pCO2 calculation.
3 Analytical methods
Groundwater samples were analysed by various accredited commercial laboratories around Denmark. While analytical techniques have evolved over the past three decades, data continuity and quality have been maintained through standardised national protocols and regulations for groundwater sampling and laboratory analysis (Thorling 2023; Miljøstyrelsen 2025).
In accordance with these standards, pH is typically measured on-site using a closed flow cell connected to the pump and hose to ensure stability and minimise atmospheric CO2 exchange. Alkalinity is determined by potentiometric acid titration, including Gran titration or other standardised titrimetric methods. For elemental analysis, major and minor elements as well as trace metals are analysed using Inductively Coupled Plasma – Optical Emission Spectroscopy (ICP-OES) or Mass Spectrometry (MS). Anions are quantified using Ion Chromatography (IC). Additionally, dissolved silicate and sulphide are determined using colorimetric and spectrophotometric methods, respectively.
4 Data cleaning and quality control
The extracted data set underwent a rigorous filtering process to ensure the reliability of the groundwater pCO2 calculations. Initially, records lacking TA measurements and erroneous in-situ pH values (defined as <3 or >14) were excluded. A primary concern in pCO2 estimation is the high susceptibility of groundwater to degassing during sampling, as it is typically supersaturated relative to the atmosphere. The sampling method significantly influences this risk. Specifically, the Montejus pump, which is efficient for narrow or short-screened wells, uses pressurised N2 gas to lift water. This method can strip dissolved CO2 from the sample. Consequently, all samples collected via Montejus pumps were removed from the data set.
The data set was further refined by removing records based on the following criteria:
- Absence of major cations (Ca2+, Mg2+, Na+, and K+) and anions (NO3-, SO42-, and Cl-) analyses
- Missing geographical coordinates or depths to the screen intervals
- Duplicates
Finally, environmental contamination, particularly from organic pollutants, can substantially affect the inorganic system in groundwater. Rather than excluding these samples, we implemented a flagging system to alert users to potential biases. This allows researchers to decide whether to include these records based on their specific study goals. Samples were flagged if they were collected from boreholes identified by Danish Ministry of Environment (MST) as impacted by micro-organic pollutants or located within a 100 m buffer zone from a known landfill. After following this quality control and flagging process, the final cleaned data set comprised 52 163 records (Fig. 1).
5 pCO2 calculations
5.1 Geochemical modelling (PHREEQC)
Geochemical modelling was performed using PHREEQC to calculate pCO2 based on the comprehensive groundwater chemistry data in the cleaned data set. Beyond TA and pH, the model incorporated nutrient species (NO3–, NO2–, NH4+ and total P), major ions (e.g., Ca2+, Mg2+, Na+, K+, Cl-, SO42-, Si) and a suite of minor ions (e.g., B, Sr2+, Ba2+), and trace metals (e.g., Fe, Al, Mn). The temperature was set at 10°C to represent Danish groundwater conditions.
While non-carbonate alkalinity elements such as silicate, sulphide and B were measured at much lower frequencies than major elements, their impact on the carbonate system was assessed as insignificant. Given that nearly all groundwater samples exhibited a pH below nine, where dissolved Si exits primarily as neutral silicic acid, the contribution of the Si-alkalinity is negligible. Similarly, the concentrations of B, S, NH4+ and P were significantly lower than TA, confirming their minimal contributions to TA (Fig. S1 in Supplementary Material).
Our PHREEQC calculations did not include organic acids because GRUMO does not include organic acids in the analyses. Since dissolved organic carbon (DOC) is part of the program, we estimated the contribution of organic acids to TA based on an empirical relationship (Eq. 3) between DOC and total organic acid (HAT) in natural waters (Morel et al. 1993):

While DOC in Danish groundwater varied between non-detectable and 970 mg/L (mean: 2 mg/L), the ratio of estimated HAT to TA was less than 0.05 in 97% of the samples (Fig. S1), indicating insignificant contributions of organic acids in most cases.
Before calculation, values reported below the limit of detection (LOD) were converted to half of the detection limit (LOD/2). To handle the large-scale national data set, a custom Python routine was developed to automate the PRHEEQC calculations (Dideriksen 2025).
5.2 pCO2 estimates using carbonate equilibria
For comparison with the PHREEQC results, pCO2 was estimated using the simple carbonate equilibria approach, assuming TA is dominated by carbonate species. In this simplification, HCO3– is derived from TA and the measured pH is follows:

Given that CO32– is related to HCO3– by the second dissociation constant (Ka2),

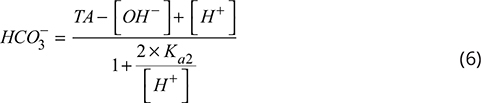
Once the HCO3– concentration was determined, pCO2 was calculated (using Eq. 1). All equilibrium constants (KH = 5.1 × 10⁻²; Ka1 = 10–6.45; Ka2 = 10–10.49) were adjusted to 10°C (Harned & Scholes 1941; Harned & Davis 1943; National Institute of Standards and Technology [NIST] 2025).
6 Data description and main features
6.1 Data structure
The data set is structured to provide both the calculated pCO2 values and the necessary geospatial and groundwater chemical metadata for future uses. Each record is characterised by five primary data categories: (1) identifiers; (2) spatial and temporal information; (3) groundwater chemistry metadata; (4) calculated pCO2 values; and (5) quality flags (Table 1).
For identifiers, the data set provides two well identification numbers (DGUNR and BORID), screen identifier (INDTNR), and unique sample IDs (PROEVEID). A unique feature of the Jupiter database is the dual-identification system for boreholes. Each borehole is assigned with both a Danish Geological Survey (DGU) number (DGUNR) and a Borehole ID (BORID). The DGU number is official and traditional nomenclature, and is the standard for searching the Jupiter database; however, the inclusion of dots and spaces makes it prone to formatting errors during data processing. Whereas BORID is a unique integer-based serial number assigned internally by the Jupiter database. In this data set, the BORID is used as primary key for data management and joining tables to ensure computational integrity, while the DGUNR is retained to ensure compatibility with official records and manual database queries.
For the spatial and temporal information, X and Y coordinates (XUTM32EUREF89 and YUTM32EUREF89) within the EUREF89 UTM 32N system, depths to the screen top and bottom (INDTTOP and INDTBUND, respectively), and sampling dates (PROEVEDATO) were provided (Table 1). Groundwater chemistry metadata include in-situ pH (pH) and TA (HCO3). Where available, concentrations of non-carbonate alkalinity elements such as B, NH4, Si, P, DOC and HS– were included. Below-LOD values are shown as negative of LODs. pCO2 values estimated using both approaches – using PHREEQC (pCO2_atm) and the carbonate equilibria (pCO2_atm_CS) – were also included in this file. Finally, quality flags such as landfill buffer zones (Landfill_Flag) and microorganic pollutants (MD_MFS_Flag) were flagged as ‘1’. The percentage errors of charge balance (pct_err) from the PHREEQC calculation are also provided in the data set as a measure of analytical quality.
6.2 Charge balance error as a data quality indicator
Water is electrically neutral; therefore, the charge of solutes in water should be balanced. When the charge is not balanced, this can be an indication of errors in data such as analytical uncertainty or mistakes in entry or recording. In general, ±5% of charge balance errors are considered as an acceptable range (Pötter et al. 2021), and 92% of our data (n = 48 502) showed charge balance error within this range (Fig. 2a). Data outside this range should be used with caution.
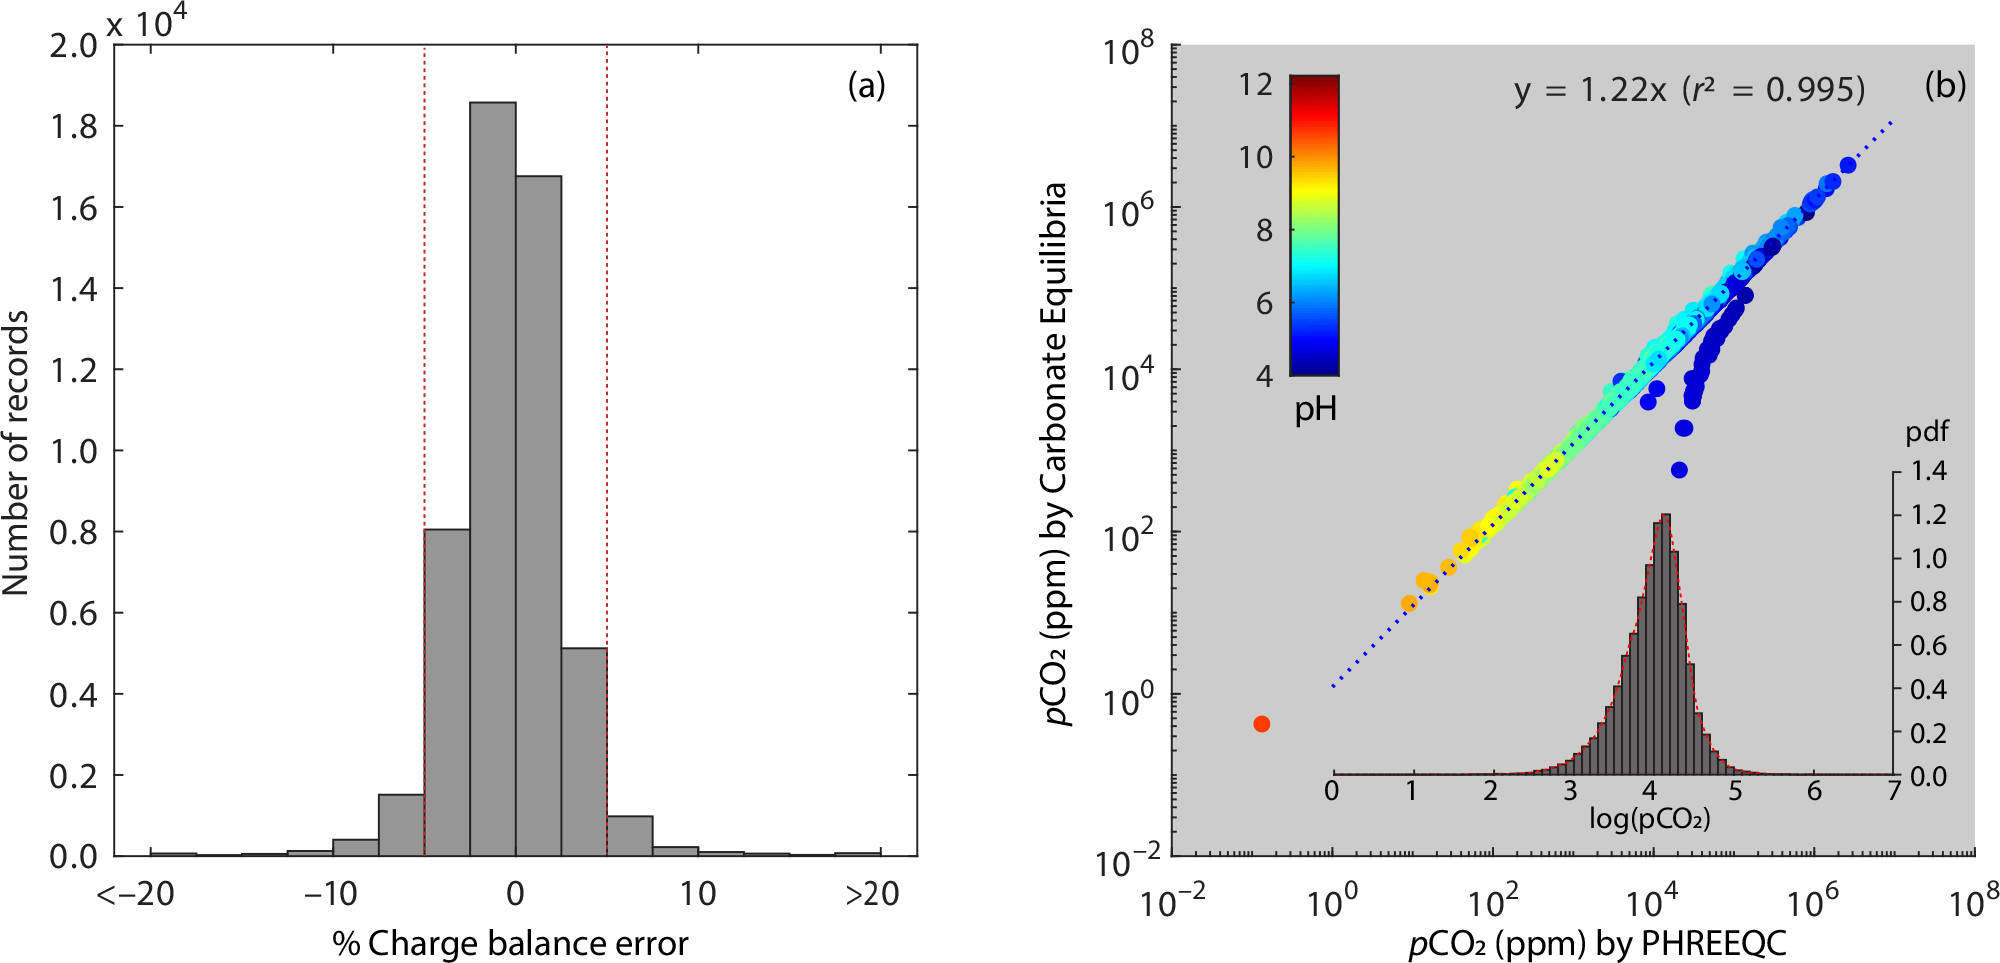
Fig. 2 Histogram of % charge balance error (a) and comparison of pCO2 (ppm) values calculated by PHREEQC vs. carbonate equilibria after excluding % charge balance errors outside the threshold (±5%; b). The red vertical lines in (a) mark the threshold. A histogram of log (pCO2 ppm) calculated by PHREEQC is shown in (b). The Y-axis of the histogram was normalised to a probability density function (pdf).
6.3 pCO2 calculated using PRHEEQC vs. carbonate equilibria
Our data set presents pCO2 values calculated with both PHREEQC and the carbonate equilibria (Eq. 1). Although these two values show a strong positive correlation, the values estimated using the carbonate equilibria were about 22% higher than those by PHREEQC (Fig. 2b). This consistent difference may be attributed to ion-pairing of HCO3– with other major cations such as Ca2+ and Na+, which PHREEQC accounts for but the simplified equation does not.
A specific group of samples showed greater differences between two methods. These samples were characterised by low pH (4–5) and alkalinity values below the LOD (1 mg/L as HCO3–). For these samples, pCO2 was estimated by converting TA values to LOD/2, and they are shown as negative of LODs in the data set. Further, at these low values, non-carbonate contributions to alkalinity that may or may not have been measured could potentially be more important—for example DOC or HPO42–. So, values with TA < LOD, marked as negative values, are highly uncertain and should be used with caution.
6.4 An overview of groundwater pCO2
The mean of groundwater pCO2 in Danish aquifer was 9772 ppm (log [pCO2 ppm] = 3.99) after excluding data with the charge balance errors outside the ±5% range (Fig. 2b). This is approximately 24 times higher than the atmospheric level (Fig. 2b). Our data also showed that groundwater pCO2 varies over seven orders of magnitude (<1 to 2 640 200 ppm). Lower than 1 ppm values (n = 3) were found under highly alkaline conditions (pH = 10.7–12.2) with moderate to high TA (96–542 mg/L as HCO3–). Six samples were estimated to have pCO2 greater than 1 atm. These samples are predominantly from the landfill buffer zones with a pH range 5–6 (mean: 5.4), an alkalinity range 205–1880 mg/L as HCO3– (mean: 632), and a DOC range 1–68 mg/L (mean: 15). According to the empirical relationship between HAT and TA (Eq. 3), the organic acid contribution to TA was estimated to be less than 2%. Therefore, these exceptionally high pCO2 values may result from active microbial processes in the contaminated sites, leading to the buildup of gas pressure within the aquifers.
The groundwater pCO2 data covers the entire country (Fig. 3a) with a depth range of 0–378 m (Fig. 3b). Most records are from shallow groundwater (<50 m below the land surface), and the frequency of measurement decreases with increasing depth (Fig. 3b). Groundwater pCO2 concentrations generally decreased with increasing depth (Fig. 3b). This trend may be because the aquifer transitions into a closed system, where CO2 is consumed during silicate and carbonate weathering processes without being replenished from the soil zone.
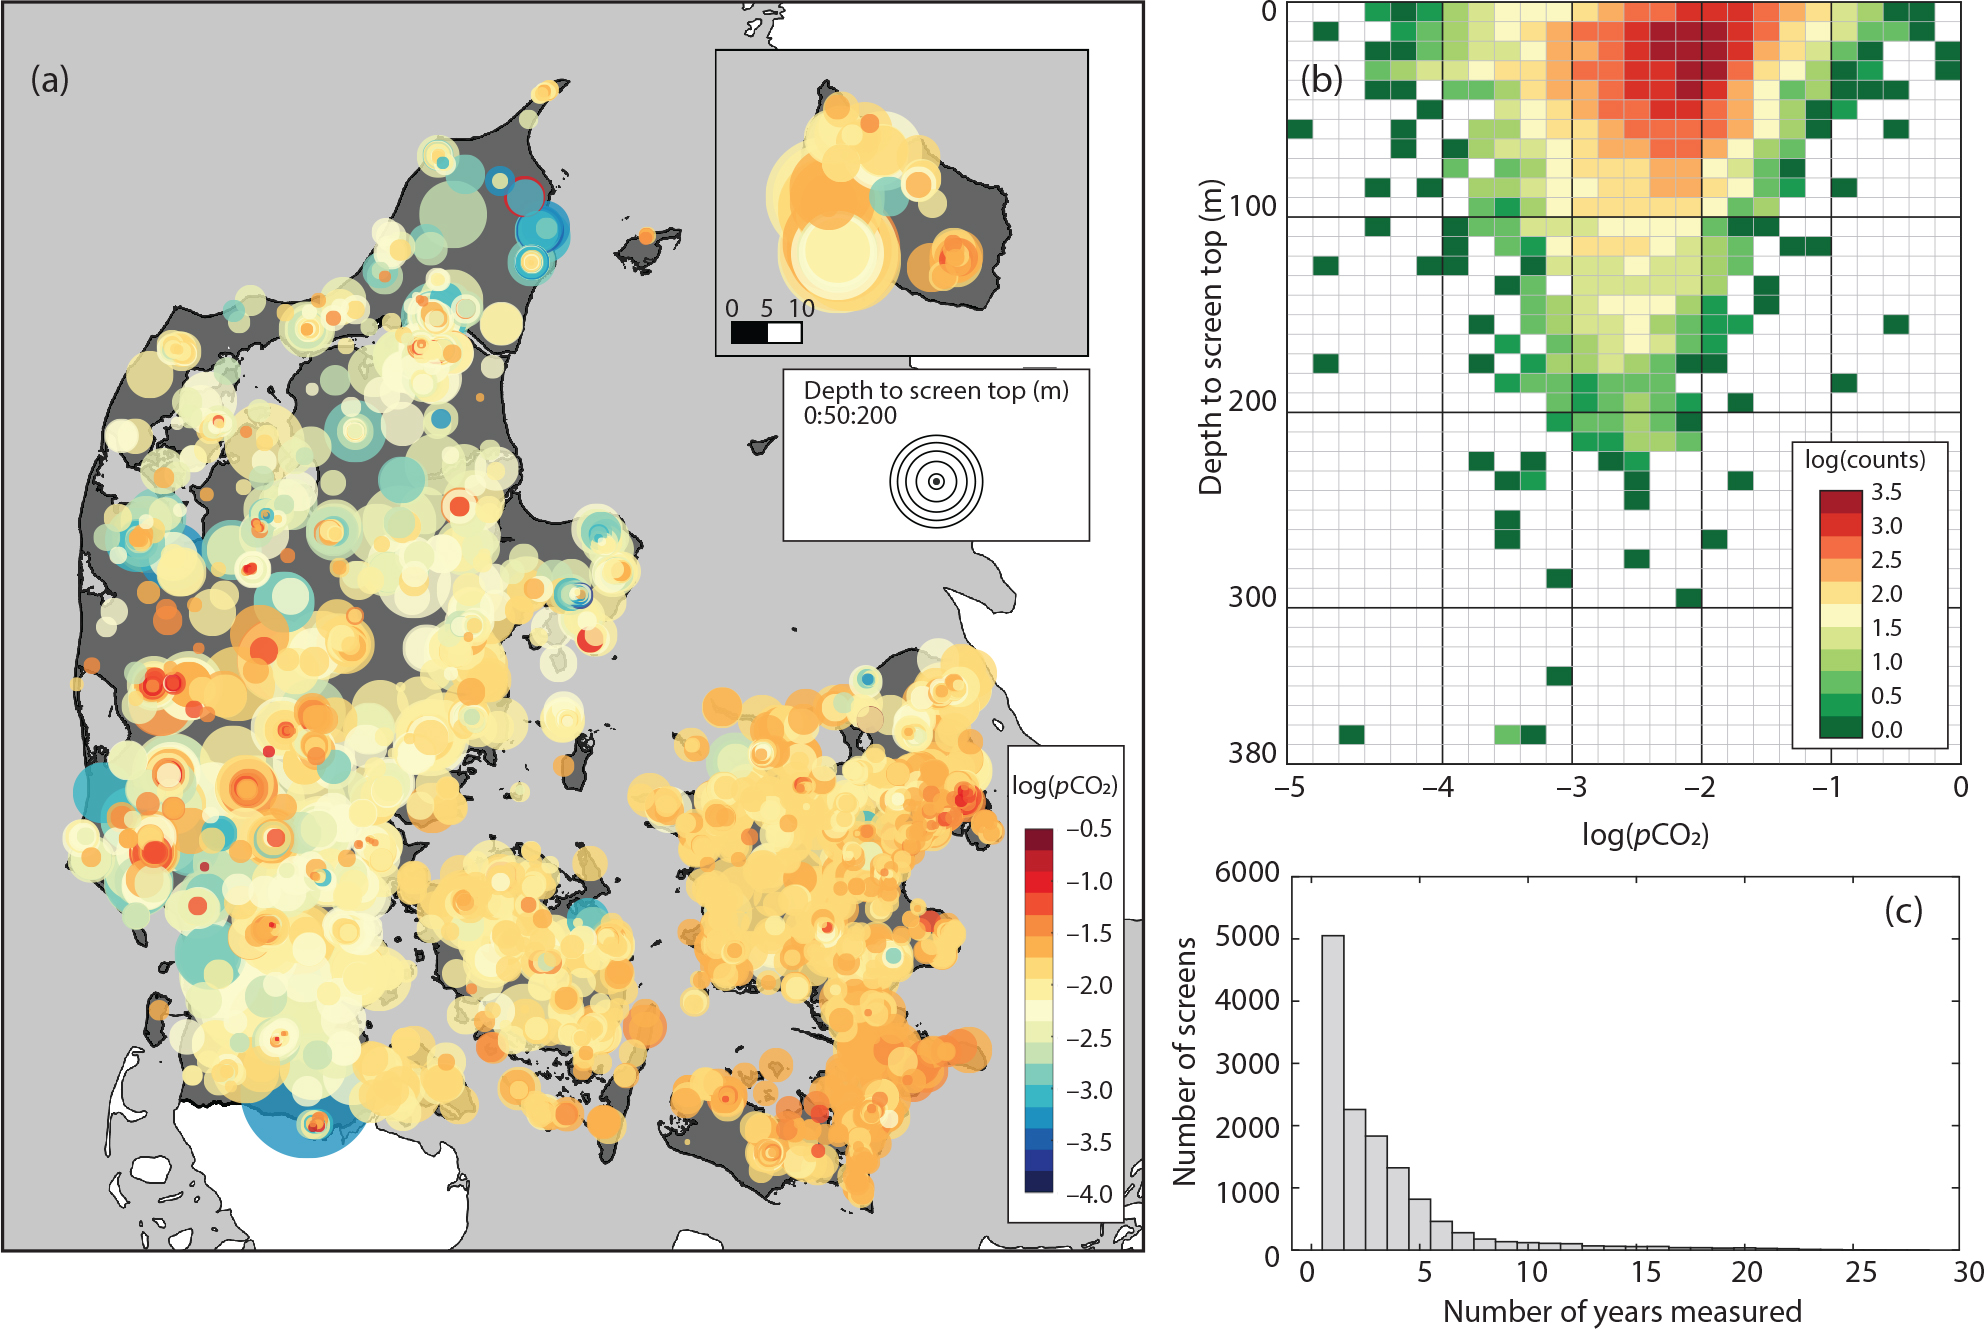
Fig. 3 National map of groundwater pCO2 (atm) by PHREEQC (a). The map shows screens measured at least five times over the entire monitoring period. The pCO2 values are shown by colour. The circle size shows the depth to the top of the screen. (b) Heatmap of pCO2 (atm) with depth to the screen top. (c) histogram of number of years measured at the screen level.
In total, 13 501 screens are included in the data set. Due to multiple reformation and revision of the GRUMO, the temporal coverage varies significantly across the country. As the monitoring program primarily focuses on agricultural contamination, parameters such as nitrate are sampled more frequently than carbonate species. The sample frequency for TA was higher during the 1990s, with samples collected one to four times a year. In the following years, the frequency decreased to once every 1–3 years. Water supply wells are typically sampled every 3–5 years, and wells at polluted sites are often sampled only for a short period. Approximately 38% of the screens were sampled for only a single year across the entire period (Fig. 3c). Only 147 screens have been measured 20 or more times for TA over the monitoring periods, and these measurements do not necessarily occur in consecutive years. This heterogeneity reflects the historical evolution of the monitoring network and its sampling density over the past three decades.
6.5 Data applications and implications
Inland waters such as lakes, streams, and wetlands have emerged as a significant yet often unaccounted CO2 source of terrestrial ecosystems (Raymond et al. 2013). While groundwater represents one of the largest terrestrial carbon storages and is typically characterised by high pCO2 compared to the atmosphere (Curtis Monger et al. 2015), its specific contribution to the global carbon cycle has not received sufficient attention. This national, long-term data set of groundwater may contribute to a better understanding of the role groundwater plays in terrestrial carbon cycles as well as the transfer of carbon from land to the ocean.
In addition, as the use of the deep subsurface for applications such as carbon capture and storage (CCS) develops rapidly, it is critical to establish robust baselines of groundwater chemistry. These baselines are essential for monitoring the integrity of captured CO2 and protecting groundwater as a valuable drinking water resource. Groundwater pCO2 may be a primary indicator of activities affecting groundwater quality. Therefore, our data play an important role in defining natural variabilities of groundwater pCO2, which is necessary to detect anomalous signals and potential leakage in groundwater systems.
Acknowledgements
This work is funded by the Danish Research Reserve (Forskningsreserven 2025). We would like to thank Mette Hilleke Mortensen for providing information about Montejus pump screens. We thank the two anonymous reviewers for their comments which improved the manuscript.
Additional information
Author contributions
HK: conceptualisation, methodology, formal analysis, visualisation, writing-original draft, and writing-review & editing; LT: Data curation, methodology, and writing-review & editing; RJ: Conceptualisation, methodology, supervision, and writing-review & editing
Additional files
Three supplementary files are available at https://doi.org/10.22008/FK2/UHONBF. These include: Groundwater_pCO2.xlsx, Readme.txt and Supplementary_Figure (Figure S1).