 |
DATA ARTICLE  |
Fly ash as a potential multi-commodity resource: data set on elemental composition across eight precipitation stages in a Danish MSWI plant
Rune Joachim Clausen1*  , Jakob Kløve Keiding1
Abstract
Municipal solid waste incineration generates fly ash, which is increasingly viewed as a potential secondary raw material. We present multi-element analyses of fly ash from the ARGO plant at Roskilde, Denmark. Samples were collected with a sampling cylinder from eight sequential outlets for 15 days, yielding 120 samples. These were then composited by outlet, sieved at 2 mm and all size fractions (n = 16) analysed by inductively coupled plasma mass spectrometry and optical emission spectrometry. This is the first data set to report elemental compositions across individual precipitation stages while distinguishing particle sizes. The data show that existing fly ash sub-streams possess greater individual recycling potential than bulk fly ash. Notably, coarse fractions and bag-filter ash are enriched in Zn and other volatile elements (Na, K, Cl and S), including metals exceeding regulatory thresholds for hazardous waste classification (e.g. Pb, Cd, Sb and Cu). Their co-occurrence with Zn highlights the multi-commodity recovery potential of fly ash and suggests that improved control of formation and precipitation processes could enable more selective and efficient recycling strategies. There are grounds for further statistical analysis of the data and mineralogical studies of the sample material archived at the Geological Survey of Denmark and Greenland.
Tabular abstract:
| Geographical coverage | ARGO municipal solid waste incineration (MSWI) plant in Roskilde, Denmark. |
| Temporal coverage | November 2023. |
| Subject(s) | Geochemistry and geochronology, energy and resources. |
| Data format(s) | Raw geochemical data in .csv format. |
| Sample collection & analysis | Samples (n = 120) were obtained from eight different precipitation outlets at the plant once a day for 15 days. Composite samples (n = 8) of each outlet series were made and then sieved into size fractions (0–2 mm and > 2 mm). The size-fractioned composite samples (n = 16) were then analysed with ICP-MS and ICP-OES. |
| Parameters | Concentration of elements (n = 60): major and trace elements. |
| Data availability | All data files are available at https://doi.org/10.22008/FK2/5OBYRU |
| Related publications | Clausen et al. (2019): https://data.geus.dk/pure-pdf/MiMa-R_2019_01_web.pdf Feltrin et al. (2024): https://www.nordicinnovation.org/2024/information-management-and-classification |
| Potential application(s) for these data | The data allow for further analyses to increase the understanding of the chemistry at each precipitation stage of FA as well as FA mineralisation, formation and recyclability. |
Citation: Clausen et al. 2026: GEUS Bulletin 62. 8419. https://doi.org/10.34194/k7mxv763
Copyright: GEUS Bulletin (eISSN: 2597-2154) is an open access, peer-reviewed journal published by the Geological Survey of Denmark and Greenland (GEUS). This article is distributed under a CC-BY 4.0 licence, permitting free redistribution, and reproduction for any purpose, even commercial, provided proper citation of the original work. Author(s) retain copyright.
Received: 30 Oct 2025; Re-submitted: 17 Mar 2025; Accepted: 5 May 2025; Published: 7 Oct 2026
Competing interests and funding: The authors declare no competing interests.
This study was funded by the Geological Survey of Denmark and Greenland (GEUS) and Nordic Innovation.
*Correspondence: rjc@geus.dk
Keywords: municipal solid waste incineration, resource characterisation, alkali metal, recycling, zinc valorisation
Abbreviations:
BA: bottom ash
FA: fly ash
GEUS: Geological Survey of Denmark and Greenland
ICP-MS: inductively coupled plasma – mass spectrometry
ICP-OES: inductively coupled plasma – optical emission spectrometry
MSW: municipal solid waste
MSWI: municipal solid waste incineration
PCC: Pearson’s correlation coefficient
WtE: waste-to-energy
Edited by: Hyojin Kim (Geological Survey of Denmark and Greenland, Denmark)
Reviewed by: Stephanie Lode (Geological survey of Norway, Norway), Ole Hjelmar (Danish Waste Solutions ApS, Denmark)
1 Data collection
This study investigated the spatial variability and internal heterogeneity of elemental compositions in fly ash (FA) from the ARGO municipal solid waste incineration (MSWI) plant in Roskilde, Denmark (Fig. 1). The new data can inform further assessments of FA from similar incineration facilities as a potential multi-commodity resource.
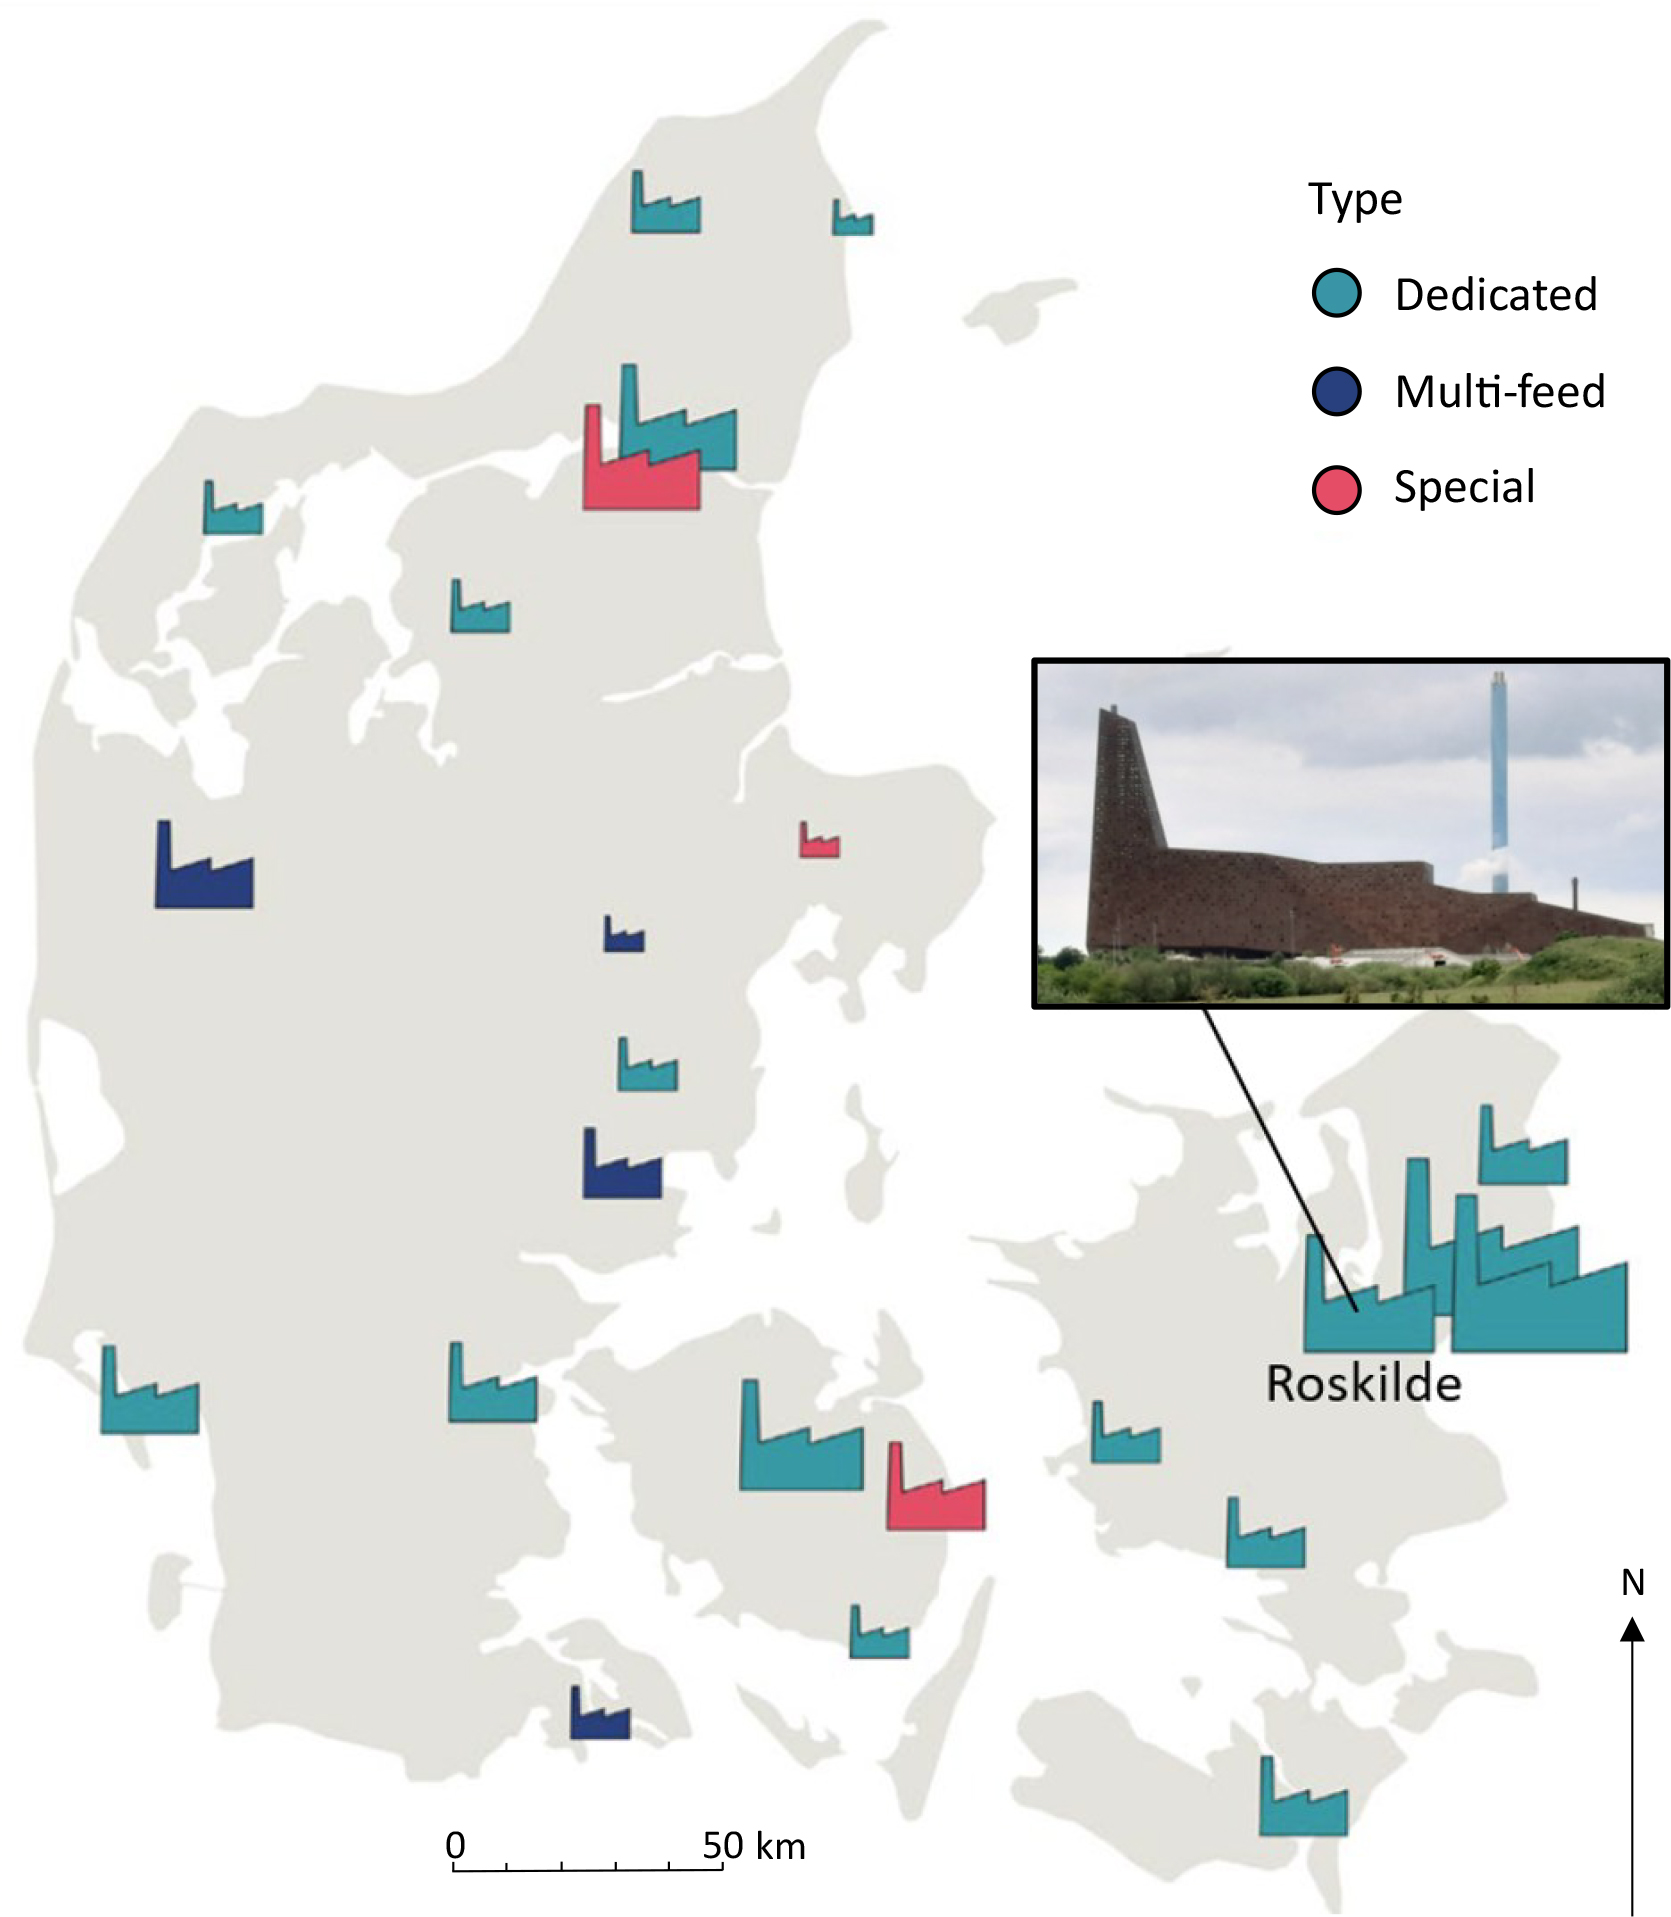
Fig. 1 MSWI (municipal solid waste incineration) facilities in Denmark, scaled by annual capacity and categorised by type (Energistyrelsen 2022). Types: Dedicated (≥ 80% household/commercial waste; 19 facilities), Multi-feed (household/commercial waste plus biomass/natural gas; four facilities) and Special (co-incineration of household or hazardous waste; three facilities). Modified after Feltrin et al. (2024).
1.1 Background
The ARGO MSWI plant in Roskilde (Fig. 1) is a combined heat and power plant, which operates two moving-grate furnaces. In 2023, it treated 348 kt of waste, generating approximately 1 TWh of energy and 6 kt of FA. ARGO is Denmark’s third-largest incineration facility and forms part of a national system of 28 plants that together process about 3 Mt of municipal solid waste (MSW) annually, producing c. 50 kt of FA while supplying around 20% of district heating and 5% of electricity (Energistyrelsen 2022; DAKOFA 2024). Beyond Denmark, incineration constitutes a major component of Waste-to-Energy (WtE) systems worldwide, with more than 2900 WtE plants in operation (Supplementary File S3). A continuing shift towards greater use of incineration is anticipated (Chen et al. 2020; Abedin et al. 2025). This trend would increase the generation of incineration residues, which consist primarily of bottom ash (BA), FA and air-pollution-residues. FA generation is estimated at c. 4 Mt globally and c. 1.2 Mt in the EU. Table 1 summarises the residual waste treatment for Denmark, the EU and globally, together with associated quantities of BA and FA.
FA recycling is receiving increasing interest in industry and academia driven by increasing ash generation, stricter landfill regulations, rising disposal costs and the recovery potential of valuable metals (Fellner et al. 2015; Abedin et al. 2025; Ahmed et al. 2026). These pressures have led to the development of industrial treatment technologies for MSWI residues, primarily based on hydrometallurgical processes such as acid or alkaline leaching, electrodialysis and solution-based separation systems (Ottosen et al. 2006; Hjelmar et al. 2022; Perrin et al. 2023). Existing technologies target metals, salts or stabilisation but exhibit recovery limitations for untargeted fractions, particularly under varying operating conditions (Ottosen et al. 2006; Fellner et al. 2015; Zhang et al. 2021). Examples include Flugashen-Wäsche (FLUWA; metal recovery), Ash2Salt (salt recovery) and HaloSep, of which the latter combines washing and leaching to target multiple fractions.
Hydrometallurgical performance is strongly controlled by FA chemistry and mineralogy. Major elements such as Ca, Al, Fe, Si and P can hinder recovery when incorporated in stable phases (Ahmed et al. 2026). In contrast, chloride- and sulphate-bearing phases can dissolve during leaching (Bernasconi et al. 2022), thereby increasing the accessibility of metals for subsequent hydrometallurgical recovery. Metals such as Zn, Pb, Cu and Cd not only represent the primary value carriers but also drive hazardous classification if not removed (Ottosen et al. 2006; Fellner et al. 2015; Perrin et al. 2023).
FA composition is governed by thermochemical processes during combustion and flue-gas treatment. Volatile metals (e.g. Zn, Pb and Cd) evaporate in the furnace and subsequently condense onto fine particles or react with chloride-rich species in the air pollution control system, forming a multiphase material of chlorides, sulphates, oxides and amorphous aluminosilicates (Verhulst et al. 1996; Sabbas et al. 2003; Rissler et al. 2024). Recent studies show that FA is chemically and mineralogically heterogeneous and varies across particle-size fractions, with metals distributed between soluble salt phases and more stable silicate-, carbonate- and oxide-rich phases, which control metal speciation and leaching behaviour (Bernasconi et al. 2022; Rissler et al. 2024; Soylu et al. 2025; Keulen et al. 2026). This heterogeneity is also reflected spatially within incineration systems, where ash composition can vary along the boiler and flue-gas path (Allegrini et al. 2014). A thorough understanding of these formation-composition relationships is essential for developing MSWI plants with controlled generation of chemically distinct FA streams for targeted recovery as well as for predicting treatment efficiencies for any given recycling method. Consequently, FA studies benefit from sampling strategies that minimise post-formation alteration and preserve initial ash characteristics, which can be achieved by sampling as close as possible to the point of formation.
1.2 Sample collection
The ARGO plant in Denmark offers unique sampling across multiple precipitation stages, and FA was collected at all eight locations in this study (Fig. 2). To capture temporal variability, sampling was conducted as a two week time series with daily collections. At each stage, material was collected at the narrowing of the settling funnel (outlet or hopper). A cylinder was inserted across the flow to obtain a representative cross-sectional sample. Each cylinder was inserted until full, yielding approximately 0.5 to 1 L of material, with sampling durations ranging from 1 to 15 min depending on flow conditions. In total, 120 FA samples were collected over 15 consecutive days from the eight sample locations in November 2023. Photos of sampling can be viewed in Feltrin et al. (2024).
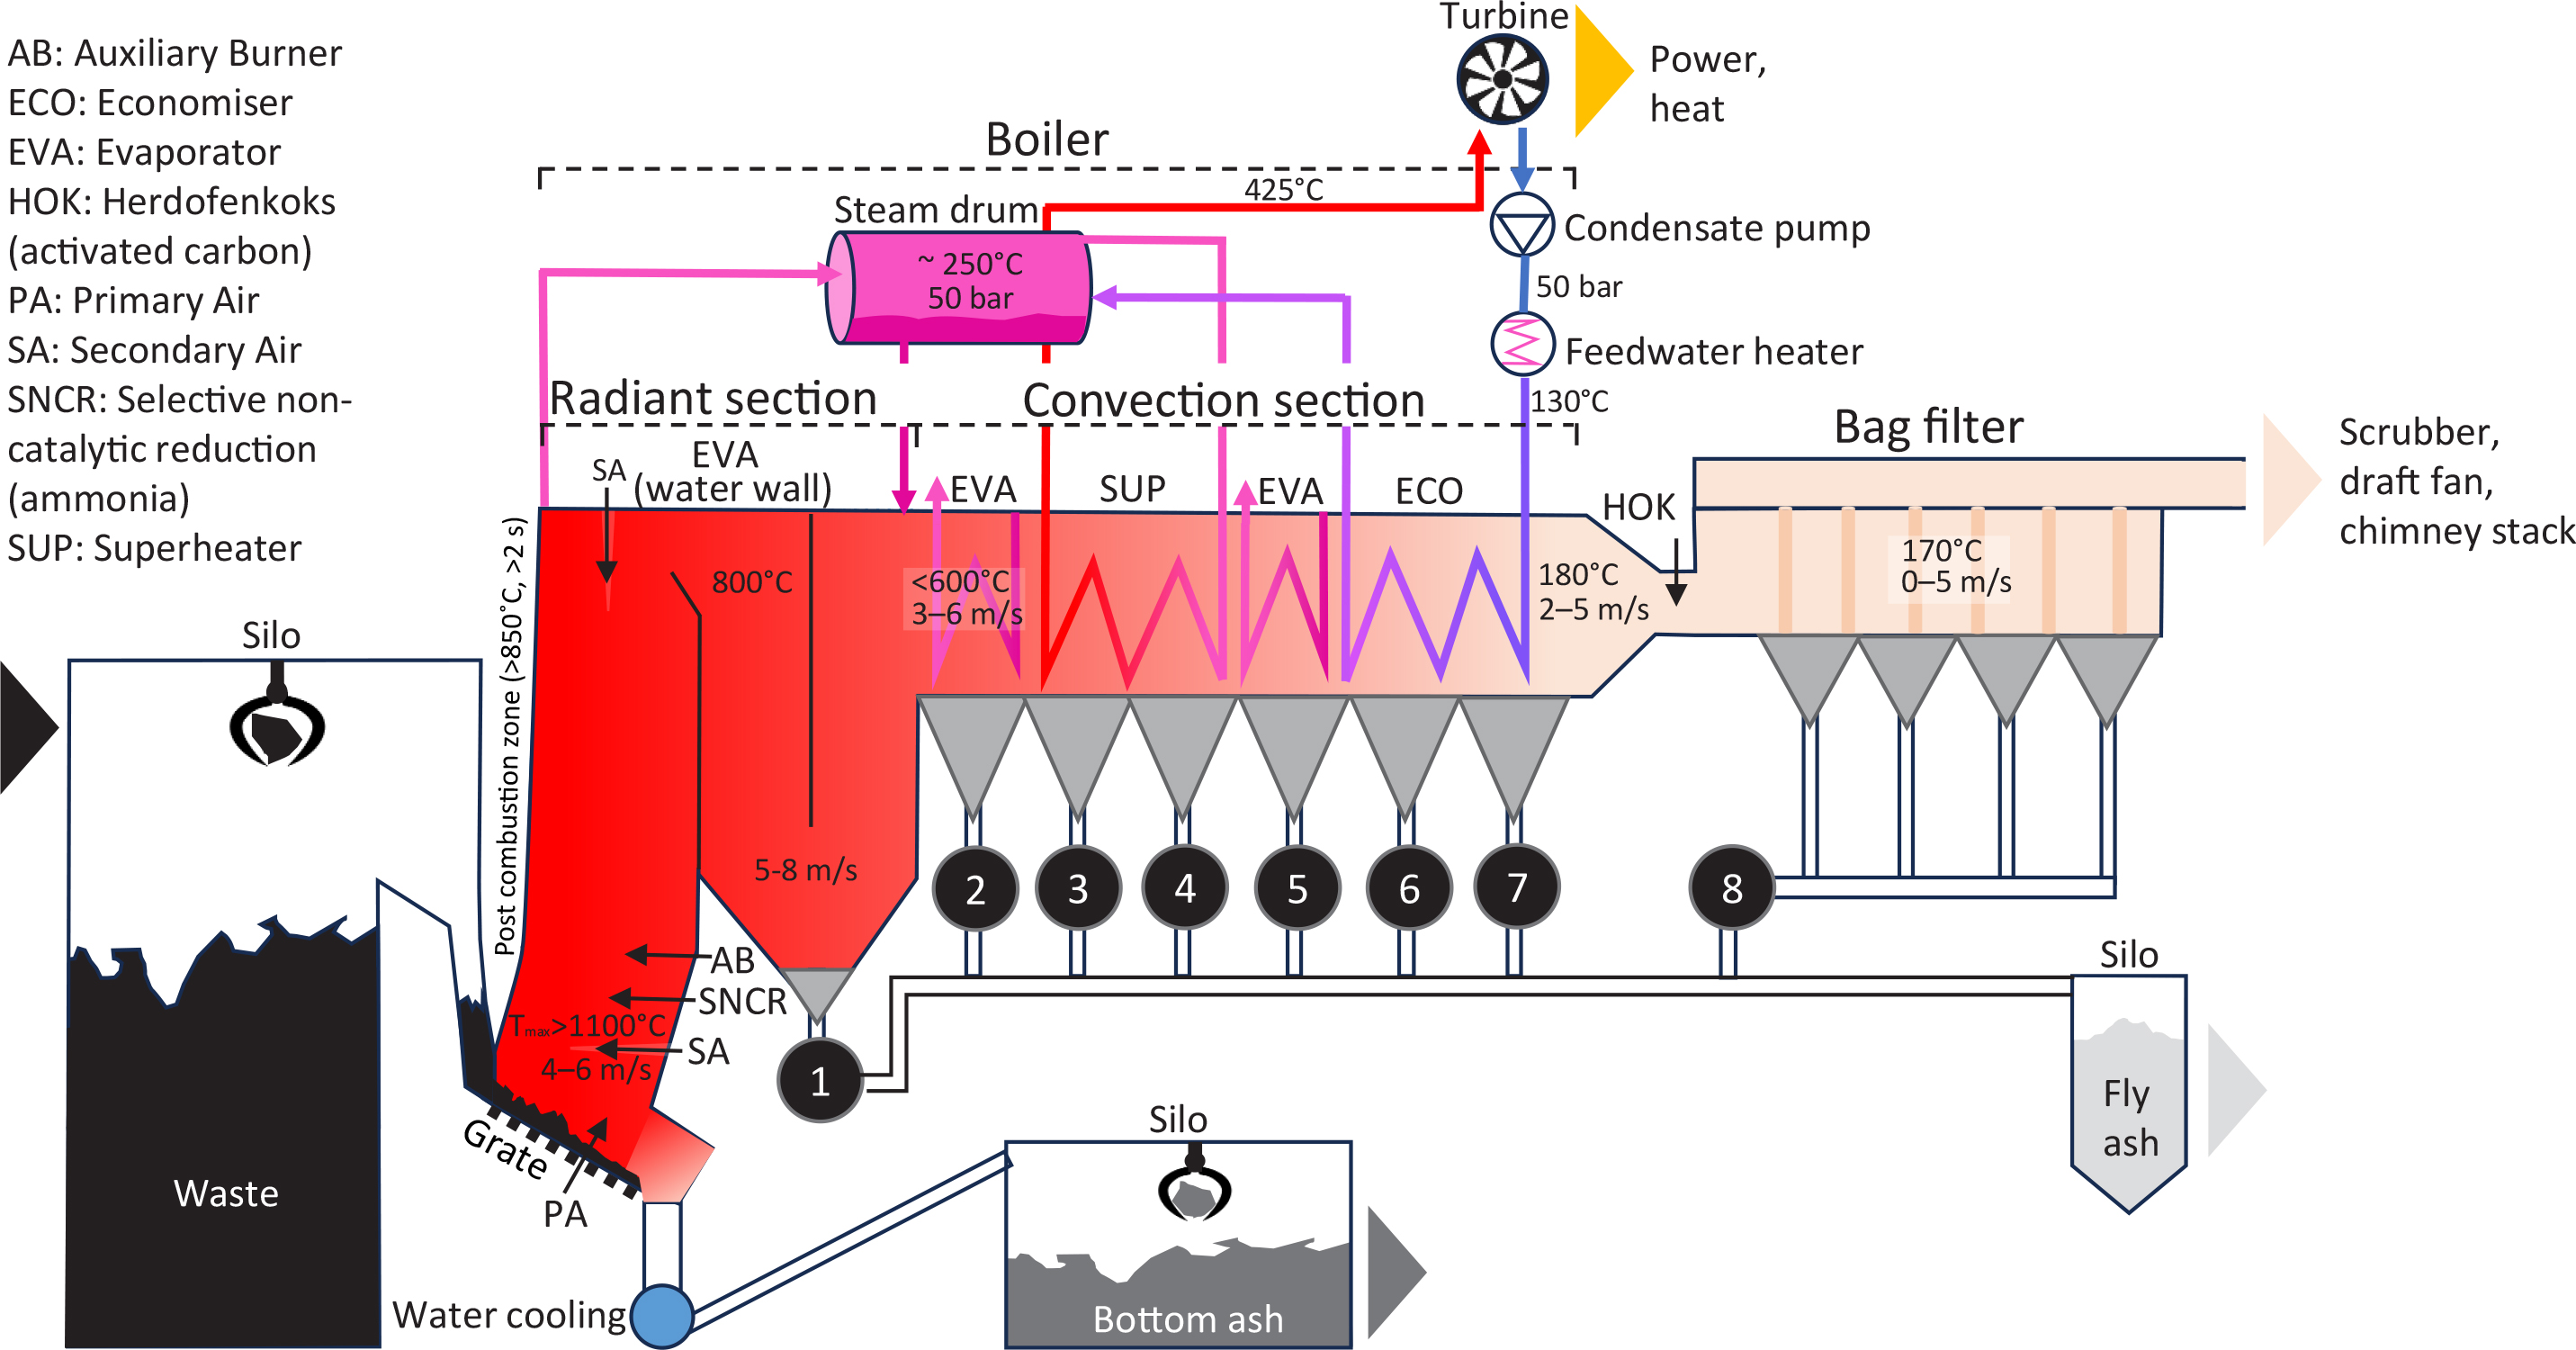
Fig. 2 Schematic diagram of Oven Line 6 at the ARGO plant and locations of fly ash (FA) sampling (numbered circles 1–8). Waste is homogenised in the silo and fed to a moving grate where drying, pyrolysis and combustion occur, leaving bottom ash. Combustion air is supplied as primary air through the grate and secondary air above the grate to enhance mixing and complete efficiency. Flue gas then rises into the high-temperature post-combustion zone (> 850°C, ≥ 2 s) to ensure complete combustion. Heat from the flue gas is transferred to the steam-water tube circuits via radiation and convection, generating steam to drive the turbine. Downstream, pollutants are removed by activated-carbon injection, bag filtration and multi-stage wet scrubbing prior to flu gas discharge through the stack. FA is collected from the boiler back-pass, convection-pass outlets and bag filter. Further details are provided in Supplementary File S4.
1.3 Composite samples
The 120 individual FA samples were composited by splitting and combining, resulting in eight bulk samples, one for each sampling location. To address the observed particle-size heterogeneity, each composite was sieved at 2 mm, producing two fractions (0–2 mm and > 2 mm, hereafter referred to as the fine fraction and the coarse fraction, respectively) for each of the MSWI outlets.
1.4 Observations
The sampled FA consists mostly of the fine fraction (76–97% of the composite sample mass; Table 2) with slight, but systematic colour change from light brown (outlet 1) to light grey (outlet 8). At close range, the fine fractions appear dotted with white particles. The coarse fraction consists of brittle fragments, appearing either with observable porosity and agglomeration (Fig. 3A) or as tube crustations released by rapping (Fig. 3B) or both mixed (Fig. 3C).
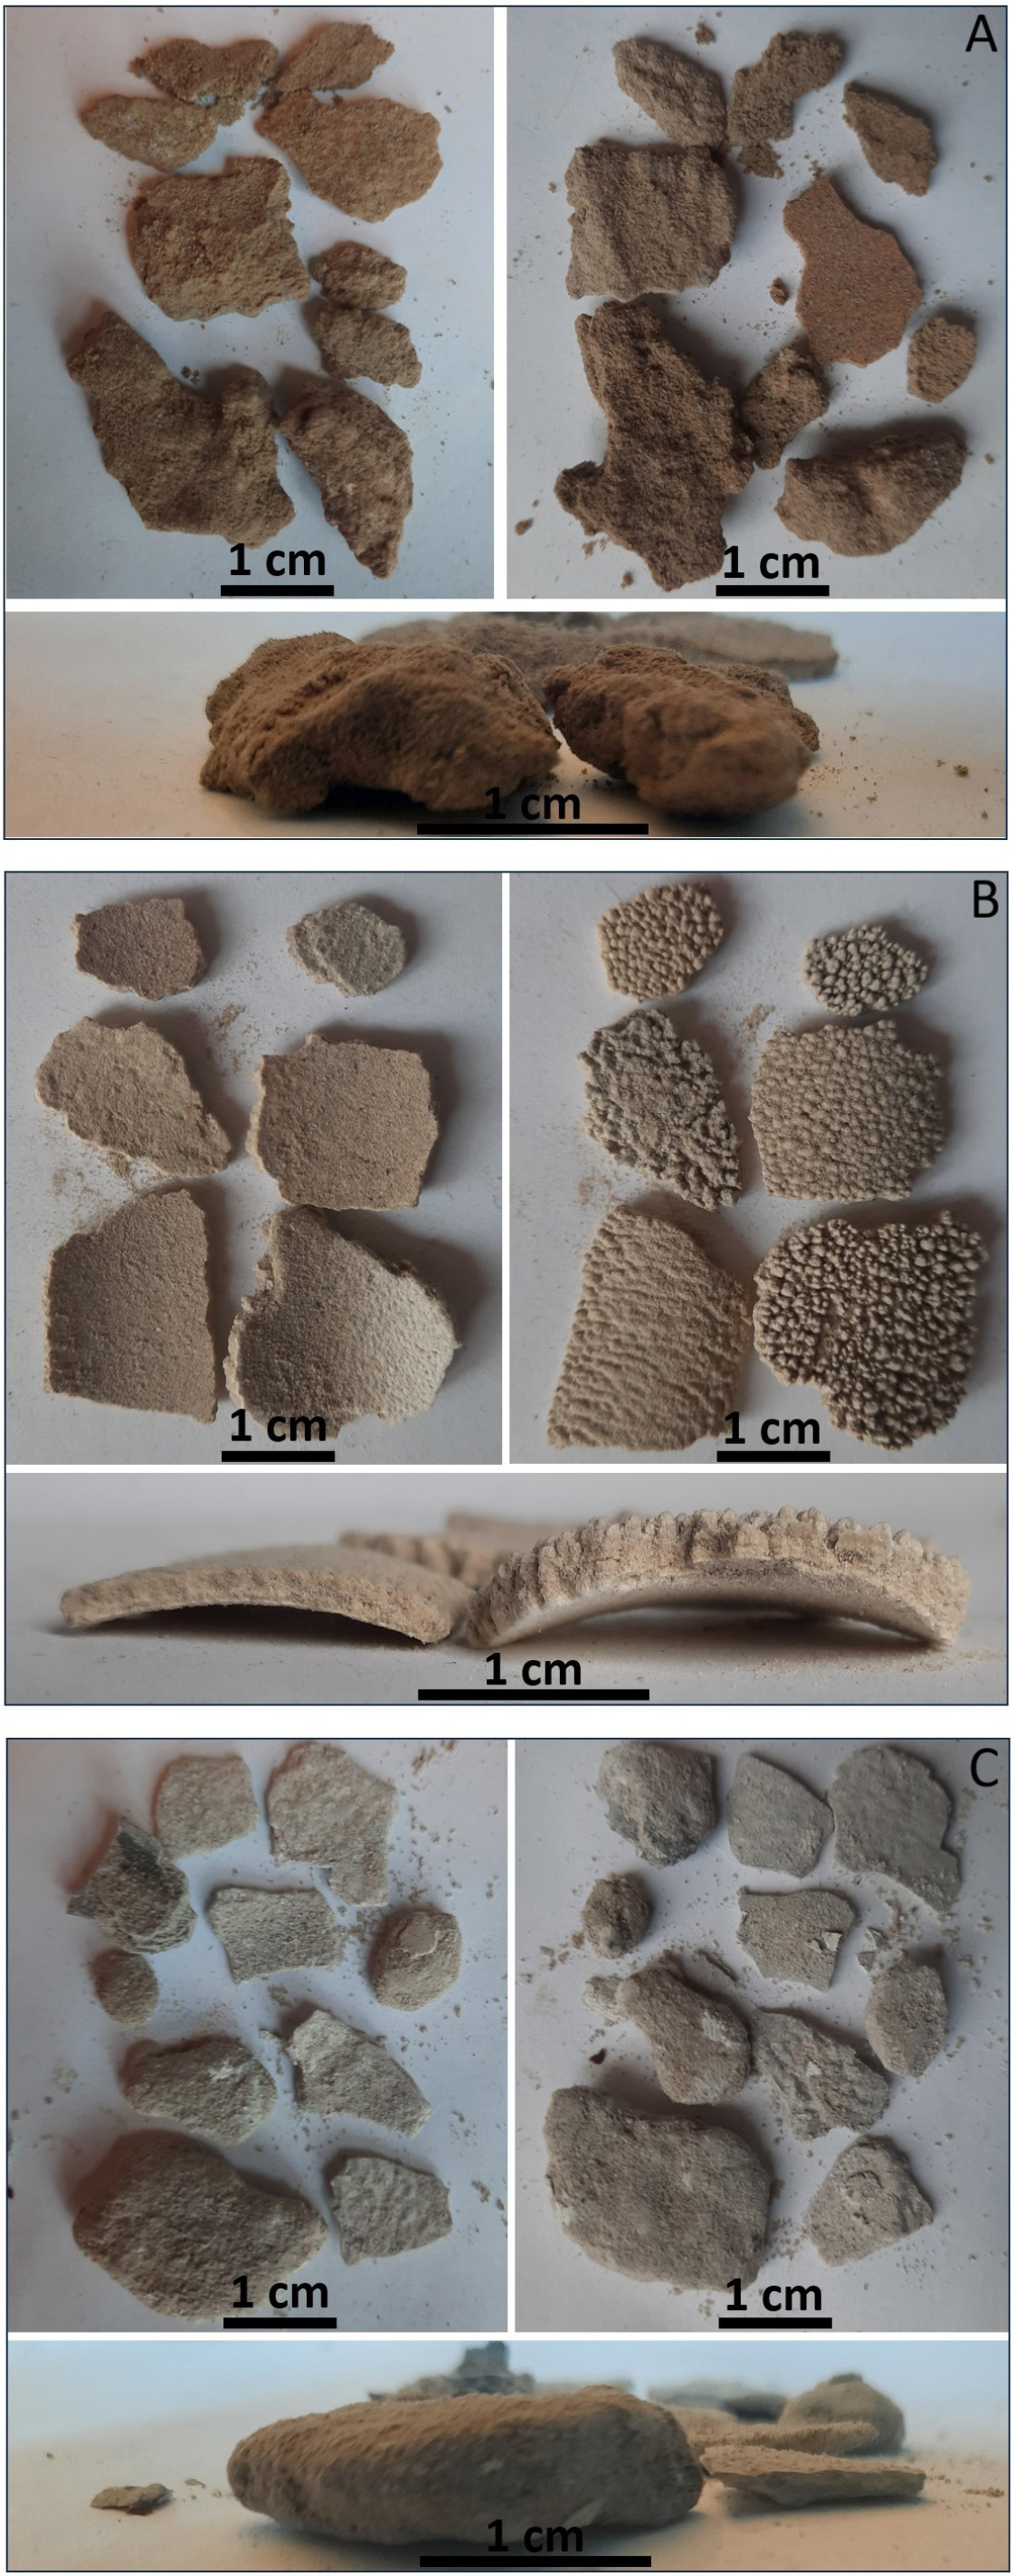
Fig. 3 Representative coarse fraction specimens shown from front, back and side views. A: Outlet 2. B: Outlet 3. C: Outlet 5 (outlets shown in Fig. 2).
1.5 Analysis
The 16 composite samples were analysed for their bulk geochemical composition at the Geological Survey of Denmark and Greenland (GEUS). Elements were selected based on their relevance to FA formation processes, environmental regulation and resource recovery potential. Major elements (including Si) were determined by inductively coupled plasma – optical emission spectrometry (ICP-OES; PerkinElmer Avio 500 instrument) following hydrofluoric acid (HF) leaching, except for Si, which was measured after borate fusion and leached with HNO3. Most of the trace elements were analysed by inductively coupled plasma – mass spectrometry (ICP-MS; PerkinElmer NexION 1000 instrument). Supplementary elements were analysed at Actlabs, who analysed Cl with Instrumental Neutron Activation Analysis, Na with acid assay ICP-OES and the remaining elements with ICP-OES after infusion with sodium peroxide. Table 3 details the elements analysed. Measured concentrations showed minimal deviation from certified reference materials, with overall accuracy close to 99% for all elements.
| Analyte | Unit | Range (n = 16) | Weighted average | PCC | ||
| (a) | (b) | (c) | ||||
| 1 Zn | wt.% | 0.57–5.20 | 2.87 | 1.00 | 1.00 | 1.00 |
| 1 K2O | wt.% | 1.24–13.79 | 5.67 | 0.99 | 0.79 | 0.98 |
| 2 Cl | wt.% | 1.00–17.2 | 9.17 | 0.99 | 0.33 | 0.78 |
| 1 Na2O | wt.% | 2.31–18.74 | 8.00 | 0.98 | 0.73 | 0.95 |
| 2 S | wt.% | 2.28–17.5 | 5.22 | 0.70 | –0.21 | –0.68 |
| 1 MgO | wt.% | 0.60–3.28 | 2.37 | –0.85 | –0.44 | –0.31 |
| 1 P2O5 | wt.% | 0.28–1.35 | 0.98 | –0.85 | –0.31 | –0.13 |
| 1 SiO2 | wt.% | 4.40–36.35 | 17.39 | –0.90 | –0.19 | 0.11 |
| 1 CaO | wt.% | 5.68–38.86 | 23.94 | –0.90 | –0.79 | –0.93 |
| 1 TiO2 | wt.% | 0.36–2.32 | 1.63 | –0.93 | –0.37 | –0.19 |
| 1 Al2O3 | wt.% | 1.09–9.21 | 5.62 | –0.97 | –0.36 | –0.17 |
| 1 Fe2O3 | wt.% | 0.77–4.84 | 2.76 | –0.97 | –0.42 | 0.15 |
| 1 MnO | wt.% | 0.031–0.11 | 0.08 | –0.97 | –0.42 | –0.26 |
| 2 Sn | ppm | 130–1590 | 867 | 1.00 | 0.96 | 0.99 |
| 1 Cs | ppm | 0.84–12.41 | 1233 | 1.00 | 0.89 | 0.98 |
| 2 Sb | ppm | 868–3090 | 1763 | 0.99 | 0.91 | 0.96 |
| 2 Bi | ppm | 48–296 | 92 | 0.99 | 0.65 | 0.80 |
| 1 Rb | ppm | 25–219 | 117 | 0.99 | 0.99 | 0.99 |
| 1 Cd | ppm | 9.1–370 | 177 | 0.99 | 0.99 | 1.00 |
| 2 In | ppm | < 0.2–4.2 | 1.8 | 0.98 | 0.91 | 0.97 |
| 1 Li | ppm | 20–71 | 37 | 0.98 | 0.84 | 0.99 |
| 1 Pb | ppm | 278–12 107 | 3980 | 0.97 | 0.67 | 0.92 |
| 1 Cu | ppm | 614–3242 | 1898 | 0.97 | 0.66 | 0.99 |
| 2 Tl | ppm | < 0.1–7.4 | 1.5 | 0.97 | 0.36 | 0.48 |
| 2 Ge | ppm | 1.5–4.5 | 2.8 | 0.95 | 0.80 | 0.94 |
| 1 Sc | ppm | 3.4–12.6 | 7.6 | 0.95 | 0.56 | 0.97 |
| 1 Ga | ppm | 4.8–14.0 | 11 | 0.95 | 0.97 | 0.98 |
| 2 As | ppm | 77–331 | 207 | 0.93 | 0.41 | 0.70 |
| 2 Se | ppm | < 8–53 | 9.4 | 0.75 | 0.46 | 0.53 |
| 1 Mo | ppm | 5.2–18.1 | 14 | –0.27 | –0.15 | 0.24 |
| 1 Ta | ppm | 0.21–3.23 | 1.2 | –0.33 | –0.11 | 0.19 |
| 2 B | ppm | 40–400 | 271 | –0.24 | –0.28 | 0.08 |
| 1 Cr | ppm | 89–506 | 371 | –0.70 | –0.42 | –0.26 |
| 2 W | ppm | 6.4–19 | 10 | –0.74 | –0.03 | 0.22 |
| 2 Nb | ppm | 2.6–19.6 | 9.0 | –0.77 | 0.28 | –0.16 |
| 1 REE | ppm | 15.6–135.9 | 86 | –0.81 | –0.17 | 0.12 |
| 1 Ni | ppm | 35–159 | 106 | –0.83 | –0.25 | –0.03 |
| 1 Co | ppm | 11.10–38.34 | 28 | –0.94 | –0.56 | –0.48 |
| 1 Y | ppm | 2.3–15.8 | 10 | –0.94 | –0.39 | –0.21 |
| 1 Sr | ppm | 127–646 | 463 | –0.95 | –0.65 | –0.74 |
| 1 Zr | ppm | 18–191 | 105 | –0.95 | –0.40 | –0.23 |
| 1 Hf | ppm | 0.44–3.81 | 2.5 | –0.95 | –0.40 | –0.22 |
| 1 U | ppm | 0.55–1.72 | 1.1 | –0.96 | –0.53 | –0.49 |
| 1 V | ppm | 12–63 | 43 | –0.97 | –0.34 | –0.13 |
| 1 Th | ppm | 0.50–4.58 | 2.8 | –0.97 | –0.38 | –0.20 |
| 1 Ba | ppm | 549–1790 | 1233 | –0.99 | –0.47 | –0.08 |
| 2 Be | ppm | < 3 | < 3 | NA | NA | NA |
| 2 Te | ppm | < 6–7 | < 6 | NA | NA | NA |
| (a) PCC for fine fractions. (b) PCC for coarse fractions. (c) PCC for coarse fractions excluding outlets 3 and 4. Strong correlations (PCC > 0.7) are shown in bold. Data grouped by major and trace elements and then ranked by PCC (a). 1ICP-MS at GEUS; 2Supplementary ICP-MS at Actlabs. REE: La, Ce, Pr, Nd, Sm, Eu, Gd, Tb, Dy, Ho, Er, Tm, Yb and Lu. | ||||||
1.6 Statistical analysis and data processing
The Pearson’s correlation coefficient (PCC), commonly denoted as r, quantifies the strength and direction of linear relationships between variables. PCC analyses of temporally resolved MSWI FA have shown that volatile elements exhibit strong mutual correlations, particularly with Zn, reflecting shared formation pathways, mineral associations and metallurgical availability (Clausen et al. 2019). Following this approach, PCCs were calculated between Zn and the remaining elements in the data set for both fine and coarse particle fractions (Table 3, a–c). Coarse particles from outlets 3 and 4 – identified as tube-derived crusts (Fig. 3B) and enriched in alkalis and sulphur (Fig. 4B) – deviated from the expected correlation structure, indicating a distinct bonding environment. PCCs were therefore recalculated excluding these samples (‘c’ in Table 3).
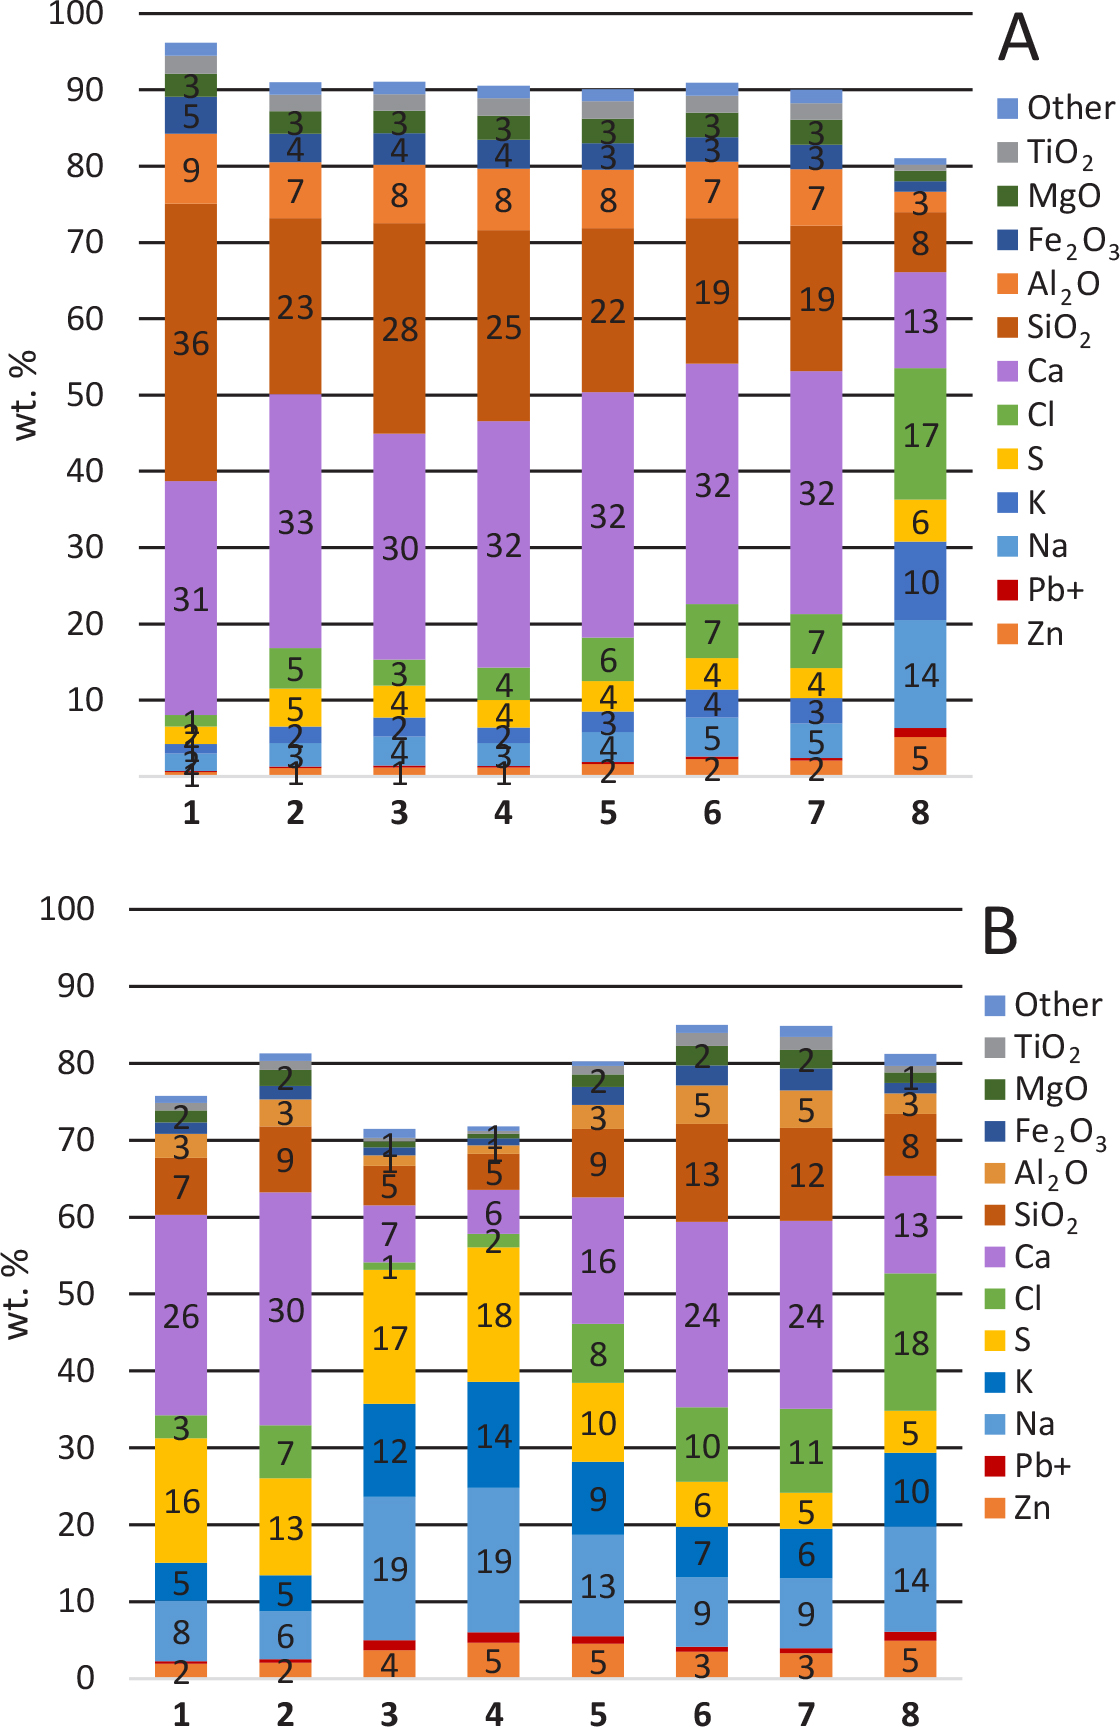
Fig. 4 Concentrations of selected major elements (Zn, Na, K, Ca, Cl and S) and heavy metals (Pb, Cu and Cd) in weight % from the eight different outlets. (A): Fine fractions. (B): Coarse fractions. Numbers 1–8 on the x-axis refer to the outlets, see Fig. 2.
2 Data description and main features
The full data set, which includes the results of the analysis of 16 samples, is provided in the Supplementary Files. The data set contains elemental concentrations in FA from eight outlets, analysed in two sieved particle-size fractions (0–2 mm and > 2 mm). The main features of the data set are presented in Table 3, including concentration ranges and average concentrations of the elements analysed. Figure 4 illustrates the variation of major element concentrations across the eight outlets for each size fraction. Here, we provide brief descriptions of the concentrations of selected elements, together with their variations and PCC in relation to recycling.
2.1 Zinc
Zinc is the primary driver of FA recycling in terms of intrinsic metal value, making its concentration particularly relevant. The coarse fractions (>2 mm) contain the highest Zn concentrations (2–5 wt.%). In the fine fractions, Zn ranges from 0.6 to 5 wt.% across outlets 1–8, averaging 2.87 wt.% and increasing gradually from outlet 1 to 8 (Table 3). Overall, Zn concentrations vary between 0.57 and 4.95 wt.% across the analysed FA sub-streams and particle-size fractions – an almost tenfold difference – indicating that the resource potential is not uniform across outlets or particle sizes.
2.2 Heavy metals and metalloids (Pb, Sn, Cd, Sb, Bi, In and Ga)
Heavy metals such as tin, lead and cadmium have some intrinsic value but are mostly viewed as a deterrence for the usability of inert FA versus classification as hazardous waste. Pb (278–12 107 ppm), Cu (614–3242 ppm), Cd (9.1–370 ppm), Sb (868–3090 ppm), Bi (48–296 ppm), In (< 0.2–4.2 ppm) and Ga (4.8–14.0 ppm) are elevated, especially in the coarse fractions and in the bag-filter ash (outlet 8). Fortunately, they are elevated in the same fractions as zinc, as observed in Fig. 4 and verified by Pearson’s correlation coefficient (PCC ≥ 0.95; ‘a’ in Table 3). This indicates shared volatilisation-condensation pathways at the incineration plant and coupled metallurgical availability during downstream recycling.
2.3 Major elements (Na, K and Cl)
Alkali and volatile elements vary widely across outlets and particle-size fractions (Na2O 2.31–18.74 wt.%, K2O 1.24–13.79 wt.%, Cl 1.00–17.2 wt.%) and, similar to previously discussed elements, show strong correlations with Zn (PCC c. 0.95–1.0, fine fraction; ‘a’ in Table 3), consistent with condensation behaviour and earlier studies (Clausen et al. 2019). Peak concentrations occur in outlets 3–4 and are linked to the observed mineral crusts (Fig. 3B). The association of Zn and other heavy elements with alkaline and volatile elements suggests weaker bonding environments and thus greater metallurgical availability. Outlet 1 fines (c. 7% of FA production; Table 2) contain the lowest Na, K and Cl concentrations (c. 7% total) but still exceed limits for construction applications such as supplementary cementitious materials (≤ 5% Na2Oeq ASTM C618 (ASTM International 2022); EN 450-1 (CEN 2012)).
2.4 Major elements (Si, Ca, Fe, Al, Ti and Mg)
Major oxides span broad concentration ranges in the analysed samples (e.g. SiO2 4.40–36.35 wt.%, CaO 5.68–38.86 wt.%). In the fine fractions, these elements decrease gradually across the data set (Fig. 4A), which is opposite to the trend observed for Zn (PCC −0.85 to −0.97; ‘a’ in Table 3). In the coarse fractions, they occur at lower concentrations (Fig. 4B) and show weaker negative correlations with Zn (PCC −0.19 to −0.79; ‘a’ in Table 3), with Ca maintaining the strongest correlation. This inverse relationship indicates that Zn-rich fractions are relatively depleted in major oxides, which is favourable for recycling as it concentrates the metals targeted for recovery.
2.5 Non-analysed light elements (C, H, O and N)
The major elements that were not directly analysed include carbon, hydrogen, nitrogen and oxygen. It is likely that these contribute substantially to the residual mass unaccounted for in the analysis: constituting c. 10% of the total fine fractions (outlets 1–7); constituting c. 15–30% in coarse fractions and the outlet 8 fine fraction. The combined fraction of unaccounted elements correlates with Zn and alkali metals (Na, K), suggesting association or reaction with these elements. From a metallurgical perspective, analysis of these elements would provide a more complete picture.
2.6 Sulphur
Sulphur concentrations range from 2.28 to 17.5 wt.%, with the highest levels found in coarse-fraction FA from outlets 3 and 4 (tube crusts; Fig. 3B). In the fine fractions, S correlates positively with Zn (PCC 0.70; ‘a’ in Table 3), consistent with Zn-bearing sulphates or salts. In contrast, that correlation between S and Zn is lost in the coarse fraction (PCC –0.21; ‘b’ in Table 3) and in fact S correlates negatively with Zn when excluding tube crusts (PCC –0.58; Table 3c). Sulphur is the only element whose correlation changes sign between particle-size fractions, suggesting greater sensitivity to environmental conditions (e.g. temperature and pressure) and interactions with other elements. This observation warrants further investigation.
3 Summary
The ARGO MSWI plant produces FA sub-streams and mineral fractions with greater recycling potential than bulk FA. Notably, the bag-filter ash (outlet 8) and coarse fractions – particularly from outlets 3 and 4 (tube flakes) – contain the highest concentrations of Zn, alkali and heavy metals. The lower major-element content (Si, Ca, Fe, Al, Ti and Mg) in these fractions suggests that zinc and heavy metals are less incorporated in refractory matrices and therefore exhibit greater metallurgical availability. Together these fractions account for c. 42% of FA production from Oven Line 6 (Fig. 2).
In providing this elemental data set, the authors would like to encourage future statistical and comparative analyses of the FA from the ARGO plant, including principal component analysis and hierarchical cluster analysis. The sampled material is archived at GEUS for further investigation, which may enable additional elemental analyses (particularly C, H, O and N), leaching tests, pH and conductivity measurements and mineralogical characterisation. Such analyses could improve the understanding of FA particle formation processes, mineral bonding and metallurgical availability as well as enable hazardous waste classification, a key determinant in selecting appropriate waste management options.
Acknowledgements
The authors thank Niels Kallehauge for extracting the samples and for offering them to GEUS, Mathilda Torres Esquivel, Henrik Fought and Karina Ditte Stausholm for their contribution to sample preparation; Olga Nielsen for sample analysis with ICP-MS and Nynke Keulen for providing valuable comments.
Additional information
Author contributions
RJC: Conceptualisation, investigation, methodology, formal analysis, visualisation, writing – original draft.
JKK: Funding acquisition, methodology, writing – review and editing.
Additional files
The four supplementary files can be found at https://doi.org/10.22008/FK2/5OBYRU: Supplementary File S1 The GEUS data set (Excel); Supplementary File S2 The Actlabs data set (Excel); Supplementary File S3 Estimates (Word); Supplementary file S4 Oven line configuration (Word).
Author’s data set disclaimer
GEUS shall not be held liable for any loss or damage, whether direct or indirect, because of the use of the elemental data set.