 |
RESEARCH ARTICLE  |
Assessment of subsurface pressure regimes onshore Denmark derived from formation-water salinity and artesian flow
Niels Hemmingsen Schovsbo1*  , Hanne Holmslykke2 , Anders Mathiesen3 , Niels Springer1 , Carsten Møller Nielsen1
Abstract
This study presents a first-order assessment of reservoir pressure regimes across onshore Denmark, focusing on hydrostatic conditions and occurrences of natural overpressure. Using a newly compiled database of brine salinity measurements from 28 wells, hydrostatic pressures were estimated based on salinity-derived density profiles. Validation against in situ pressure measurements confirms the reliability of this approach. Additional analysis of historical artesian deep wells documents local overpressured reservoirs within specific units such as the Zechstein Group, Bunter Sandstone and Ørslev Formations. These overpressured compartments suggest that reservoirs may be hydraulically isolated, potentially impacting storage capacity in CO2 sequestration projects. Overpressure is also observed in the overburden within the Chalk Group. We suggest that regional Neogene uplift has further shaped hydraulic heads in the Chalk Group, introducing semi-regional pressure compartments.
The main objective of this study was to establish a robust regional baseline for hydrostatic pressure conditions while highlighting historically underappreciated overpressure phenomena relevant to risk assessment in subsurface CO2 storage, geothermal utilisation and underground energy storage. We calculate the pressure required to lift brine to the surface, potentially allowing interaction with groundwater and thereby providing practical constraints for risk assessments and subsurface pressure management in prospective CO2 storage sites. In order to distinguish between open versus closed aquifer behaviour and identify potential brine discharge pathways, the sealing capacity of the Quaternary cover above the sparse natural outcrops of the Gassum and Skagerrak Formations, together with the conductivity of fault systems, must be assessed. These results establish a pressure baseline and provide critical input for future pressure communication models, supporting site selection, operational safety and coordinated subsurface resource management during Denmark’s green energy transition.
Citation: Schovsbo et al. 2026: GEUS Bulletin 62. 8415. https://doi.org/10.34194/73vyqt24
Copyright: GEUS Bulletin (eISSN: 2597-2154) is an open access, peer-reviewed journal published by the Geological Survey of Denmark and Greenland (GEUS). This article is distributed under a CC-BY 4.0 licence, permitting free redistribution, and reproduction for any purpose, even commercial, provided proper citation of the original work. Author(s) retain copyright.
Received: 9 Oct 2025; Re-submitted: 12 Feb 2026; Accepted: 26 Mar 2026; Published: 19 Jun 2026
Competing interests and funding: No competing interest.
This study is part of the GEUS subsurface pressure study funded by Denmark’s research reserve (Forskningsreserven 2025).
*Correspondence: nsc@geus.dk
Keywords: overpressure, brine salinity, hydrostatic pressure, CO2 storage, lift pressure
Abbreviations:
DAPCO: Danish American Prospecting Company
psi: per square inch
RFH: Ringkøbing–Fyn High
RFT: repeat formation tester
Sc: supercritical
SKP: Skagerrak–Kattegat Platform
STZ: Sorgenfrei–Tornquist Zone
TVD: total vertical depth
TDS: total dissolved solids
Edited by: Tala Maria Aabø (University of Copenhagen, Denmark)
Reviewed by: Alv-Arne Grimstad (SINTIFF Industry, Norway) and two anonymous reviewers
1 Introduction
Deep underground storage of CO2 in saline aquifers and depleted hydrocarbon reservoirs is recognised as a cornerstone strategy for mitigating anthropogenic greenhouse gas emissions (IPCC 2023). Denmark’s sedimentary basins provide several promising saline aquifers for large-scale storage, particularly the Triassic and Jurassic sandstones of the Bunter Sandstone, Skagerrak and Gassum Formations (Fig. 1). These reservoirs offer substantial storage capacity for supercritical (sc) CO2, as demonstrated by regional-scale geological and petrophysical studies (Halland et al. 2012; Weibel et al. 2014; Hjelm et al. 2022; Gregersen et al. 2025).
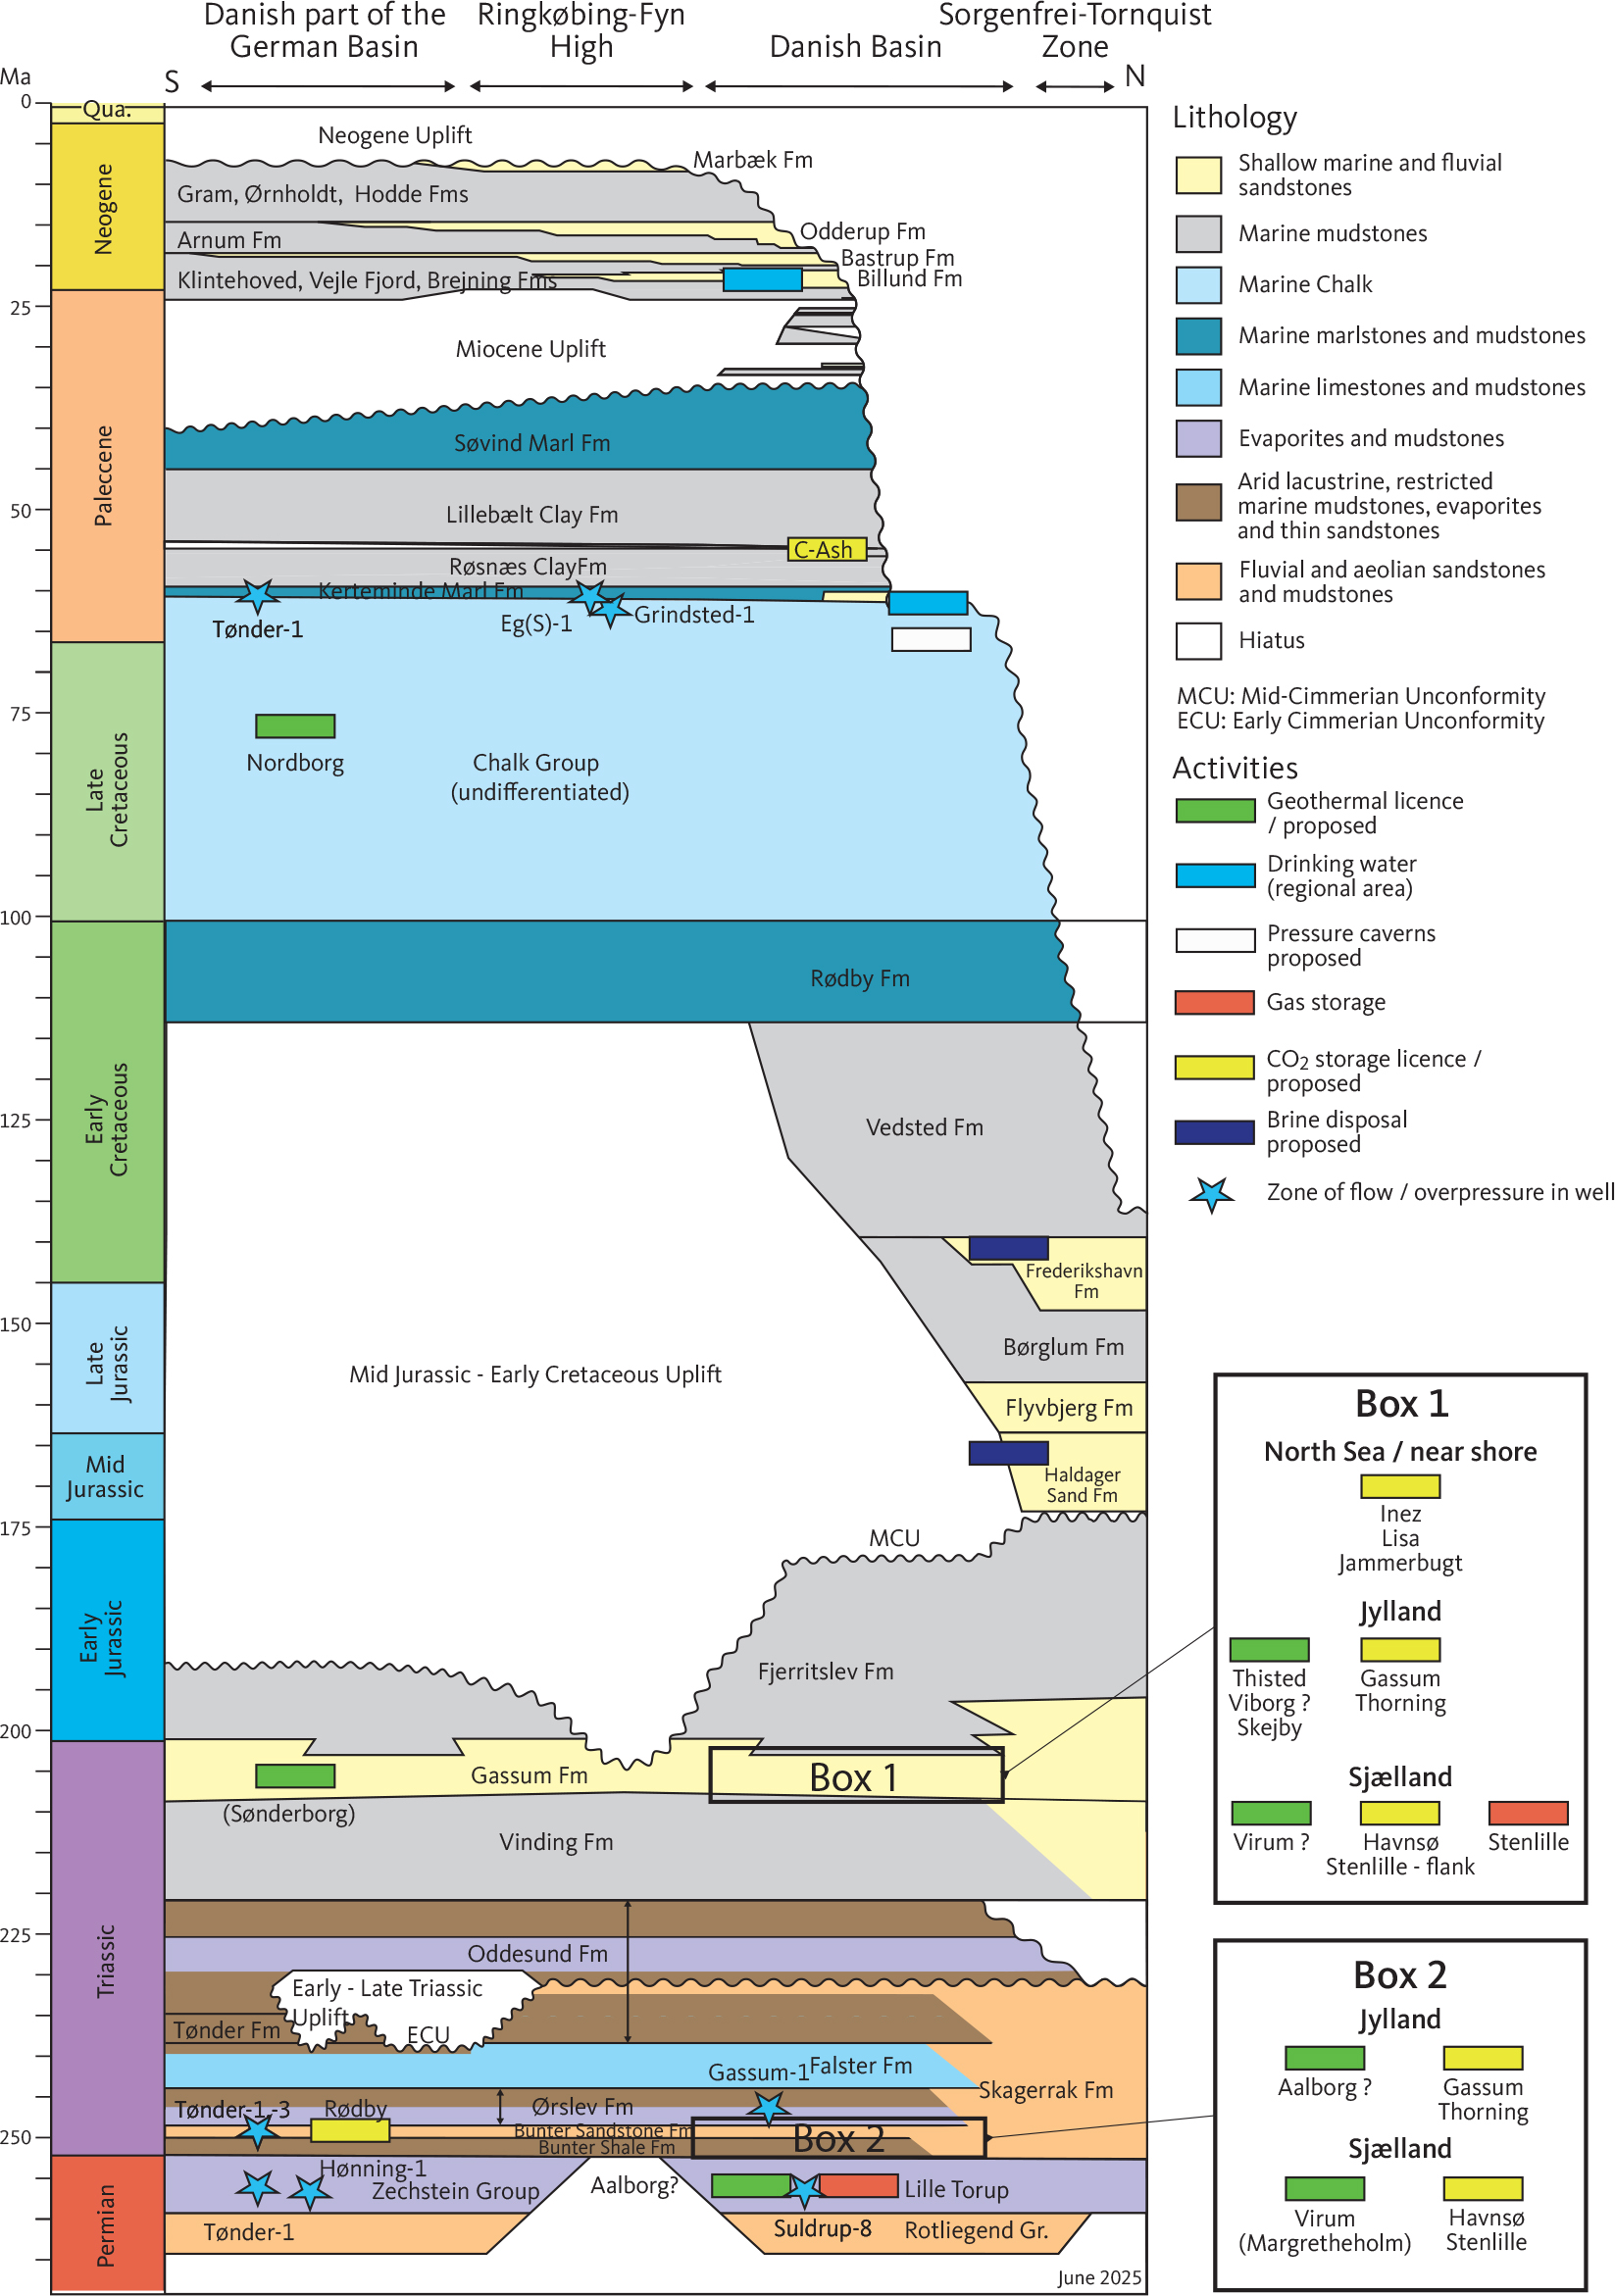
Fig. 1 Simplified pre-Quaternary stratigraphy with indications of subsurface uses/interest formations and deep flowing and overpressure wells discussed. For CO2 storage sites, both primary and secondary targets are indicated. ? indicates that the stratigraphic level to be developed has not been disclosed. () indicates non-operated geothermal assets, such as (Sønderborg). Stratigraphic chart is simplified from Heilmann-Clausen et al. (1985), Rasmussen et al. (2010) and Gregersen et al. (2025). Updated to June 2025.
In Denmark, onshore pre-Quaternary subsurface activities have until recently been limited to a few geothermal extraction facilities (Margretheholm, Sønderborg and Thisted) and natural gas storage sites, including the saline aquifer storage in Stenlille and the rock salt caverns in Lille Torup (Fig. 2). Additionally, the Chalk Group and Miocene groundwater reservoirs (Fig. 1; Rasmussen et al. 2007; Vangkilde-Pedersen et al. 2011) account for more than 30% of the extracted drinking water in Denmark (Henriksen et al. 2023).
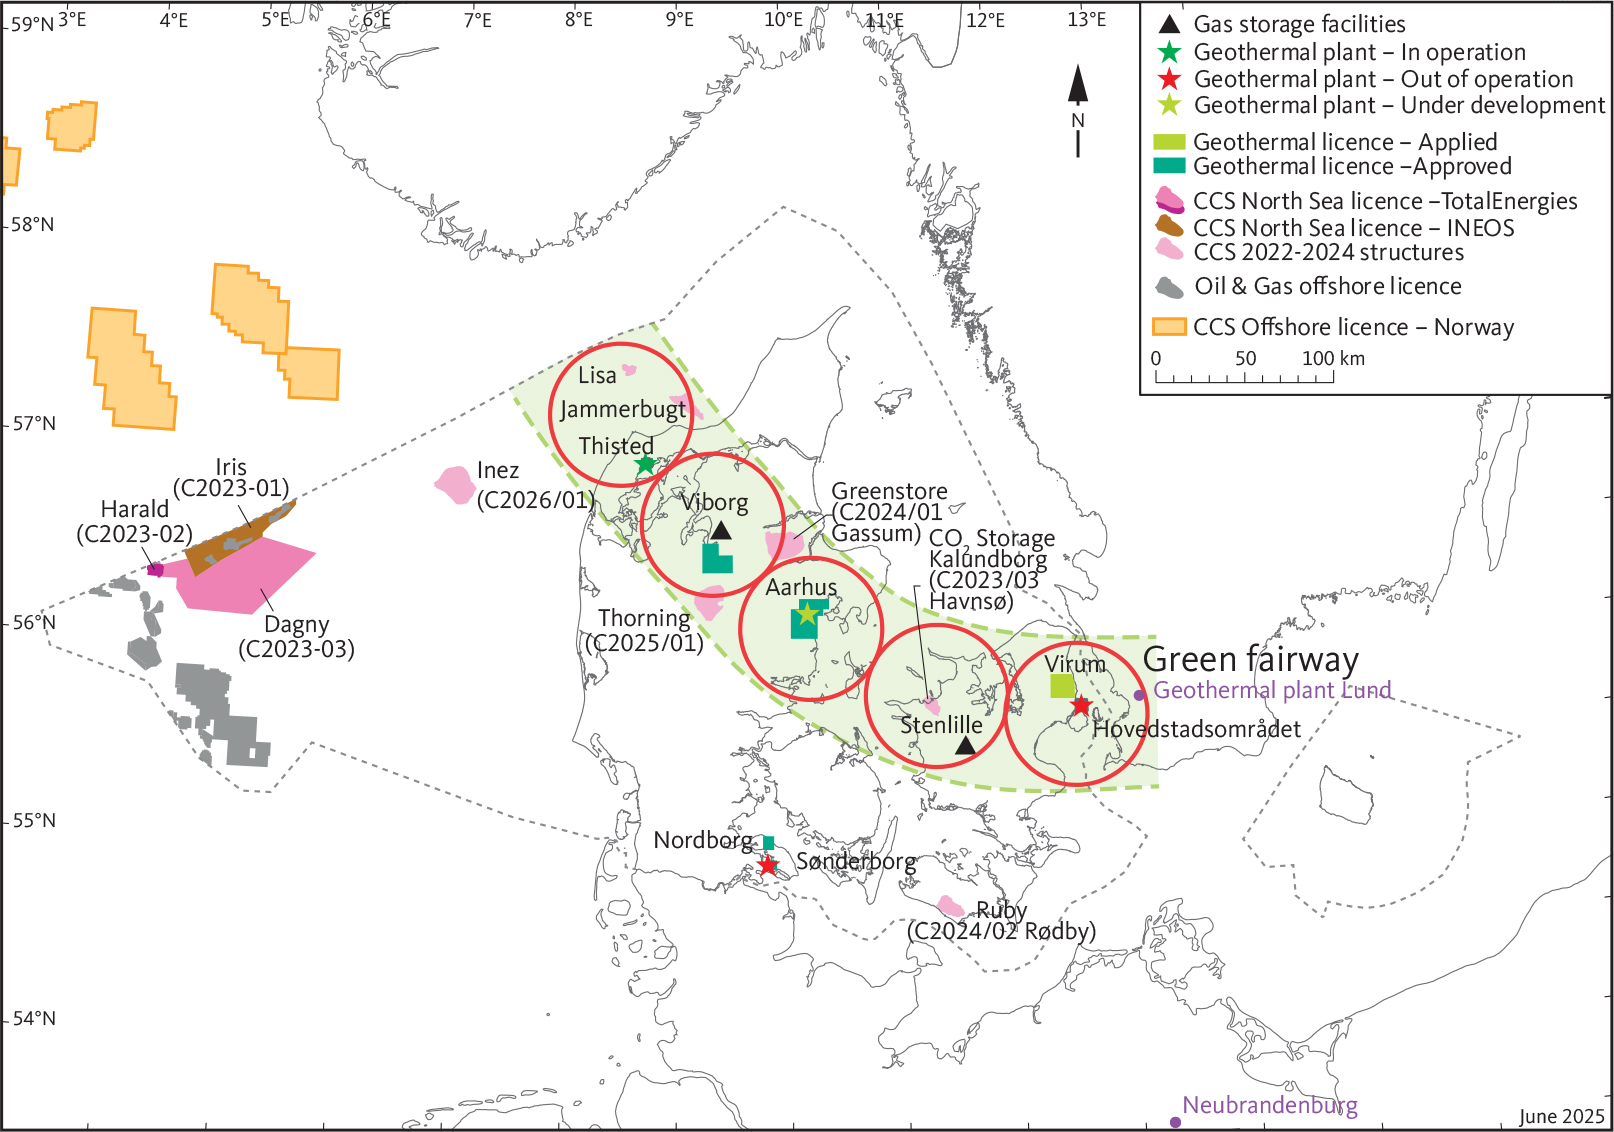
Fig. 2 Licensed areas for oil and gas production, CO2 storage sites (licensed and proposed), geothermal energy extraction sites (active, inactive and under development/exploration licence) and natural gas storage facilities in Denmark, Norway and Sweden. For stratigraphical targets, see Fig. 1. The five red circles (radius 40 km) highlight the ‘Green Fairway’ across Denmark with dense subsurface activities where a mixture of geothermal and CO2 storage sites, each within approximately 40 km distance of each other, co-occur and where subsurface pressure management is particularly relevant. Updated in June 2025.
Since 2023, the Danish Parliament has begun to award exploration licences for CO2 storage to commercial entities across four onshore areas (Gassum (Greenstore), Havnsø (CO2 storage Kalundborg), Rødby (Ruby) and Thorning), and four offshore (Harald/Bifrost, Dagny, Inez and Iris (including Greensand Future); Fig. 2). In the same period, geothermal exploration activities have increased with several new licences being granted (Nordborg, Thisted, Virum and Aarhus) introducing new heat extraction concepts and in some cases targeting other stratigraphical units than the traditional Gassum and Bunter Sandstone Formations hitherto utilised (Fig. 1). Other potential uses have included hydrogen storage, thermal energy storage schemes (Pasquinelli et al. 2020; Holmslykke et al. 2023), wastewater disposal (Hjuler et al. 2018), nuclear waste storage (Midtgaard et al. 2022), caverns for energy storage (Knudsen et al. 2010), additional CO2 possibilities (Jammerbugt, Lisa and Stenlille structures; Bredesen et al. 2023; Gregersen et al. 2025) and shallow CO2 mineralisation projects (C-Ash project; Pedersen et al. 2025) – all of which have emerged or re-surfaced in order to meet the anthropogenically induced climatic crisis.
When viewed by stratigraphic zones (Fig. 1) or by location (Fig. 2), most of the subsurface activities predominantly target the Gassum and Bunter Sandstone/Skagerrak aquifer systems, and most of these activities lie within a narrow belt stretching across north Jylland to north Sjælland, an area here named the ‘Green Fairway’ (Fig. 2). This Green Fairway is characterised by a mixture of geothermal and CO2 storage sites each within approximately 40 km distance of each other. They have either been developed, are under development or are expected to be developed within the next few years, and a major data-collecting campaign, including seismic acquisition and drilling, is to be expected that will dwarf the last 25 years of exploration activities within onshore Denmark as documented in Schovsbo & Jakobsen (2019).
As CO2 storage operations generally create extensive subsurface pressure footprints (Birkholzer et al. 2009; Birkholzer & Zhou 2009; Bump & Hovorka 2024; Mukhtar et al. 2024), enhanced understanding of aquifer dynamics, baseline hydrostatic pressure and interactivity between the various geo-energy and groundwater applications becomes essential. This is especially the case in such a densely operated zone as the Green Fairway where sites of CO2 storage and geothermal extraction will potentially be located within c. 40 km of each other (Fig. 2). To achieve sustainable coexistence of these diverse activities, clear determination of aquifer system behaviour is crucial, as this will directly impact the subsurface pressure distribution and economic viability – irrespective of whether the system is hydraulically open (extensive aquifers, connected via permeable faults or natural discharge pathways) or closed (compartmentalised and isolated) (Chadwick et al. 2008; Ringrose 2020; Mukhtar et al. 2024).
This study establishes a foundational baseline for hydrostatic pressure, explores relationships between formation-water salinity and pressure, and documents hydrostatic pressured sites as well as previously overlooked indicators of natural overpressure. Using salinity-derived brine density models validated against in situ pressure data, we quantify the occurrences of natural overpressure, evaluate their origins and introduce the concept of lift pressure (Plift) of Bachu (2015) as a tool for distinguishing potential brine discharge. These results provide critical input for more sophisticated pressure communication models, enhancing site selection, operational safety and effective, coordinated subsurface resource management for enabling coexistence among various subsurface uses in Denmark’s green energy transition.
By integrating historical data from flowing wells and detailed pore-water compositional analyses, this paper offers essential insights into the subsurface pressure regimes in onshore Denmark. Ultimately, our findings establish a foundation for future, more comprehensive risk-assessment frameworks aimed at supporting informed governance and optimised utilisation of Denmark’s subsurface resources.
2 Theoretical background: hydrostatic and overpressure systems
Hydrostatic pressure (Pw) represents the gravitational load exerted by the overlying water column and is governed by fluid density, height of the water column and gravitational acceleration (Nihous 2016; Dutta et al. 2021). When CO2 is injected into a brine-filled aquifer, it becomes buoyant, exerting upward pressure against the caprock (Fig. 3). For safe and long-term storage integrity, this pressure must remain below critical containment thresholds. Injection operations generate both regional pressure build-up and elevated near-well pressure controlled by injection rate, reservoir injectivity and operational strategy. Over extended injection periods – potentially lasting several decades – pressure development may represent the primary operational constraint and a key cost driver for CO2 storage projects.
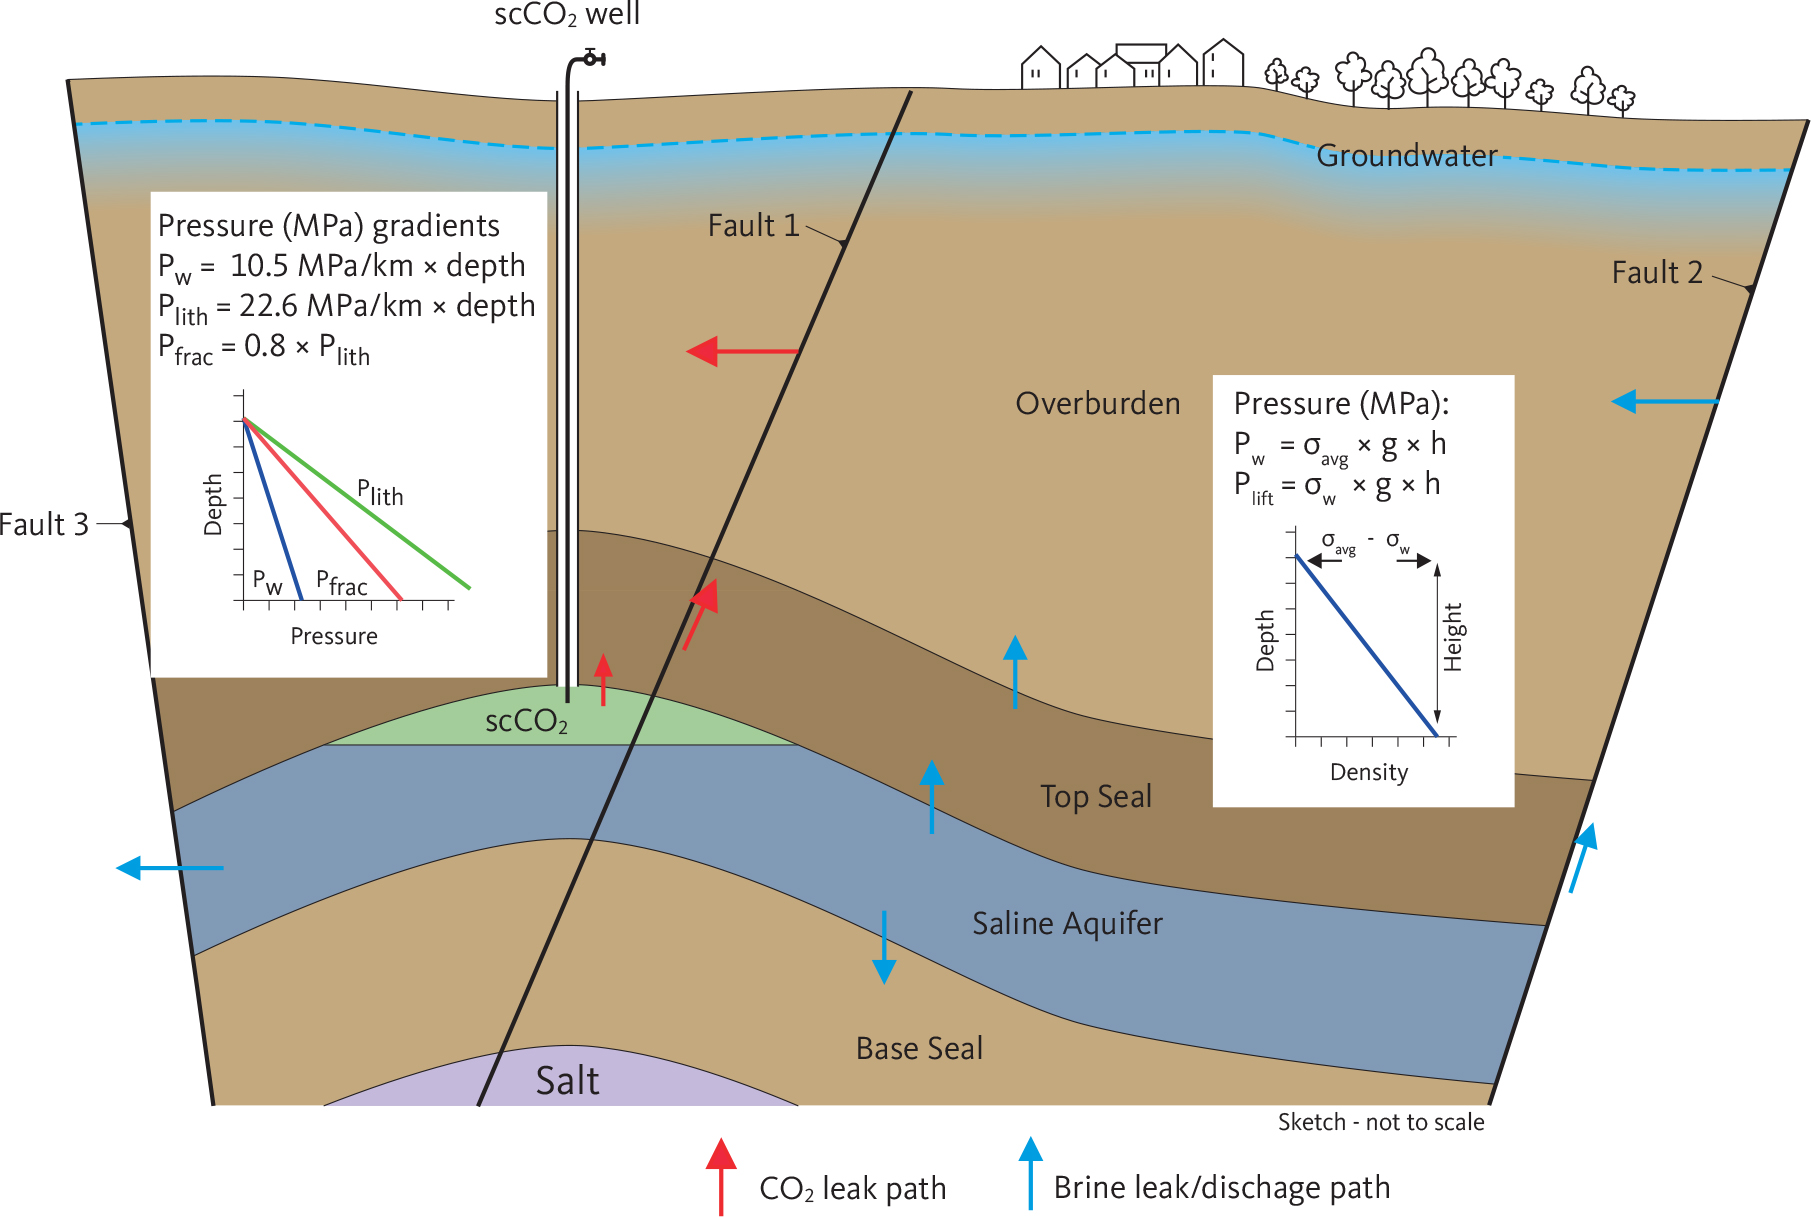
Fig. 3 Conceptual sketch of supercritical carbon dioxide (scCO2) stored in a fault-bounded salt structure. The upper pressure limit is set by fracture (Pfrac) or caprock displacement pressure, allowing leakage through faults or the seal (red arrow). Hydrostatic pressure (Pw) reflects water column load (density × height × g). In open systems, pressure can dissipate by brine discharge (blue arrows), either laterally or along faults, requiring lift pressure (Plift) governed by brine density and height. Gradients from Schovsbo et al. (2025) and Williams et al. (2022).
The upper pressure limit is commonly defined by the fracture pressure (Pfrac), which represents the pressure required to initiate fracture propagation or reactivate critically stressed faults. Fracture pressure is typically constrained through leak-off or extended leak-off tests and supported by geomechanical modelling to estimate the in situ stress state and mechanical stability of the reservoir–seal system (Williams et al. 2022). Capillary displacement pressure provides an additional containment threshold, representing the pressure required for buoyant CO2 to massively displace formation brine and enter the caprock pore network. Together, fracture pressure and capillary displacement pressure define the principal limits for storage integrity. The aquifer’s pressure response to the CO2 injection is fundamentally controlled by whether the system behaves as a hydraulically open or closed system (Fig. 3). In open aquifers, hydraulic connectivity exists on the surface or surrounding formations through leakage below spill-points, conductive faults, fracture systems or outcrops where displaced brine can escape, allowing pressure dissipation. In addition to direct discharge, slow brine leakage may occur via diffusive or advective transport across low-permeability seals and faults depending on the hydraulic conductivity of these features (Birkholzer et al. 2009; Cihan et al. 2013).
In contrast, closed or semi-closed systems lack significant discharge pathways. Once the pressure front reaches structural or stratigraphic boundaries, pressure increases approximately in proportion to the injected volume. Under these conditions, storage capacity becomes largely controlled by reservoir compressibility and the ability of the formation water and rock framework to accommodate the injected fluid (Zhou et al. 2008).
The minimum pressure required to drive brine from the aquifer to the surface – termed the ‘lift pressure (Plift)’ (see Bachu 2015) – is primarily a function of the density of the brine to be lifted and the elevation difference between the reservoir and discharge point (Bachu 2015). The lift pressure is in theory independent of the path which the brine takes when lifted, although cooling effects and convections will have an impact (Oldenburg & Rinaldi 2011). In a storage site, the lift pressure may define a pressure boundary below which no brine can be moved either to natural groundwater discharge areas, through conductive faults, poorly abandoned wells or from anthropogenic fluid extraction (Mukhtar et al. 2024). This parameter provides a practical threshold for evaluating the potential for natural brine migration and pressure communication within the subsurface.
Consequently, the maximum achievable CO2 storage capacity within a given geological structure is determined not only by the pressure exerted by the buoyant scCO2 column, but also – and often critically – by the aquifer’s ability to dissipate pressure, either through brine discharge in open systems or by compressibility-driven accommodation in closed systems (Thibeau & Mucha 2011). In the first case, the density of the displaced brine adds an additional pressure component that, together with the scCO2 column height, governs the effective storage capacity of the site.
3 Geological setting
The Danish subsurface is part of the Norwegian–Danish and North German Basin system, an intracratonic complex shaped by multiple tectonic phases since the late Palaeozoic (Michelsen et al. 2003; Gregersen et al. 2025). The Danish Basin is trending WNW–ESE between the Ringkøbing–Fyn High (RFH) to the south and the Sorgenfrei–Tornquist Zone (STZ) and Skagerrak–Kattegat Platform (SKP) to the north (Fig. 4). South of the RFH, the North German Basin extends into Germany and Poland (Fig. 4).
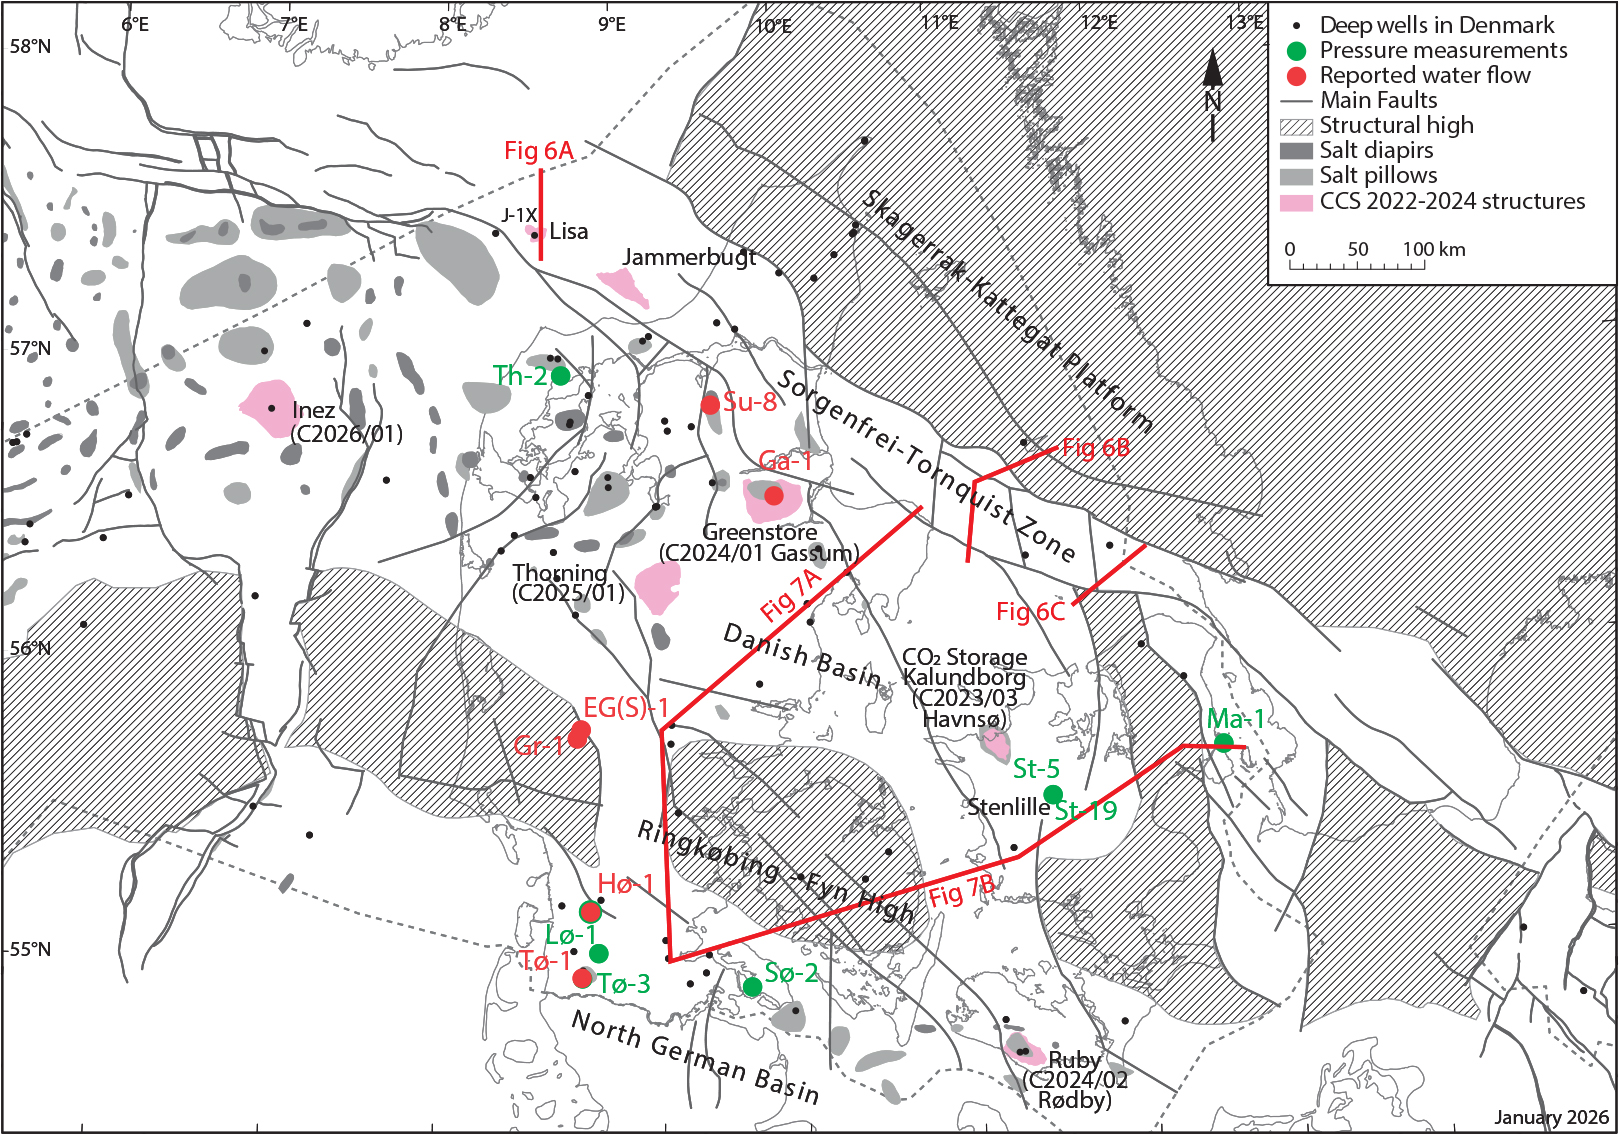
Fig. 4 Structural outline showing major tectonic elements, locations of key wells and CO2 storage-relevant structures. Fault patterns and salt diapir locations highlighted as they influence reservoir compartmentalisation and pressure transmission. Abbreviations: Ga-1: Gassum-1. Gr-1: Grindsted-1. Hø-1: Hønning-1. Lø-1: Løgumkloster-1. Ma-1: Margretheholm-1. St-5–19: Stenlille-5–19. Su-8: Suldrup-8. Sø-2: Sønderborg-2. Th-2: Thisted-2. Tø-1–3: Tønder-1–3. Location of the cross section and profile shown in Fig. 6 and 7 are marked as red annotated lines.
3.1 Basin evolution and structural framework
Development of the basins began in the late Carboniferous – early Permian with crustal extension and magmatism (Ziegler 1990). During the late Permian, post-rift thermal subsidence led to deposition of evaporites and carbonates in northern and southern sub-basins, partly separated by the RFH (Peryt et al. 2010). Thick successions of Triassic to Cretaceous sediments (locally > 9 km) accumulated in the Danish Basin (Vejbæk 1997). Triassic deposition was dominated by continental sandstones, mudstones and evaporites, whereas marine conditions prevailed through much of the Jurassic (Fig. 1). Regional uplift and erosion occurred during the Early and Mid-Cimmerian phases, particularly near the RFH and in the North German Basin (Fig. 1; Nielsen 2003). Late Jurassic – Early Cretaceous tectonic quiescence was followed by inversion related to Alpine compression in the Late Cretaceous – Palaeocene, affecting both the Danish Basin and the STZ (Ziegler 1990; Vejbæk 1997; Mogensen & Korstgård 2003). In the Cenozoic, post-rift thermal subsidence combined with North Atlantic opening resulted in widespread deposition of marine clays and marls (Heilmann-Clausen et al. 1985; Schiøler et al. 2007). Accelerated subsidence of the North Sea Basin occurred in the middle Miocene, followed by uplift and erosion from the late Miocene onwards (Rasmussen et al. 2010). Neogene–Quaternary tectonism induced a pronounced SW–NE tilt, leaving Quaternary deposits directly overlying Upper Cretaceous Chalk in eastern Denmark and upper Miocene sediments in SW Jylland (Figs 1, 5D; Japsen & Bidstrup 1999; Japsen et al. 2018).
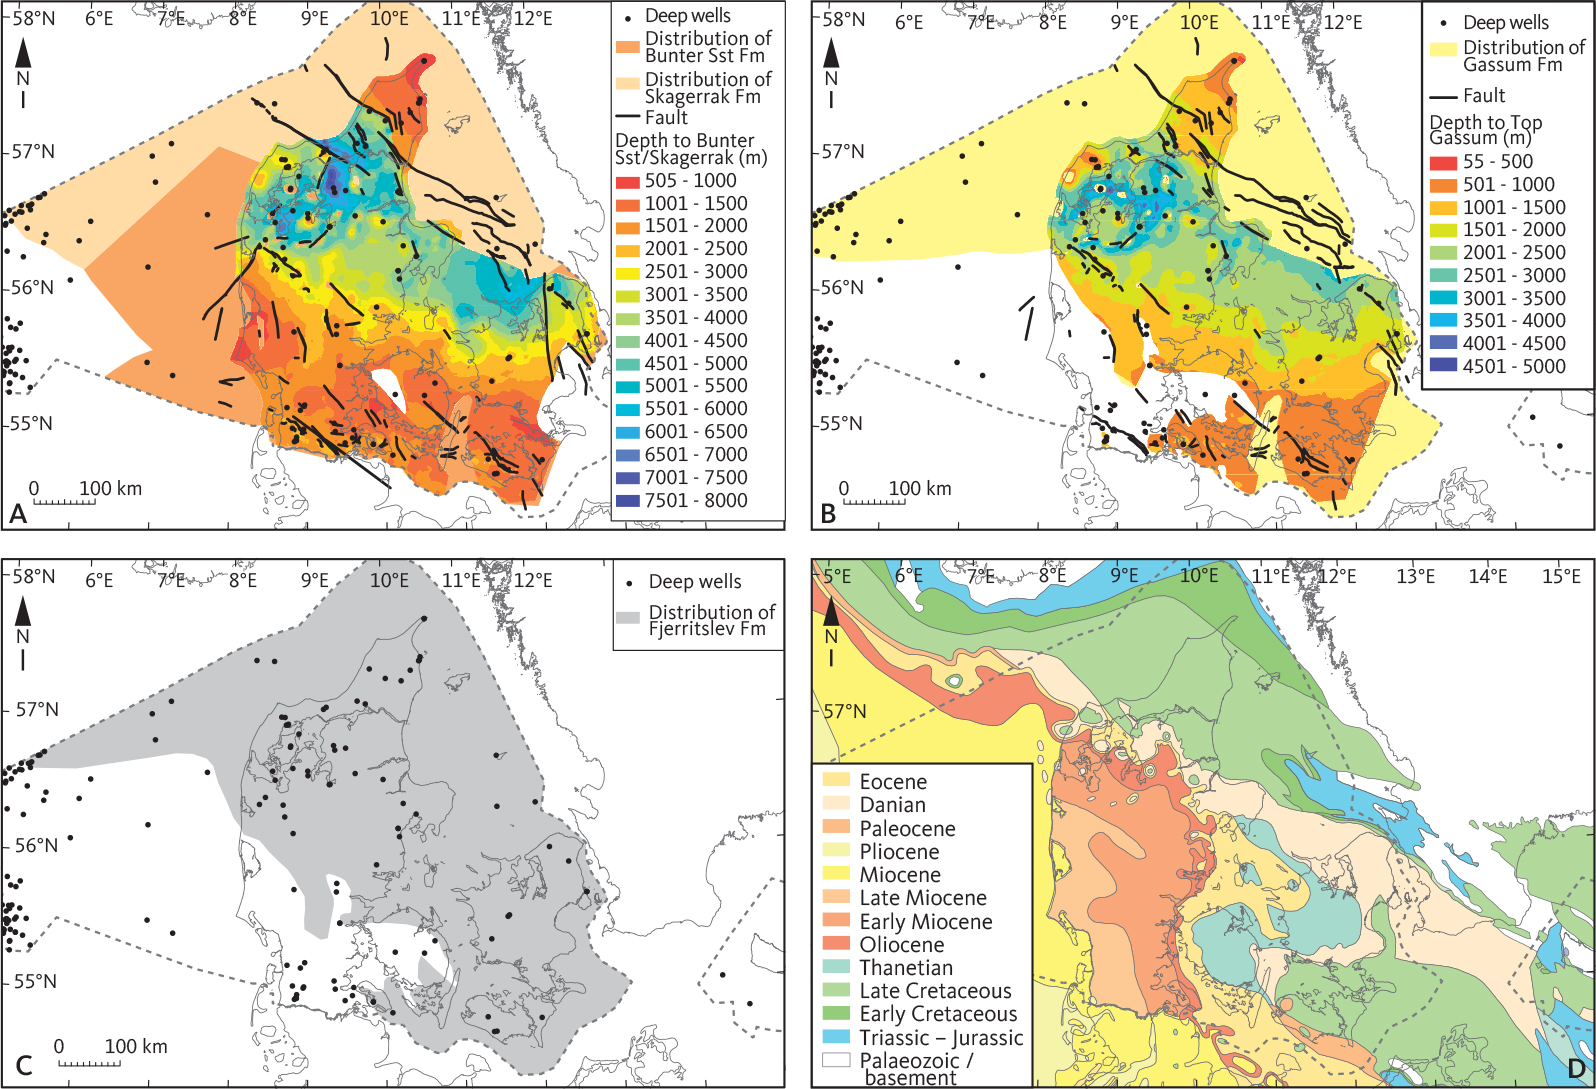
Fig. 5 Depth structure and distribution maps for: (A): Top Bunter Sandstone/Skagerrak Formations, (B): Top Gassum Formation, (C): Fjerritslev Formation (primary seal) and (D): Pre-Quaternary subcrop map illustrating southwest regional tilt and zones of potential hydraulic recharge. Based on Vosgerau et al. (2016) and Sigmond (2002).
The present-day framework is defined by structural highs (e.g. RFH), basin-margin fault zones (e.g. STZ) and local salt diapirs (Fig. 4). These elements strongly influence the distribution of reservoirs and seals. Inverted zones, such as the STZ, display fault-bounded Jurassic–Triassic strata that are locally thin or absent beneath Quaternary cover, while thick depocentres persist elsewhere (Fig. 5D). The Norwegian Trench in the north (c. 800 m deep) contains thick Quaternary cover above Jurassic–Triassic units (Fig. 6A; Baig et al. 2013; Olivarius et al. 2019). No subcrop exposures of Triassic units occur in Denmark; the only Danish Triassic exposures are on Bornholm and do not correlate with these reservoir intervals. However, stratigraphically equivalent strata correlated with the Gassum and Skagerrak Formations are exposed in Skåne, Sweden (Erlström et al. 2018).

Fig. 6 Regional SW–NE cross-section illustrating the structural configuration from the Danish Basin to the Sorgenfrei–Tornquist Zone. For profile lines, see Fig. 4. Modified from Mogensen & Korstgård (2003) and Petersen et al. (2008).
3.2 Reservoir and seal formations
The main targets for CO2 storage and geothermal energy are Triassic–Jurassic sandstones, notably the Bunter Sandstone, Skagerrak and Gassum Formations (Figs 1, 5A, B; Vosgerau et al. 2016; Weibel et al. 2017a, 2017b; Gregersen et al. 2025). The Bunter Sandstone and Skagerrak Formations were deposited in arid continental environments (Bertelsen 1980; Weibel et al. 2017a) and show strong lateral variation in thickness (locally several hundred metres) as well as reservoir quality due to depositional and diagenetic history (Olivarius et al. 2017, 2019; Weibel et al. 2017a, 2017b). They are regionally sealed by evaporites of the Ørslev and Oddesund Formations (Bertelsen 1980; Gregersen et al. 2025).
The Gassum Formation (Late Triassic – Early Jurassic) consists of fluvial to shallow marine sandstones interbedded with mudstones (Nielsen 2003; Kristensen et al. 2016; Weibel et al. 2017a, 2017b). It generally displays more uniform reservoir properties than the older Triassic units, with thicknesses of 50–300 m and porosities of 15–30% (Kristensen et al. 2016; Weibel et al. 2017b). It is regionally sealed by the clay-rich Fjerritslev Formation, which is 200–600m thick and locally >1 km in salt-related depocentres (Fig. 5C; Nielsen 2003; Mbia et al. 2014; Gregersen et al. 2025). The seal capacity of the Fjerritslev Formation has recently been summarised by Springer et al. (2020). Previous experimental work in the Stenlille area documents high seal capacity with liquid permeabilities c. 3 nanoDarcy and scCO2 entry pressure of c. 5 MPa (Springer et al. 2010).
Additional porous sandstones occur in the Late Jurassic – Early Cretaceous (Haldager Sand, Frederikshavn Formations), locally investigated for wastewater disposal or as secondary CO2 storage options (Hjuler et al. 2018; Gregersen et al. 2025).
The Chalk Group (Late Cretaceous – Danian) has porosities >35% (Frykman 2001; Bonnesen et al. 2009), is a target for geothermal exploration (Figs 1–2; Nordborg licence) and has earlier been proposed for energy storage (Knudsen et al. 2010). Exposures occur in northern Jylland and Sjælland (e.g. Stevns Klint, Møns Klint), while elsewhere it is buried beneath Quaternary sediments or older deposits (Fig. 5D). In northern Jylland, parts of Fyn and NW Sjælland, the Chalk Group is also an important groundwater reservoir (Henriksen et al. 2023).
The seal to the Chalk Group is the Paleogene – lower Neogene succession that mainly consists of marine clays, transitioning from smectite-rich Paleocene deposits to illite- and kaolinite-rich compositions higher up (Heilmann-Clausen et al. 1985; Rasmussen et al. 2010; Nielsen et al. 2015). These so-called ‘plastic clays’ are characterised by high compressibility and swelling capacity, dominating the geomechanical behaviour (Rocchi et al. 2018; Di Remigio et al. 2019).
Besides the Ørslev, Oddesund and Fjerritslev Formations, fine-grained Lower Cretaceous deposits provide additional secondary seals (Gregersen et al. 2025). Local halokinesis has created shallow salt pillows and diapirs, in some cases compromising seal integrity of the overlying strata (Putnaite et al. 2025).
3.3 Burial, uplift and erosion
Mesozoic and early Cenozoic sedimentation resulted in burial of up to several kilometres depth (Japsen & Bidstrup 1999; Petersen et al. 2008). The region experienced multiple uplift phases during the Triassic, Jurassic – Early Cretaceous, Miocene and Neogene, causing up to 1 km net exhumation (Japsen & Bidstrup 1999; Japsen et al. 2007). This uplift and erosion, combined with regional tilting, strongly modified the distribution of strata, as reflected in the pre-Quaternary subcrop map (Fig. 5D) and regional correlation profiles (Fig. 7). Paleogene strata are absent in northern Denmark, while elsewhere Quaternary deposits rest directly on older successions.

Fig. 7 Correlation profile showing regional tilt and structuring of the top Chalk Group and younger sediments. From Jakobsen et al. (2022) and Henriksen et al. (2023). For profile lines, see Fig. 4.
4 Data and methods
4.1 Data sources
Pressure data were compiled from publicly available well reports and other material archived at the Geological Survey of Denmark and Greenland (GEUS). The dataset is sparse and primarily includes a few oil and gas exploration wells in southern Jylland, geothermal wells and the Stenlille gas storage facility. For Stenlille, pressure data from Stenlille-5 (Dansk Naturgas 1989) collected prior to gas injection are used for the Gassum and Fjerritslev Formations. For the Bunter Sandstone Formation, we use Stenlille-19 data as no injection has occurred in this interval (Dong E&P 2001). All pressure data are applied as reported; no re-interpretations have been made. Values were converted from pounds per square inch (psi) to MPa, and depths are given in metres below ground level rather than depth from the water table as this value was not readily available.
Salinity was assessed using a brine database comprising analyses from 28 Danish wells (Schovsbo et al. 2025), based on Dinesen (1961), Laier (1989, 2008), Holmslykke et al. (2019) and others. Most samples include complete ionic compositions, enabling calculation of total dissolved solids (TDS). For incomplete datasets, TDS was estimated from chloride content following Schovsbo et al. (2025). Data are available via the GEUS Bulletin Dataverse: https://doi.org/10.22008/FK2/FCO82C.
4.2 Brine density
Brine density (δw) at reservoir conditions was estimated with PHREEQC v3 and the Pitzer database (Parkhurst & Appelo 2013). The method is described in Schovsbo et al. (2025) and is here extended to the full dataset. A linear relationship between TDS and density was established (Fig. 8):
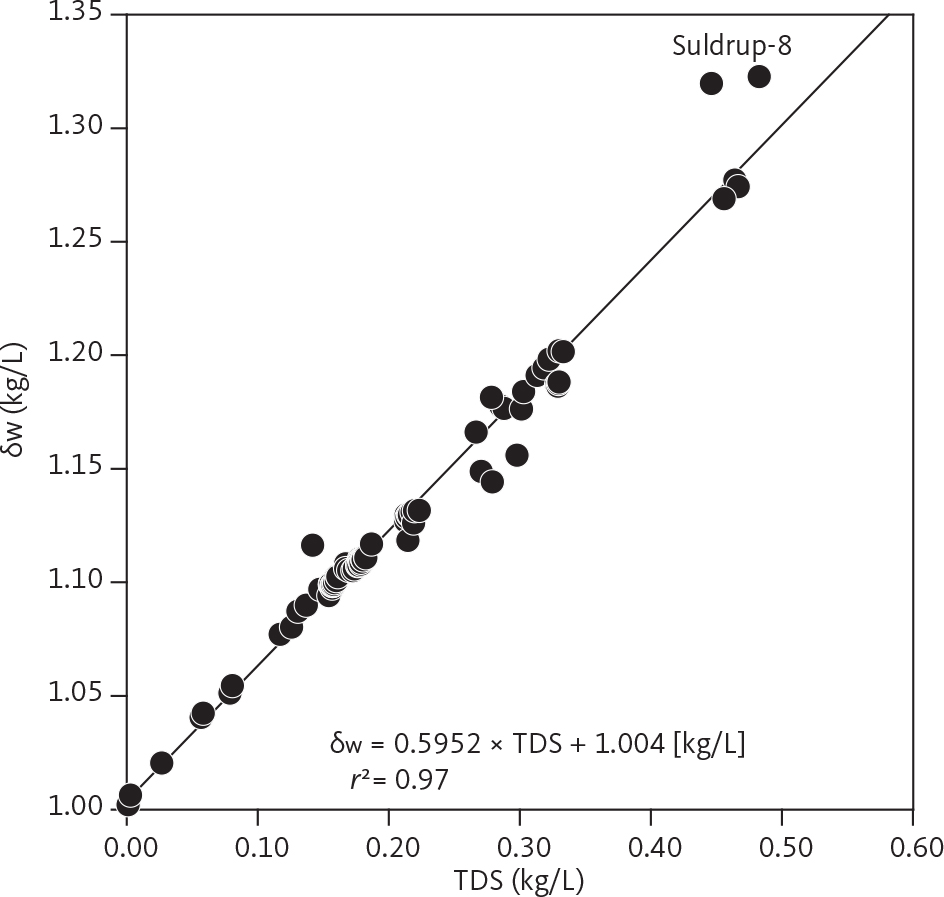
Fig. 8 Water density (δw) estimates at reservoir conditions using PHREEQC v3 versus total dissolved solids (TDS) in deep Danish aquifers.

where δw is the water density at reservoir conditions, and TDS is the total dissolved solid content in kg/L. The relationship is statistically significant (r = 0.985; P < 0.001 at n = 84; Fisher & Yates 1963). Deviations are only observed in highly saline Zechstein brines from Suldrup-8.
4.3 Hydrostatic pressure
Hydrostatic pressure (PwTDS) was calculated as:

where δwavg is average brine density (kg/L), g = 9.80665 m/s², and h the height of the water column in metres, which equals the depth below ground level. For brines deeper than 400 m, TDS increases almost linearly with depth (Fig. 9A). In such cases, the average TDS can be approximated as half of the TDS measured at the base of the interval, assuming that near-surface groundwater is fresh (0 kg/L TDS) following normal geometrical considerations for a right triangle (half the product of its two legs). Substituting this gives:
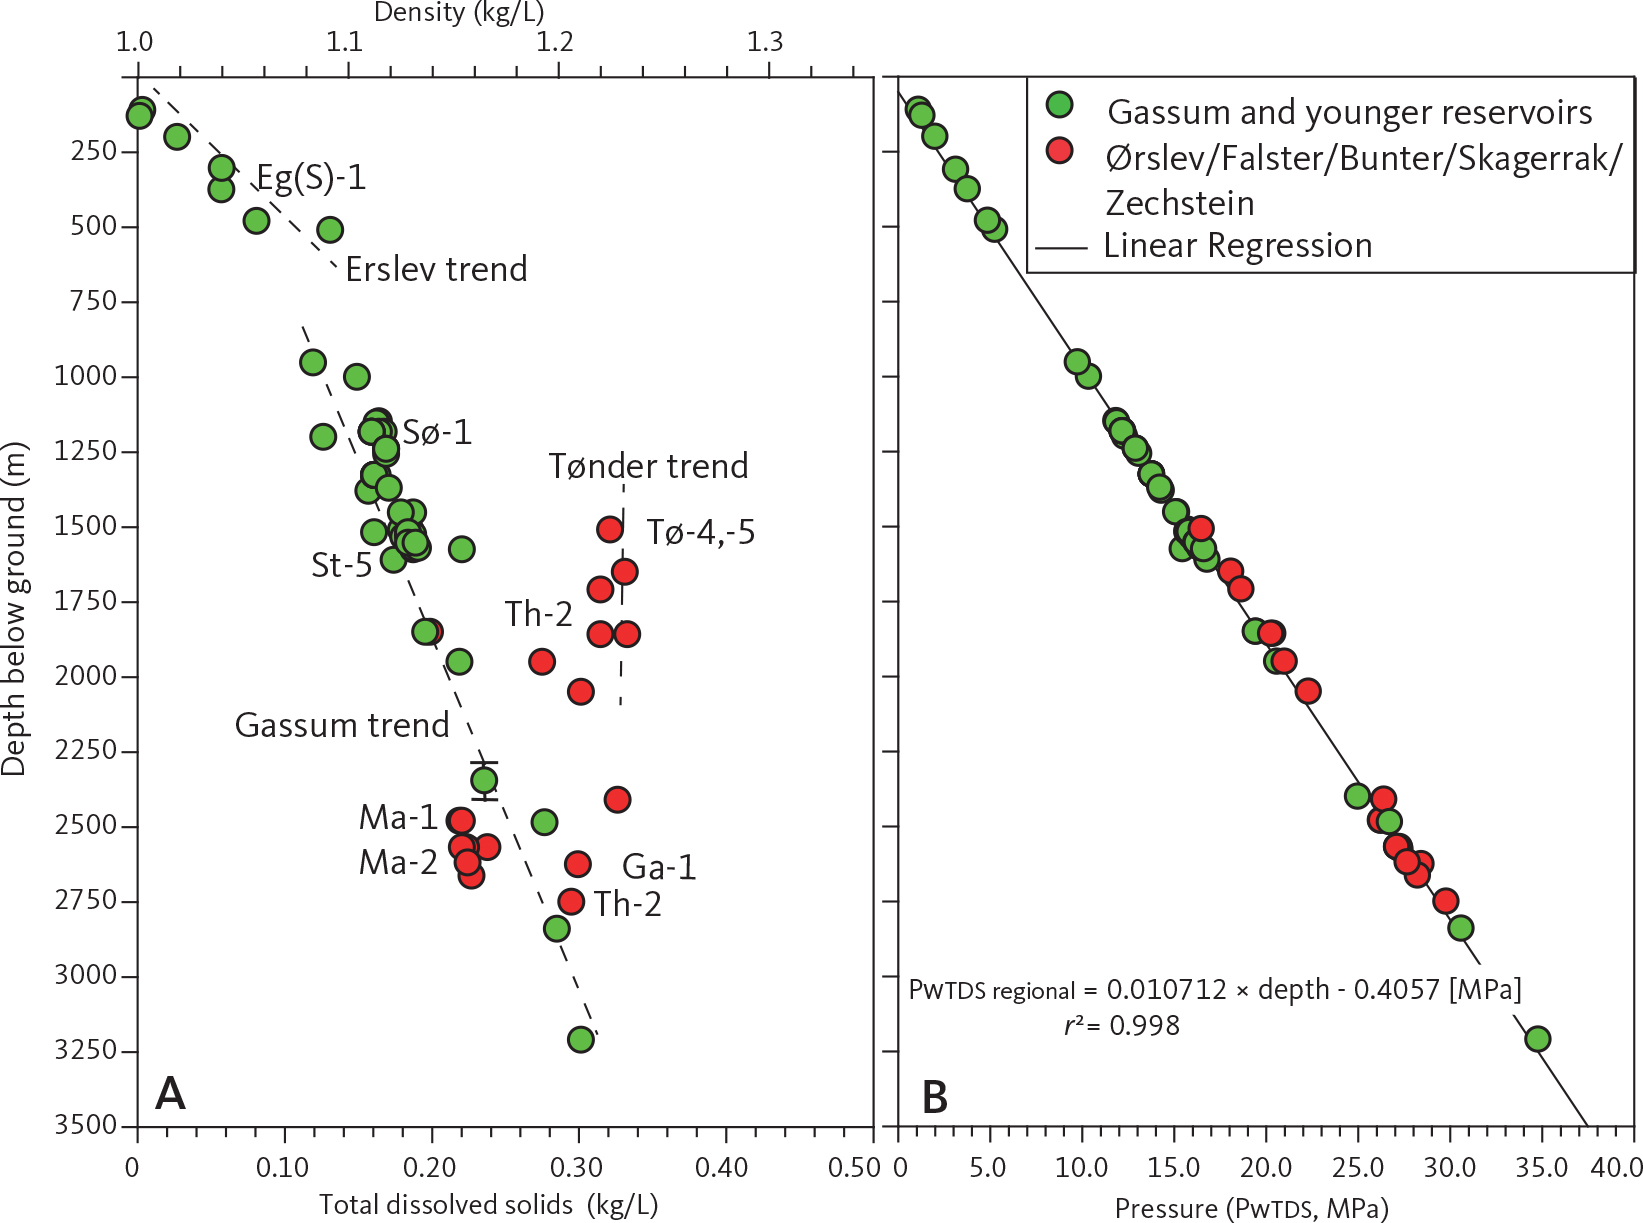
Fig. 9 (A): Total dissolved solids (TDS) in brine samples. (B): Hydrostatic pressure (PwTDS) derived from Eq. 3. Salinity data from Schovsbo et al. (2025).

where TDS0.5 (in kg/L) is half the TDS content at the base of the water column, and h represents the depth in metres below ground level.
4.4 Lift pressure
The minimum pressure (Plift) required to raise brine to the surface was calculated as:

where TDS (in kg/L) is the measured or estimated salinity of the formation brine at the base of the water column, and h represents the height in meters of the lifted brine.
5 Results
5.1 A hydrostatic reference pressure model
The salinity reference profile for deep brines in Denmark exhibits a general increase with depth (Fig. 9A; Schovsbo et al. 2025). At shallow depths, interaction between infiltrating groundwater and saline formation waters produces relatively steep salinity gradients, whereas at greater depths, salinity increases more gradually (Fig. 9A). Formations containing interbedded rock salt, typically within the Lower to Mid-Triassic terrestrial successions of the Danish and German basins (Fig. 1), display higher salinities compared to marine-influenced formations such as the Upper Triassic to Lower Jurassic Gassum Formation and younger formations (Fig. 9A). These differences tend to converge at depths exceeding 2.5 km.
The salinity measurements plotted in Fig. 9A were converted to hydrostatic pressure (PwTDS) via Eq. 3 and plotted versus depth in Fig. 9B. The higher salinities of the Bunter Sandstone Formation and older strata result in pressures approximately 0.6 MPa higher than those in younger and slightly less saline formations at equivalent depths (Fig. 9B). To establish a regional depth trend of PwTDS to be used in cases where no salinity data are available, we use the statistically significant pressure–depth relationship in Fig. 9B that is defined by:

where h is depth in metres below ground level. This provides a regional pressure model complementing the GEUS in-house pressure model presented in Schovsbo et al. (2025) that was not accompanied by supporting data.
5.2 Comparison with normal pressured wells
To validate the hydrostatic pressure model (Fig. 9B), calculated pressure was compared with in situ measurements from geothermal sites, the Stenlille gas storage facility and the Løgumkloster-1 well (see location in Fig. 2), none of which suggest anomalous pressure conditions. Pressure was derived using Eq. 3 from water salinity data of corresponding depth intervals of the pressure recordings using the method in Schovsbo et al. (2025) or from analogue wells. The results are summarised in Table 1 and plotted in Fig. 10 where the correlation between measured and calculated pressure is shown. According to our analysis, the correlation between in situ measurements and calculated hydrostatic pressure is highly significant (r = 0.999; P < 0.001 at n = 7; Fisher & Yates 1963) and follows the relationship:
| Well | Formation | TVD | TDS | PwTDS | Pw in situ | Pw in situ – Pw TDS | Plift | Plift – Pw TDS | Pressure class |
| m | kg/L | MPa | MPa | MPa | MPa | MPa | |||
| Stenlille-5* | Fjerritslev | 1427 | 0.1732 | 14.77 | 14.56 | –0.22 | 15.49 | 0.72 | Hydrostatic |
| Stenlille-5* | Gassum | 1570 | 0.1812 | 16.29 | 16.12 | –0.16 | 17.12 | 0.83 | Hydrostatic |
| Stenlille-19* | Bunter Sst | 2420 | 0.3224 | 26.10 | 25.70 | –0.40 | 28.38 | 2.28 | Hydrostatic |
| Margretheholm-1 | Skagerrak | 2487 | 0.2211 | 26.09 | 26.43 | 0.34 | 27.70 | 1.61 | Hydrostatic |
| Sønderborg-2 | Gassum | 1127 | 0.1673 | 11.65 | 12.01 | 0.36 | 12.20 | 0.55 | Hydrostatic |
| Thisted-2 | Skagerrak | 1823 | 0.2692 | 19.38 | 19.04 | –0.34 | 20.81 | 1.43 | Hydrostatic |
| Løgumkloster-1 | Zechstein Group | 2455 | 0.4641 | 27.50 | 27.20 | –0.30 | 30.82 | 3.33 | Hydrostatic |
| Tønder-1 | Chalk Group | 480 | 0.0808 | 4.84 | 4.95 | 0.11 | Overpressured | ||
| Tønder-1 | Zechstein Group | 2186 | 0.4641 | 24.48 | 27.45 | 2.96 | Overpressured | ||
| Tønder-3* | U. Bunter Sst | 1655 | 0.3190 | 17.84 | 18.77 | 0.93 | 19.38 | 1.54 | Overpressured |
| Tønder-3* | L. Bunter Sst | 1809 | 0.3248 | 19.53 | 20.41 | 0.88 | 21.24 | 1.71 | Overpressured |
| Gassum-1 | Ørslev | 2687 | 0.2880 | 28.71 | 30.97 | 2.26 | Overpressured | ||
| Hønning-1 | Zechstein Group | 2400 | 0.4641 | 26.88 | 34.20 | 7.32 | 30.13 | 3.25 | Overpressured |
| Eg(S)-1 | Chalk Group | 311 | 0.0586 | 3.11 | 3.16 | 0.05 | Overpressured | ||
| Grindsted-1 | Chalk Group | 350 | 0.0586 | 3.51 | 3.57 | 0.06 | Overpressured | ||
| Suldrup-8 | Zechstein Group | 452 | 0.4452 | 5.03 | 5.62 | 0.59 | Overpressured | ||
| *Selected pressure measurements. Løgumkloster-1 & Hønning-1: Salinity estimated from Tønder-1 (Laier 1989). Tønder-3: Salinity estimated from Tønder- 4 and -5 (Laier 1989). Grindsted-1: Salinity estimated from Eg(S)-1 (Dinesen 1961). Gassum-1: Salinity of well flow estimated from Danish American Prospecting (1951). |
|||||||||

Fig. 10 Comparison of pressure estimated from brine (PwTDS), measured in situ (Pw in situ) and estimated lift pressure (Plift). Data in Table 1.

The next section provides a detailed account of the in situ measurements used in the comparison.
5.2.1 Margretheholm geothermal test site (not in operation)
Located in Copenhagen, Margretheholm-1 targeted the Skagerrak Formation and is situated in the Danish Basin (Fig. 4). At 2487 m, pressure was measured at 26.4 MPa (Dong E&P 2003). Using a brine sample (TDS = 0.2211 kg/L) at comparable depth, the hydrostatic pressure estimate is 26.1 MPa, differing by c. 0.3 MPa. Pressure needed to lift the formation water from 2487 m and to the surface (Plift) is estimated as 1.6 MPa overpressure (Table 1).
5.2.2 Sønderborg geothermal test site (not in operation)
The Sønderborg geothermal test site is situated in southern Jylland within the North German Basin (Fig. 4). A downhole pressure of 12.0 MPa was measured in Sønderborg-2 at 1127 m within the Gassum Formation during a well test (Dong Energy 2010). Using the available water chemistry from a comparable depth with a TDS of 0.1673 kg/L in Eq. 3 gives a pressure estimate of 11.7 MPa, c. 0.4 MPa lower than the measured value. Pressure needed to lift the formation water from 1127 m to the surface (Plift in Eq. 4) is estimated as 0.6 MPa overpressure (Table 1).
5.2.3 Thisted geothermal test site (in operation)
The Thisted geothermal test site is situated in Northern Jylland within the Danish Basin (Fig. 4). A drill stem test in Thisted-2 within the Skagerrak Formation at 1823 m recorded a pressure of 19.04 MPa (Dansk Olie og Naturgas 1982, p. VI). The calculated pressure based on a water sample with a TDS of 0.2692 kg/L is 19.4 MPa, resulting in a deviation of c. 0.3 MPa. To lift the formation water from 1830 m to the surface (Plift), the pressure needed is estimated to be 1.4 MPa overpressure (Table 1).
5.2.4 Stenlille natural gas storage facility (in operation)
The Stenlille natural gas storage facility is situated on Sjælland within the Danish Basin (Fig. 4). Pressure measurements from multiple sand beds in both the Gassum and Fjerritslev Formations (between 1240 and 1675 m) in Stenlille-5 (Dansk Naturgas 1989) reveal a consistent pressure gradient (Fig. 11). From the Stenlille-5 tests (see Fig. 11), we have selected two measurements in our evaluation (Table 1). In the Gassum Formation at 1570 m, the pressure was measured to be 16.1 MPa, and a corresponding water sample with 0.1812 kg/L TDS yields an estimated hydrostatic pressure from Eq. 3 of 16.3 MPa, i.e. a difference of 0.2 MPa. In the Fjerritslev Formation, we estimate the TDS in 1427 m from Schovsbo et al. (2025) to be 0.1732 kg/L yielding a corresponding pressure of 14.8 MPa, which is c. 0.2 MPa to high compared to the measurement of 14.6 MPa (Table 1). Pressure needed to lift the formation water from the Gassum Formation at 1570 m and to the surface (Plift) is estimated as requiring 0.8 MPa overpressure (Table 1). Pressure in the Bunter Sandstone Formation was recorded in Stenlille-19 within the interval 2410−2420 m (TVD). At 2420 m, 25.7 MPa was measured, and using a salinity of 0.3224 kg/L of a corresponding sample, we estimate the pressure to be 26.1 MPa c. 0.4 MPa too high. The lift pressure is estimated to be 2.3 MPa overpressure.
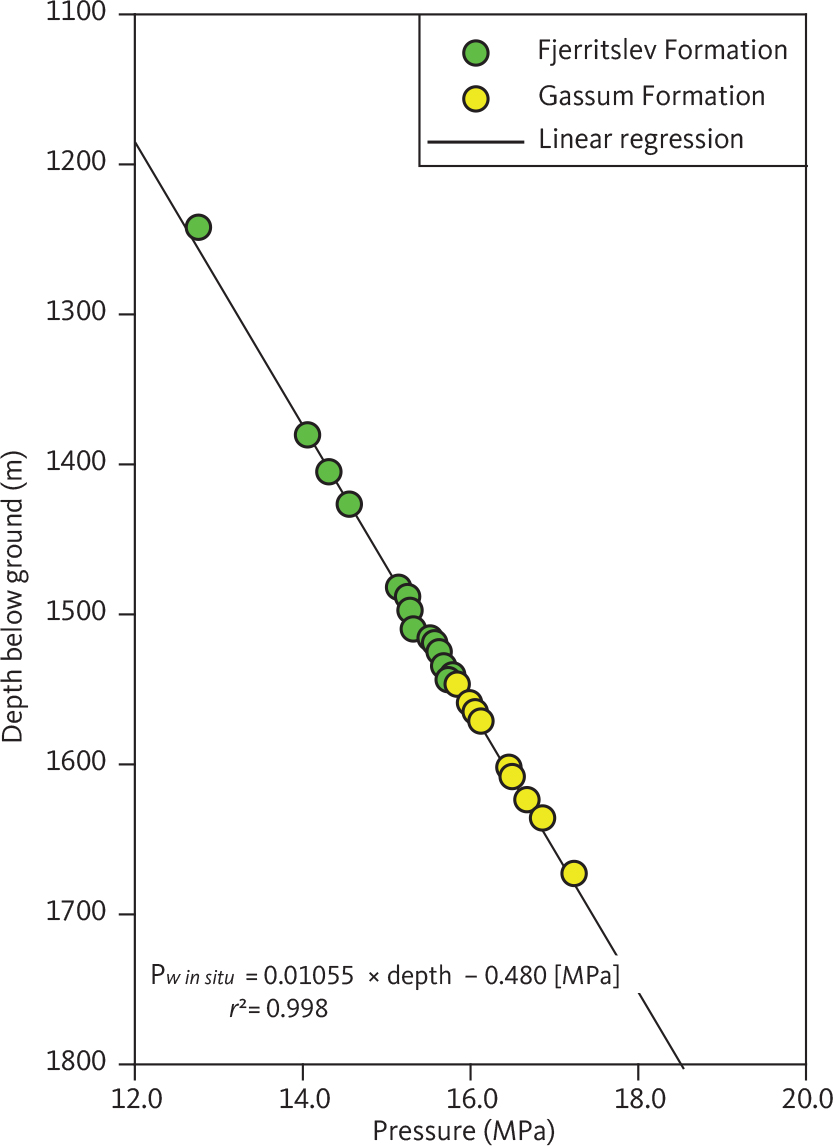
Fig. 11 Pore pressure (Pw in situ) within permeable sands in the lower Fjerritslev and upper Gassum Formations in the Stenlille-5 well (Dansk Naturgas 1989).
5.2.5 Løgumkloster-1 well
A Zechstein carbonates play was explored in the Løgumkloster-1 well in southern Jylland, North German Basin (Fig. 4; Schovsbo & Jakobsen 2019). An oil and gas accumulation was encountered in the Zechstein section, and a series of repeat formation tester (RFT) measurements was made (Dansk Boreselskab 1981a). In the basal section (test 1: 2455.5–2459.5 m), the build-up bottom hole pressure was 27.2 MPa, which was supported by the 27.3 MPa from RFT measurements (Dansk Boreselskab 1981a, p. 78). During the test, reservoir fluid did not reach the surface in the main flow period of 10 h, suggesting no overpressure.
As no water chemistry data are available for Løgumkloster-1, we used the water composition from the Zechstein interval in the Tønder-1 well located 10 km south of Løgumkloster-1 (Fig. 4) as the basis for our evaluation (Table 1). According to this, the hydrostatic pressure is 27.5 MPa at the top of the tested zone, which is 0.3 MPa too high compared to the recorded in situ pressure. The lift pressure needed to lift the reservoir fluid to the surface is estimated to be 30.8 MPa and requires 3.3 MPa overpressure (Table 1).
5.3 Comparison with overpressured wells and deep artesian wells
We compare pressure from documented overpressured wells and deep wells exhibiting artesian flow to the hydrostatic pressure model to assess the range of observed pressure build-ups in the subsurface. In the following section, we primarily rely on the compilation of artesian wells presented by Dinesen (1961) together with analyses of outpouring water, supplemented by additional information from Jacobsen et al. (1984), although omitting for the time being their detailed accounts of well blowouts and drilling anomalies encountered during salt-dome drilling campaigns. The well records have been further supplemented with data from the Tønder-3, Gassum-1, Hønning-1 and Grindsted-1 wells, interpreted as artesian based on our own review (see also Laier 1989 for Gassum-1) of the completion reports. Data are summarised in Table 1 and plotted in Fig. 10.
5.3.1 Tønder wells
The Tønder structure is situated in southern Jylland within the North German Basin and has been identified as a potential natural gas storage site (Labaune & Knudsen 1987), CO2 storage site (Larsen et al. 2003) and geothermal site (Hjuler et al. 2019). The Tønder structure contains a small nitrogen gas cap in the Upper Bunter Sandstone Formation and has been penetrated by five wells (Tønder-1 to Tønder-5; see Fig. 4). Artesian flow has been documented in the Chalk and Zechstein Groups (Tønder-1, Danish American Prospecting 1952; Tønder-5, Dansk Olie og Naturgas 1983), and pressure measurements have been made in the Bunter Sandstone Formation (Tønder-2, Danish American Prospecting 1953; Tønder-3, Dansk Boreselskab 1981b).
The Zechstein rock salt flow was the most extensive, continuing for more than a week at rates of around 1000–1240 L/h (Danish American Prospecting 1952, p. 143). Other flows were minor and controlled by increasing mud weight. Based on the salinity of the water, we estimate the lift pressure and thus minimum overpressure in the Zechstein to be c. 3.0 MPa (Table 1). Twenty-five in situ pressure measurements in the Upper and Lower Bunter Sandstone Formation (Table 1) made in Tønder-3 indicate a minor overpressure of c. 0.9 MPa, less than the calculated lift pressure (c. 1.7 MPa; Table 1).
5.3.2 Gassum-1 well
The Gassum-1 well is located in central Jylland in the Danish Basin on the Gassum structure identified as a potential CO2 storage site (Fig. 4; Gregersen et al. 2025). In the Ørslev Formation at and below 2687 m, the well ‘flowed under natural head’ (Danish American Prospecting 1951, pp. 305–306). The flow consisted of saline brine that nearly reached the surface as it filled the conductor pipe (Danish American Prospecting 1951, p. 324). When the brine was displaced by mud, a full analysis of its composition was undertaken (Table 2). We use the water composition of the water sample representing the last part of the flow of 0.2880 kg/L (TDS) to calculate a hydrostatic pressure of 28.8 MPa, and we use the weighted average of the recovered brine of 0.1895 kg/L (TDS) to estimate an in situ pressure of 29.4 MPa i.e. the pressure that would have been required to lift the brine to surface. We estimate that an overpressure of 2.3 MPa would be needed to lift the saline brine from the influx point to the surface, whereas only 0.7 MPa overpressure was calculated for the actual flow, consistent with the fact that the flow ceased before reaching the surface (Danish American Prospecting 1951).
| Time 19.01.1949 |
Salt content (TDS)g/Kg |
| 19:50 | 26 |
| 20:10 | 60 |
| 20:30 | 77 |
| 20:50 | 165 |
| 21:10 | 192 |
| 21:30 | 215 |
| 21:50 | 260 |
| 22:10 | No sample |
| 22:30 | No sample |
| 22:31 | Returns from bottom |
| Salt content converted from original units (% wt), yielding weighted TDS average of 0.1895 kg/L. TDS: total dissolved solids. | |
5.3.3 Hønning-1 well
The Hønning-1 well was drilled in southern Jylland within the North German Basin (Fig. 4). A drill stem test conducted at 2388 m produced gas-cut, muddy saline water within the Zechstein Group. Pressure measurements recorded before and after the test indicate a downhole pressure of 34.2 MPa (Danish American Prospecting 1958a). No water samples were recovered during the test.
Artesian saltwater flow occurred at approximately 2400 m within the Zechstein dolomites, with reported flow rates of 800–3500 L/h (Danish American Prospecting 1958a, p. 45). The flow was killed by increasing the mud weight so that it exerted a bottom hole pressure of 39.4 MPa. Assuming a brine salinity comparable to that measured in the Zechstein interval of the Tønder-1 well (0.4641 kg/L), the corresponding hydrostatic pressure at 2400 m is estimated at 26.9 MPa, implying an overpressure of approximately 7.3 MPa. Based on this estimate, a minimum overpressure of c. 3.3 MPa is inferred to have sustained the observed artesian flow (Table 1).
5.3.4 Eg(S)-1 well
Eg(S)-1 was drilled on the northern flank of the Ringkøbing–Fyn High in Jylland (Fig. 4). Artesian saltwater flow occurred at c. 311 m, at the Eocene–Danian boundary (Dinesen 1961). The sampled fluid was a sodium chloride solution with significant calcium chloride and magnesium chloride (Dinesen 1961), interpreted as a mixture of freshwater and concentrated brine. The TDS was 0.0586 kg/L, corresponding to an estimated hydrostatic pressure of 3.2 MPa. A minimum overpressure of approximately 0.05 MPa is inferred to have sustained the observed flow (Table 1).
5.3.5 Grindsted-1 well
Grindsted-1 is drilled on the northern flank of the Ringkøbing–Fyn High, approximately 8 km east of Eg(S)-1 (Fig. 4). The well reportedly flowed saltwater from the Danian section as seen in Eg(S)-1. No chemical analyses or detailed descriptions of flowing conditions are documented in the Grindsted-1 well report (Danish American Prospecting 1958b). We use the chemical composition of the Eg(S)-1 well to estimate the hydrostatic pressure to be 3.5 MPa at 350 m. A minimum overpressure of approximately 0.06 MPa is inferred to have sustained the observed flow (Table 1).
5.3.6 Suldrup-8 well
The Suldrup-8 well was part of an extensive salt dome drilling campaign that targeted shallow salt diapirs (Jacobsen et al. 1984). The well was drilled in northern Jylland within the Danish Basin (Fig. 4). During drilling of Suldrup-8 and Suldrup-10 in 1951, a high-pressure brine accumulation was encountered at approximately 452 m (Dinesen 1961; Jacobsen et al. 1984). Artesian flow continued over an extended period, with at least 200 m³ of calcium chloride brine erupted. According to Dinesen (1961), the brine composition resembled that of a brine sample from the rock-salt succession in the Zechstein interval of Tønder-1, characterised by elevated concentrations of bromide, boron and ammonium, and a notably low pH. Hydrogen gas was also reported, containing approximately 4% H2 and 60–70% CH4. The measured TDS was 0.4452 kg/L, corresponding to an estimated hydrostatic pressure of 5.0 MPa. A minimum overpressure of approximately 0.6 MPa is inferred in order to have sustained the flow (Table 1).
6 Discussion
6.1 Present-day hydrostatic pressure
The current study primarily relies on direct pore pressure measurements and flowing well observations. Additional data such as mud weights, wellbore stability assessments, cuttings characteristics and advanced wireline logging could enhance the understanding of subtle pressure variations. Notably, reported artesian flows predominantly stem from initial drilling phases (in the 1950s) conducted by the Danish American Prospecting Company (DAPCO). Adjustments in drilling practices, such as increasing the mud weight, which were informed by these initial observations, may have obscured subsequent modest overpressure indicators, potentially leading to underrepresentation of overpressure occurrences. Thus, overpressure might be more widespread than currently documented. Nonetheless, our main objective remained to establish a robust baseline for hydrostatic pressure and underscore historically underappreciated overpressure phenomena, given their significance for subsurface CO2 and energy storage and geothermal exploration risk assessments.
Our hydrostatic pressure model (Eq. 3) employs a simplified linear salinity gradient from the surface to the depth of interest, ignoring potential local interactions with fresh groundwater or other potential disturbances in the salinity profile such as saline fluids related to rock salt dissolution. The close correlation between the modelled pressure and in situ measurements (Fig. 10) justifies this simplified approach, enhancing its practical utility for future regional pressure assessments. However, future detailed site assessments should incorporate more detailed pore pressure models, drilling data and local groundwater interactions, particularly near areas of potential significant rock salt dissolution or freshwater recharge zones.
6.2 Causes of overpressure
In the Danish Central Graben, the documented regional overpressure in the Chalk Group results primarily from disequilibrium compaction linked to rapid sedimentation, particularly of the Paleogene-Neogene mudstones (Japsen 1998; Dennis et al. 2005; Vejbæk 2008; Orozova-Bekkevold et al. 2023). Overpressure within Jurassic reservoirs is attributed to fluid migration trapped beneath sealing Cretaceous mudstones and basal Chalk layers.
In contrast, the limited occurrences of overpressure documented in this study (Fig. 1, Table 1) are geographically restricted, appear more complex, and demonstrate a magnitude considerably lower than those reported from the Danish Central Graben (Schovsbo et al. 2020). The absence of significant post-Chalk sedimentation combined with regional uplift (Fig. 1) likely facilitated the dissipation of previously existing overpressure (if any), allowing regional hydrostatic equilibrium to be established. This equilibrium thus closely aligns with pressure predicted by brine density profiles (Fig. 10).
In the Tønder structure, overpressure within Zechstein carbonates and the Bunter Sandstone Formation is likely to arise from gas generation and fluid expansion. Nitrogen gas in the Tønder structure possibly migrated from deeper, southern-source kitchens (Schovsbo & Jakobsen 2019) and became trapped in an aquifer system that was sealed prior to uplift (Japsen et al. 2007). Subsequent thermal contraction due to cooling from uplift and possibly leak due to fault reactivation during Neogene–Quaternary tectonism (Sandersen & Jørgensen 2015) might have contributed to reduce the magnitude of the observed overpressure.
Similar association with overpressure and gas content is seen in the Suldrup-8 and in the Hønning-1 wells. For Hønning-1, the overpressure likely arises from gas generation and fluid expansion, as in the Tønder Structure, since the outpour of water occurred in close connection with a test that produced mostly ‘air’, although no compositional analysis was made. In Suldrup-8, however, the salt diapir itself may suggest structural stress, in addition to diagenetic-induced overpressure. The structural stress is caused by mineral dewatering or pore-space reduction derived as a result of the cementation of minerals from saturated brines (Swarbrick & Osborn 1998). This is also a process that cannot be discounted for the Tønder structure either, as halite cement occurs abundantly within the Bunter Sandstone Formation (Hjuler et al. 2019).
The Gassum-1 overpressure in the Ørslev Formation was not associated with known gasses and thus differs from the above-mentioned cases. The Gassum-1 might be evidence of a larger and now derelict pressure system associated with insufficient pressure dissipation following deep burial prior to Neogene uplift (Fig. 1). In that case, it is testimony to very competent seal units within the Ørslev and Oddesund Formations. We know from the Tønder structure that the same formations can withhold similar slight overpressure as seen in Gassum-1 (about 1 MPa in Bunter Sandstone Formation in the Tønder-3 well compared to less than 2 MPa in the Gassum-1 well; Table 1). As this pressure would have been higher at peak burial, such hypothetical pressure systems would have reduced the effective burial depth causing higher-than-expected porosities (Swarbrick & Osborne 1998).
Previous studies by Kristensen et al. (2016) and Weibel et al. (2017b) indicate that porosity reduction for the Gassum Formation aligns with normal compaction trends when adjusted for maximum burial depth, providing limited support for significant and now relict overpressure in the Gassum Formation; however, a similar study has yet to be made for the Bunter Sandstone and Skagerrak Formations.
Local causes for overpressure in the Gassum-1 well are also possible, thereby reducing the regional significance of the finding. The Gassum-1 is drilled in a structurally complex setting (Gregersen et al. 2025), and overpressure might result from lateral tectonic compression associated with fault reactivation, as the Gassum-1 well intersects a fault system (Fig. 12). Diagenetic processes, including smectite-to-illite transformation and gypsum-to-anhydrite transitions, could further contribute to fluid volume changes, and porosity reduction under deep burial is also likely. The Gassum structure has a high positive relief of 900 m (Fig. 12; Gregersen et al. 2025), and diagenetic dewatering from more deeply buried down-dip parts of the reservoir system may have contributed to the observed overpressure.
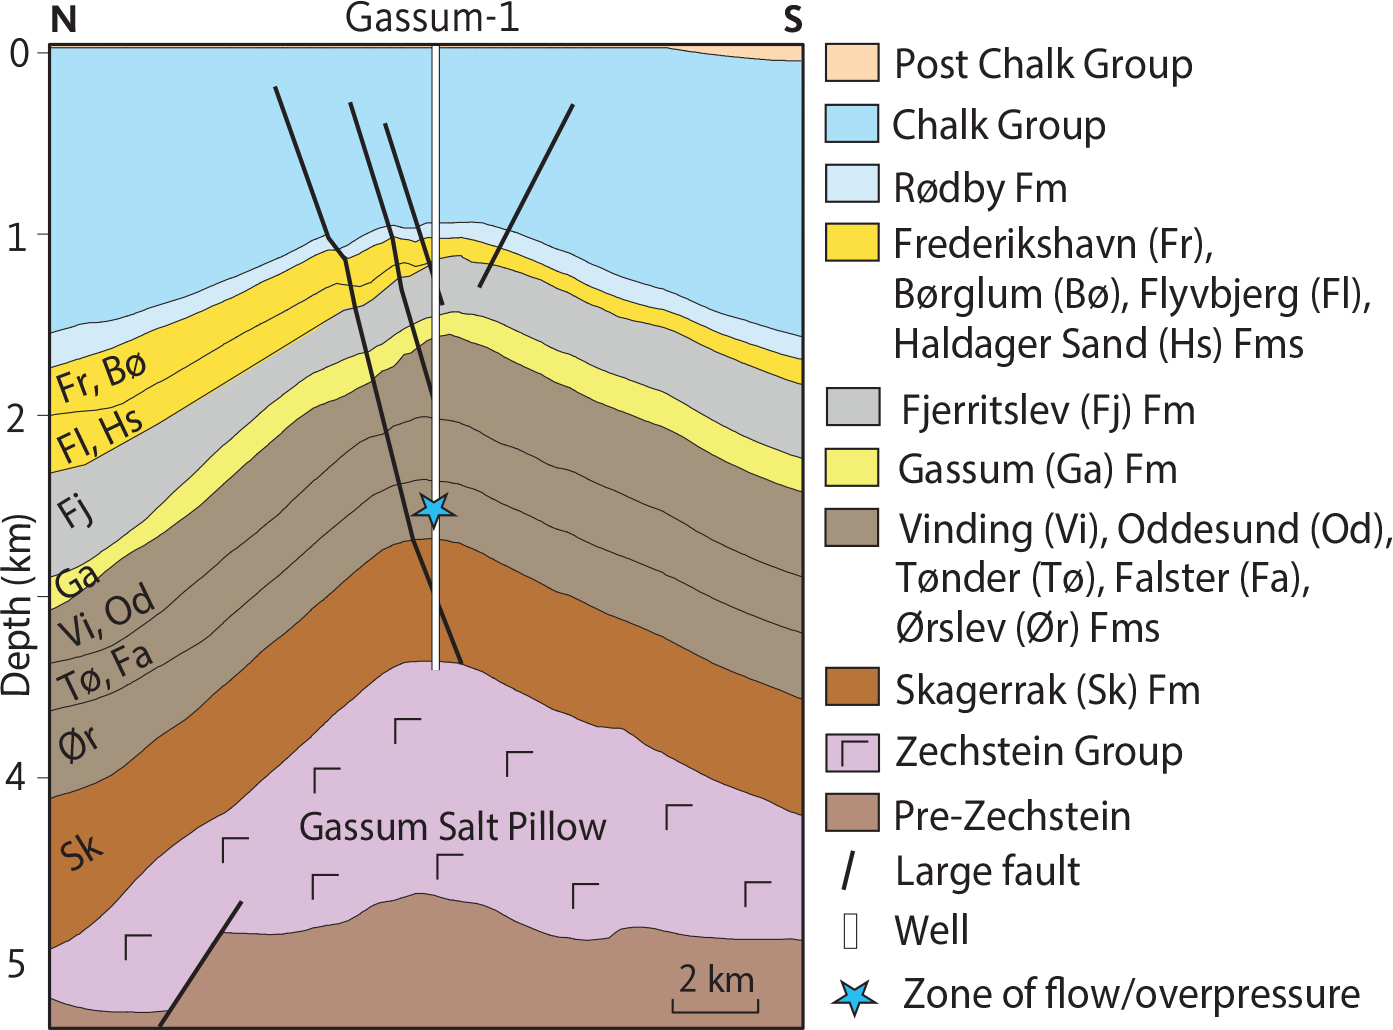
Fig. 12 Simplified geological cross section through the Gassum Structure with indication of approximate position of flow zone. For location, see Fig. 4. Modified from Gregersen et al. (2025).
The shallow overpressure in the Paleogene–Danian intervals (Grindsted-1, Eg(S)-1 and Tønder wells) are not easily explained by disequilibrium compaction due to general low post chalk sedimentation rates and significant regional uplift. Instead, Neogene uplift, erosion and tilt followed by groundwater infiltration up dip may have created hydraulic heads from hydraulic active recharge areas and can thus explain these occurrences, as illustrated in Fig. 7. Hydraulic active zones of shallow buried chalk are already established and we presume that this could extend to greater depths and to conditions within the saltwater zone. If these findings can be extended to a regional scale, then it has implications for subsurface fluid migration, influencing leakage risks to site evaluation for nuclear waste disposal (Midtgaard et al. 2022).
For Tønder-1, the pressure observed in the Chalk Group 1 may also partly be related to active leakage pathways. This is corroborated by the work of Sandersen & Jørgensen (2015) in the Tønder areas where they found evidence of fault reactivation following neotectonics features. Likewise, the observed artesian flow in Eg(S)-1 and Grindsted-1 might be attributed to local conditions, formed either by local groundwater motions (see Vangkilde-Pedersen et al. (2011) for examples) or from glacial over-compaction of isolated water bodies within the drilled sequence.
6.3 Implications for subsurface storage
Figure 13 summarises key subsurface pressure relationships for onshore Denmark, integrating both modelled and measured data presented in this study. For regional context:
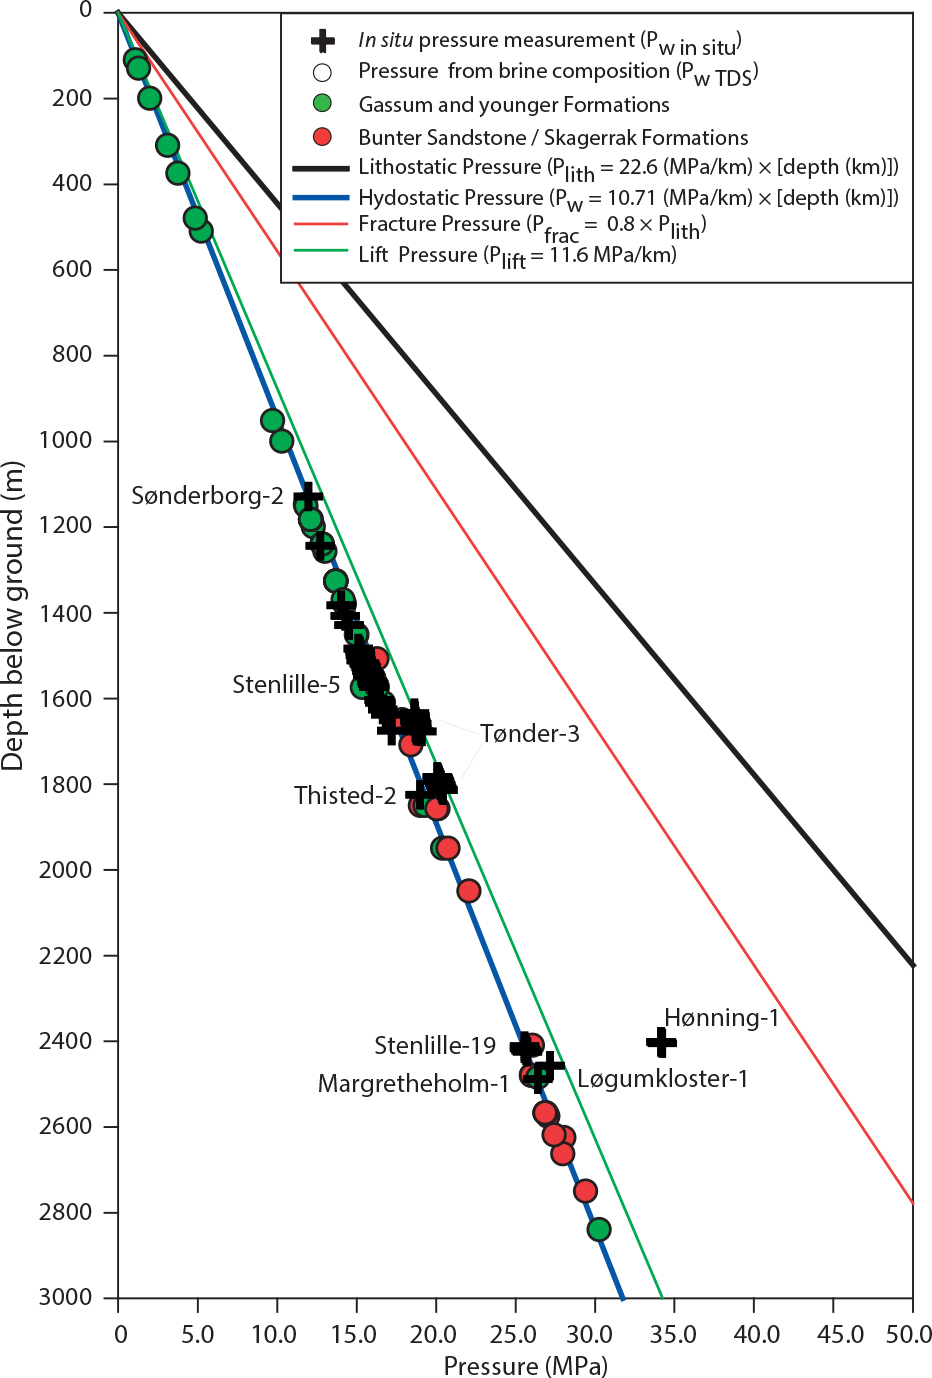
Fig. 13 Summary of the subsurface pressure relationships onshore Denmark and the modelled and measured pressure data presented in this paper.
- Hydrostatic pressure gradient: c. 10.71 MPa/km (Pw TDS regional, this study).
- Lithostatic pressure gradient: c. 22.6 MPa/km.
- Fracture pressure: Estimated at c. 0.8 × lithostatic gradient, representing the upper limit for safe operational pressure (Williams et al. 2022; GEUS in-house data).
In addition, we calculate the theoretical lift pressure gradient to be approximately 11.58 MPa/km – around 10% higher than the hydrostatic gradient. This parameter defines the minimum aquifer overpressure required to initiate natural brine discharge to the surface.
Aquifer connectivity critically influences subsurface CO2 storage capacities. Closed or compartmentalised aquifers, constrained by rock and fluid compressibility, inherently limit storage capacity. In contrast, open aquifers – defined by hydraulic connectivity via faults or permeable strata – can naturally dissipate overpressure by enabling brine discharge, thus enhancing storage flexibility (Fig. 3).
The primary CO2 storage targets, notably the Gassum and Bunter Sandstone/Skagerrak Formations, largely exhibit hydrostatic conditions but lack regionally significant direct atmospheric connections, thus emphasising reliance on indirect discharge mechanisms. Given the uncertainties around the effectiveness of Quaternary sediment sealing in areas like the Norwegian Trench and on the Skagerrak/Kattegat Platform where Mesozoic sediments subcrops (Fig. 5), direct geophysical investigations and targeted shallow drilling should be prioritised. Additionally, detailed studies of fault transmissivity are crucial to refining storage capacity predictions and operational safety.
In areas lacking direct reservoir outcrop and overlain by younger sediments, fault connectivity may instead control natural discharge potential. The transmissivity of these deep-rooted faults is, however, unknown and remains speculative. Evidence has been presented for deep-rooted faults being activated by Neogene–Quaternary tectonics (Sandersen & Jørgensen 2015). Also, deep rooted faults appear to exert control on the orientation of deep Quaternary incised valleys, which could potentially influence fluid migration patterns within CO2 storage as proposed by Sandersen & Jørgensen (2022). Likewise, Putnaite et al. (2025) pointed out the importance of salt diapir tectonics and incised wally systems important for groundwater extraction. However, the focus of these studies has been on CO2 leakage. Based on the present study, we are able to stress that monitoring strategies should extend beyond storage site proximities, evaluating distal fault pathways for potential brine in addition to CO2 migration risks. Modelling aquifer pressure build-up against lift pressure derived from brine salinity provides an essential risk assessment tool.
The Paleocene clay’s regional sealing effectiveness atop the Chalk Group underscores complexities in subsurface fluid dynamics. Regional tilting is likely to direct fluid migration south-west beneath this impermeable seal, highlighting the critical need to evaluate groundwater-extraction impact and freshwater – saline water interface dynamics in subsurface storage planning.
The clear closed-system character of the Bunter Sandstone Formation in the Tønder Structure contrasts with the uncertain compartmentalisation of the Skagerrak Formation at Gassum-1. Such structural uncertainties necessitate detailed characterisation and modelling to reliably predict storage capacities and ensure operational safety, avoiding premature termination of storage projects due to inadequate aquifer assessments (Mukhtar et al. 2024).
The potential environmental impacts of brine discharge – either naturally occurring or induced by operational activities – require thorough assessment. Discharged brines may affect groundwater quality and surface ecosystems due to their chemical composition, which may include high salinity and potentially toxic trace elements. Therefore, detailed hydrogeochemical evaluations and toxicity assessments should become integral parts of storage and monitoring strategies.
Furthermore, active pressure management through controlled brine production, reinjection into suitable formations or safe offshore discharge may represent potential strategies for mitigating reservoir pressure build-up. However, the feasibility of reinjection – particularly into shallower formations – depends on site-specific factors such as fracture pressure, containment integrity and hydraulic connectivity. In some settings, shallower units may provide limited pressure tolerance, emphasising the need for careful evaluation before implementation. Where appropriate, such approaches could enhance storage efficiency and support the long-term viability and safety of CO2 storage operations (Nielsen et al. 2017).
Evaluating the safety and efficiency of subsurface CO2 storage requires careful consideration of the potential for natural brine discharge driven by reservoir pressure. The theoretical lift pressure (Plift) – the minimum overpressure required to lift formation brine from the reservoir depth to the surface – offers a valuable metric. In practice, however, sustaining measurable artesian flow typically requires pressure exceeding this minimum, as flow rates depend on formation permeability, pressure gradients and well or fault transmissivity. Minor overpressure may therefore be insufficient to generate environmentally significant discharge. Lift pressure should thus be regarded as a screening-level parameter, while practical risk assessments must consider site-specific conditions and the magnitude and persistence of potential flow. Further numerical simulations are needed to model potential leaks and pressure communication including natural brine discharge pathways such as fault zones and salt diapirs.
7 Conclusions
This study provides a first-order evaluation of subsurface pressure conditions onshore Denmark, delivering a regional hydrostatic pressure model, validating it against in situ data, and documenting localised overpressure occurrences. Key conclusions include:
- The Gassum and Bunter Sandstone/Skagerrak Formations, the primary CO2 storage targets, generally exhibit hydrostatic pressure consistent with brine-density-based predictions. This offers a reliable baseline for regional pressure modelling and storage planning.
- Overpressure is restricted to specific formations (e.g. Zechstein carbonates, Bunter Sandstone and Ørslev Formations), associated with high-salinity brines and structural or diagenetic factors. These zones highlight potential risks of hydraulic isolation, which could limit storage capacity by reducing pressure dissipation during CO2 injection.
- Natural discharge pathways – such as deep-rooted faults or subcropping aquifers – are critical for pressure relief in open systems.
- Our findings thus emphasise that future monitoring strategies must not only address immediate fault-related leakage risks near the storage sites but also include distal fault zones potentially activated by increased reservoir pressure.
- Effective pressure management is essential not only for CO2 storage, but also for geothermal energy, subsurface energy storage and other use associated with the green transition. Strategies such as controlled brine production or reinjection may enhance operational flexibility and reduce environmental risks and help manage potential pressure adverse interferences.
Further research should prioritise detailed mapping of fault transmissivity, sealing capacity of quaternary cover on top of subcropping aquifers, geochemical characterisation of brines (including trace elements) and integrated pressure-flow modelling. These efforts will underpin safe, efficient and environmentally responsible utilisation of Denmark’s subsurface resources as part of the green energy transition.
Acknowledgments
This study is part of the GEUS subsurface pressure study funded by the Danish research reserve (Forskningsreserven 2025). We thank Carsten E. Thuesen for drafting the illustrations. We thank the three reviewers for valuable comments that improved the quality of the paper.
Additional information
Author contributions
NHS: Conceptualization, Data curation, Formal analysis, Investigation, Methodology, Software, Validation, Visualization, Writing – original draft and Writing – review & editing. HDH: Investigation, Methodology, Validation and Writing – review & editing. NS: Investigation, Methodology, Validation and Writing – review & editing. AM: Investigation, Visualization and Writing – review & editing. CMN: Investigation, Methodology, Project administration, Resources, Validation and Writing – review & editing.
Additional files
One Excel spreadsheet containing Supplementary Table S1 (Pressure estimates) is available at https://doi.org/10.22008/FK2/FCO82C.