|
MONOGRAPH  |
Late Palaeozoic – Danian tectonostratigraphic evolution of the onshore Danish area based on data from deep wells and reflection seismic
Lars Ole Boldreel1*  , Morten Sparre Andersen2 , Elina Kamla3, Henrik Vosgerau2 , Anders Mathiesen2 , Lars Henrik Nielsen2
Abstract
This study presents the tectonostratigraphic evolution of the Danish onshore and coastal inshore area constituting the Danish Basin and the northern part of the North German Basin, separated by the Ringkøbing–Fyn High, based on seismic, wireline log and lithologic data. The study area covers the northern part of the Central European Basin System which was characterised by repeated tectonic episodes since the Late Carboniferous. Based on well and seismic data released prior to 2022, 20 regional seismic horizons defining 17 stratigraphic units are interpreted. The composition of the units is determined from wireline log interpretation and lithological information by tying the seismic horizons to the wells. Gravity data compiled as Bouguer and free air anomaly maps supplemented the seismic interpretation. A layered digital elevation model in metres, composed of 17 grids with a cell size of 400 × 400 m, forms the basis for 17 depth and 16 isochore maps. The maps represent the Upper Permian – Cretaceous deposits by integrating seismic profiles, wireline and lithological data from the deep wells. Selected seismic reference sections with ties to the relevant wells illustrate the interpreted unit boundaries. Eight cross-sections augment the presented depth and isochore maps. The tectonic evolution of the study area took place in four stages: 1). Late Carboniferous – earliest Permian strike-slip, doming and igneous activity. 2). Early–Middle Permian domal subsidence followed by Late Permian – Triassic thermal subsidence and minor rift phases. 3). Jurassic – Early Cretaceous subsidence and minor rift phases. 4). Late Cretaceous –Danian deposition during a long-lasting major eustatic sea-level high. Mobilisation of Zechstein evaporites into salt structures greatly influences the depth and isochore maps in Jylland and the two islands south of Sjælland (Lolland and Falster). The study has established a general structural–stratigraphic framework for further studies and interpretations of the geological development of the area. The depth and isochore maps, together with eight cross-sections, provide a robust foundation for future exploration activities, such as storage of CO2, hydrogen, natural gas, radioactive waste etc., as well as utilisation of geothermal resources. Some of the results of the present study have been used as basic input for the Web-based Geographic Information System geothermal portal hosted by the Geological Survey of Denmark and Greenland.
Citation: Boldreel et al. 2026: GEUS Bulletin 63. 8408. https://doi.org/10.34194/9qf83r56
Copyright: GEUS Bulletin (eISSN: 2597-2154) is an open access, peer-reviewed journal published by the Geological Survey of Denmark and Greenland (GEUS). This article is distributed under a CC-BY 4.0 licence, permitting free redistribution, and reproduction for any purpose, even commercial, provided proper citation of the original work. Author(s) retain copyright.
Received: 18 Aug 2025; Re-submitted: 22 Dec 2025; Accepted: 23 Dec 2025; Published: 30 Oct 2026
Competing interests and funding: The authors declare no competing interests.
This study was supported by a targeted grant from the former Ministry of Energy and Climate resulting from the Climate Agreement of 12 March 2012 by the Danish parliament and a research grant from the Danish Innovation Fund (GEOTHERM-project 6154-00011B).
*Correspondence: lob@ign.ku.dk
Keywords: Seismic and wireline log interpretation, Structural evolution of on shore Denmark, Depth and isochore maps, Late Palaeozoic to Danian stratigraphy, Reservoirs for use to Deep Geothermal extraction and CO2 storage
Abbreviations:
Fm: Formation
GEUS: Geological Survey of Denmark and Greenland
GR: Gamma-ray
LDEM: layered digital elevation model
Mb: Member
MSL: mean sea level
NMO: normal move out
SCLIP: Skagerrak Centred Large Igneous Province
SP: self-potential
SSTVD: Sub Sea True Vertical Depth
STZ: Sorgenfri Tornquist Zone
TD: Total depth
TWT: Two Way Travel time
Edited by: Mads E Jelby (Aarhus University, Denmark)
Reviewed by: Lars Hamberg (INEOS Energy, Denmark) and Torsten Hundebøl Hansen (University of Oslo, Norway)
1 Introduction
The available data for the interpretation of the geological evolution of the Danish subsurface have expanded gradually due to exploration activities that were initiated in the early 1920s–1930s, and in 1964 the first deep tests were presented (Sorgenfrei & Buch 1964). The growing amount of data has been accompanied by new interpretations, leading to a gradually improved understanding of the geological evolution of the study area, and a modern lithostratigraphy of the Triassic and Jurassic being established (e.g. Bertelsen 1978, 1980; Michelsen 1978; Michelsen & Clausen 2002; Michelsen et al. 2003). A large amount of new data was generated in two periods, namely in 1982–1986 during a phase of intensive hydrocarbon exploration, and 1995–1997 in relation to storage of natural gas. While a number of previously published maps cover part of the study area, the present study maps the entire area coherently, presenting depth and isochore maps. Previous maps were based on seismic interpretation of the data available in the 1990s and include one showing the depth to the top of the Chalk Group by Ter-Borch (1991), and a series of depth maps (top Chalk, base Chalk, top Triassic and top Zechstein), with associated isochore and interval velocity maps, illustrating the evolution of the Danish Basin in Jylland north of the Ringkøbing–Fyn High by Britze & Japsen (1991) and Japsen & Langtofte (1991a, b). Binzer & Stockmarr (1994) compiled a map of the Pre-Quaternary surface topography, covering the Danish area apart from the North Sea based on many shallow cores. A map depicting the depth to the top pre-Zechstein covering the entire Danish area, including parts of the Norwegian and Swedish territorial waters, was compiled by Vejbæk & Britze (1994) and further discussed by Vejbæk (1997).
In 2013, it was decided to facilitate geothermal extraction by developing a public Geothermal WebGIS portal with the scope of presenting data and interpretation of the Danish subsurface and its geothermal potential. The portal was launched in May 2016 and includes information regarding the potential geothermal reservoirs, i.e. their depths, lithology, porosity, permeability, salinity etc. as well as results of a screening exercise of 27 potential sites for utilisation of deep geothermal energy in Denmark (Vosgerau et al. 2016; GEUS 2016).
To achieve the goal of stimulating geothermal energy ultilisation, regional depth and isochore maps were needed that charted in detail the distribution of the components of the Mesozoic succession in the Danish onshore and inshore areas. The present publication presents the principal results of a thorough and consistent mapping project that investigated the Danish onshore and inshore areas and form part of the data used for a Web-based Geographic Information System. The project was based on all reflection seismic and well data available in 2022. The seismic data were tied to geological interpretations of the deep wells to obtain a suite of maps that illustrate the detailed structure of the Mesozoic succession throughout the study area and are consistent with the lithostratigraphic interpretations of the well sections. This monograph summarises the outcome of the large mapping project and outlines the structural evolution of the entire Danish onshore and inshore area.
1.1 Scope of the work
The aim of the present study is to outline in a detailed and consistent manner the Late Paleozoic (Top pre-Zechstein) and Mesozoic (including top Danien) structural evolution of the Danish onshore and inshore area (Figs 1, 2). The study area comprises the Danish Basin, including the Sorgenfrei–Tornquist Zone, the Kattegat–Skagerrak Platform and the Øresund Basin (Erlström et al. 2018), the Ringkøbing–Fyn High, and the northernmost part of the North German Basin. The description of the structural evolution is founded on regional mapping of 16 stratigraphic units that tie to the deep wells (Nielsen & Japsen 1991). The mapped units are documented by reference seismic profiles with well ties and lithologic information from the deep wells. Depth maps to the top of the units and isochore maps of the mapped unit are depth-converted from TWT (Two Way Travel time) in seconds to metres, and the velocity function tapers the surfaces to comply with the well depths reported in Nielsen & Japsen (1991). Eight cross-sections with the vertical scale in TWT sec. illustrate the presented depth and isochore maps and are included in Appendix 1.
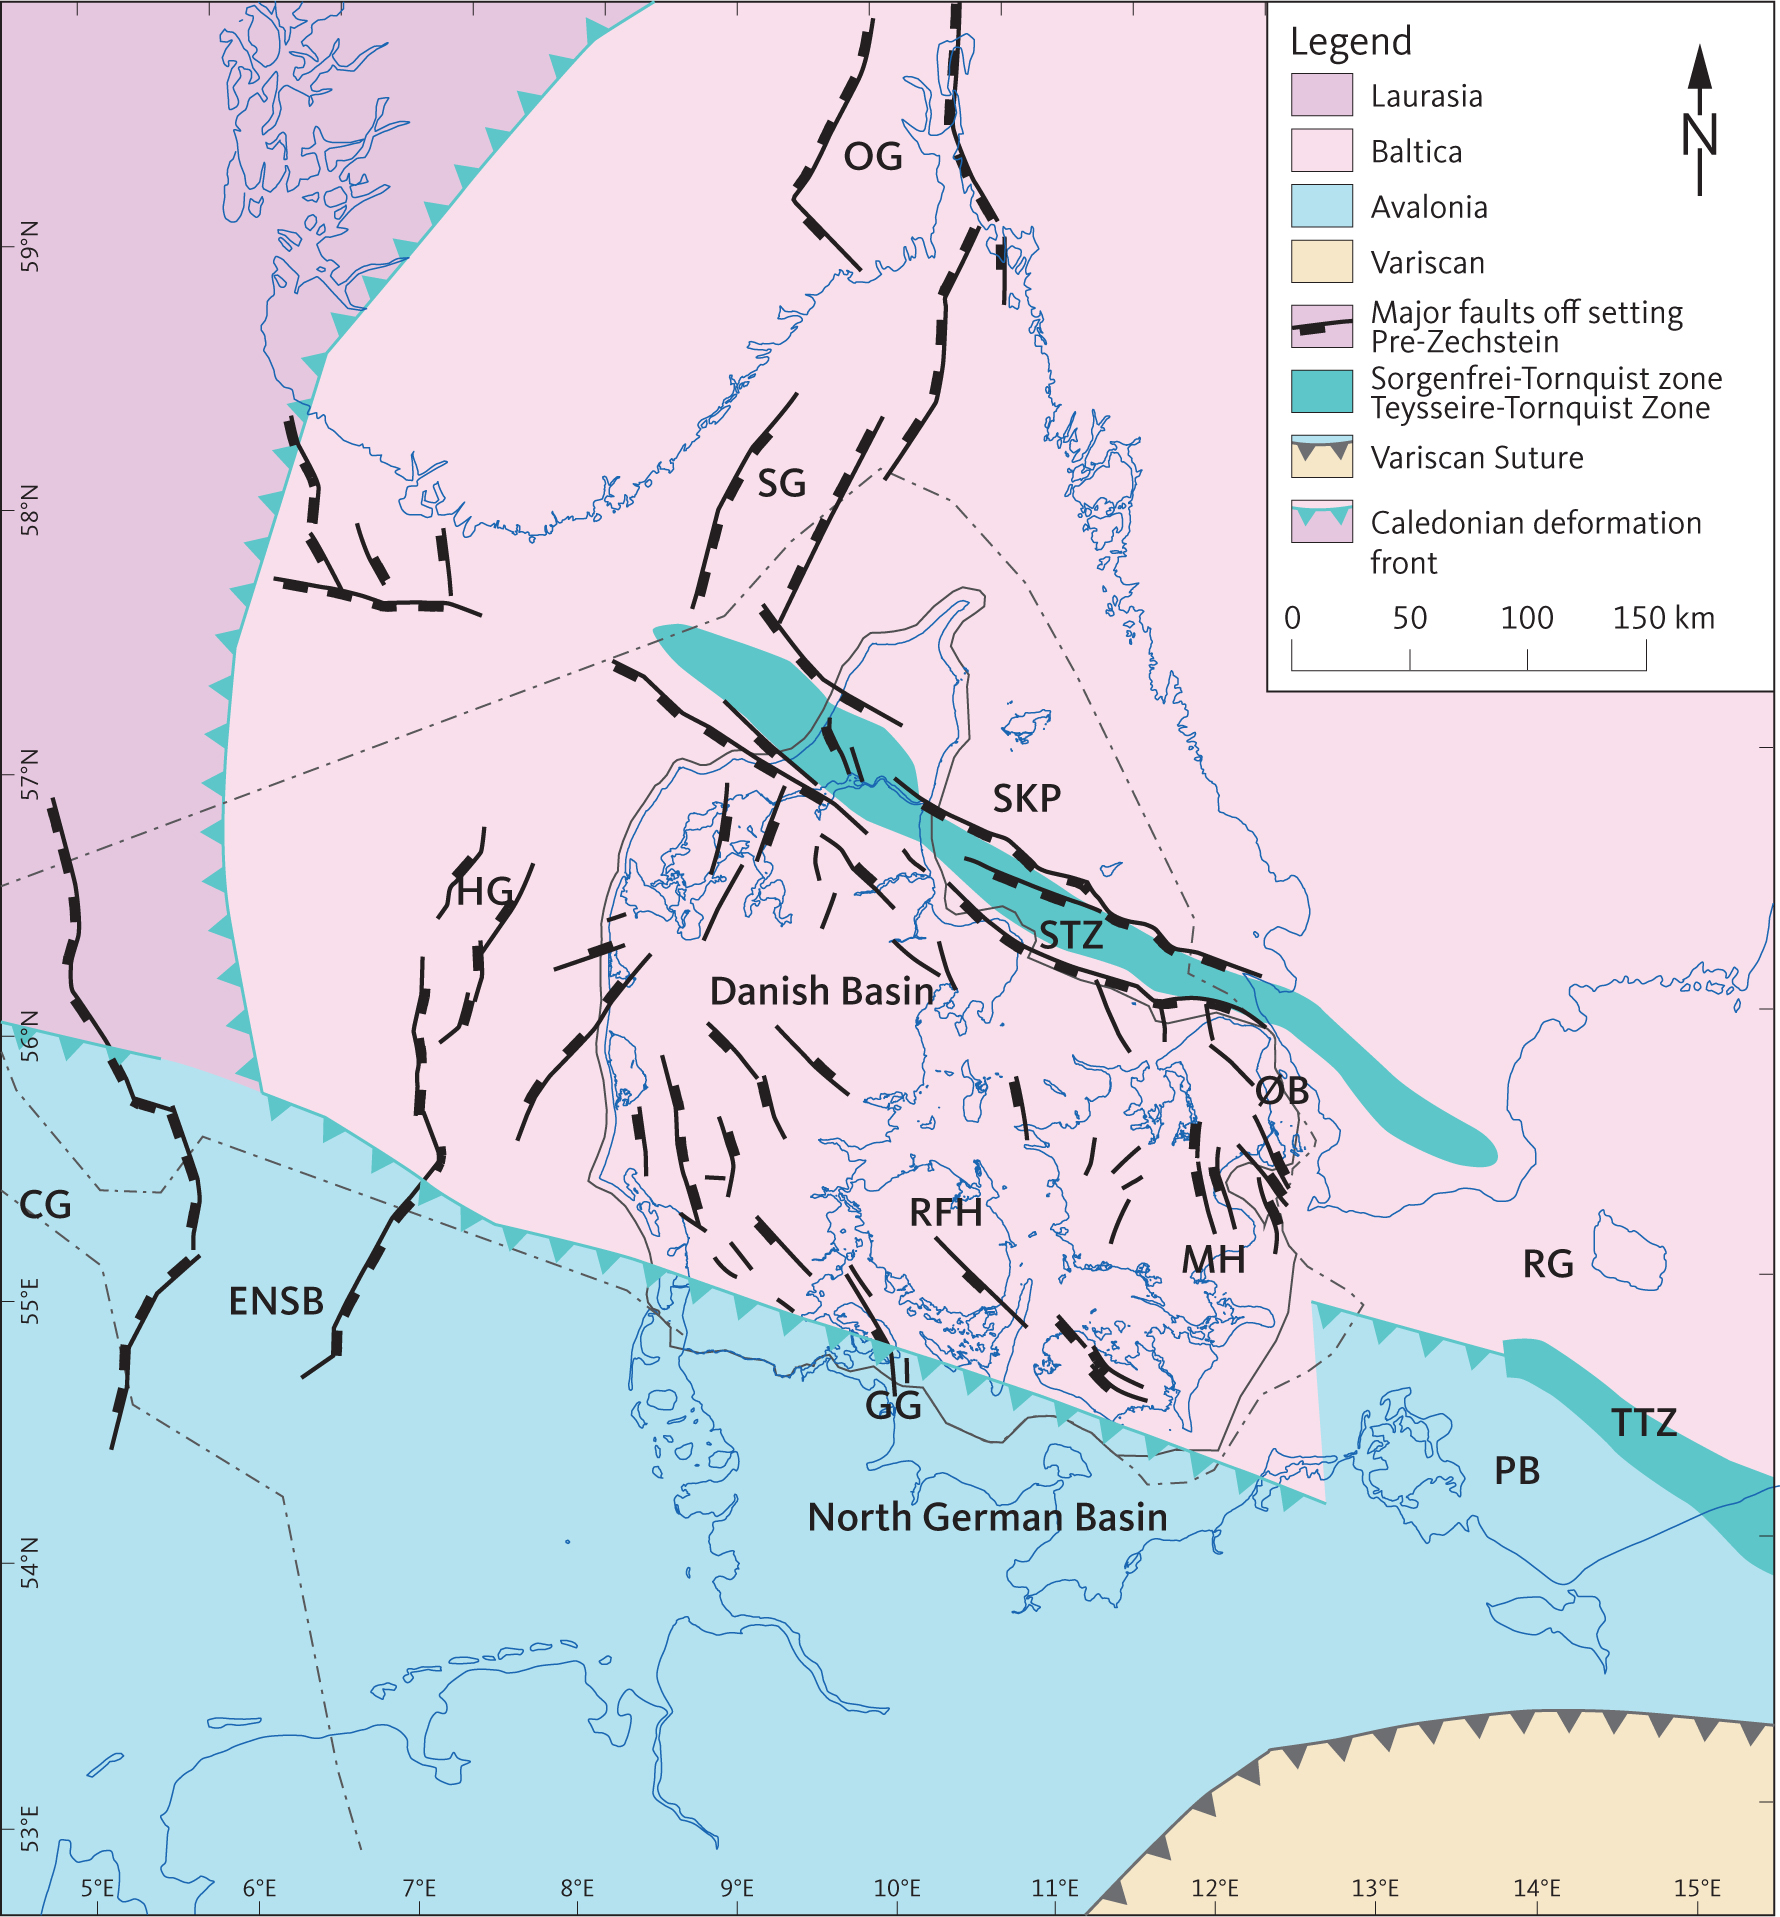
Fig. 1 Major tectonic terranes in the crust below the Central European Basin System. The WNW–ESE-trending Sorgenfrei–Tornquist Zone (STZ) and Teysseire–Tornquist Zone (TTZ) along the northern margin of have been active repeatedly since the Late Carboniferous. The East North Sea Block (ENSB), Ringkøbing–Fyn High (RFH) and the Møn High (MH) are aligned sub-parallel to these zones and separate the Danish Basin from the southern part of the basin system. The WNW–ESE-trending structural elements are cut by approximately N–S-trending basins: Oslo Graben (OG), Skagerrak Graben (SG), Horn Graben (HG), Central Graben (CG), Glückstadt Graben (GG), Øresund Basin (ØB) and Rønne Graben (RG) shown on the map (modified from Berthelsen 1998; Scheck-Wenderoth & Lamarche 2005; Pharaoh et al. 2010). The Skagerrak–Kattegat Platform (SKP) bounded by the Sorgenfrei–Tornquist Zone and the Skagerrak Graben constitutes the northern margin of the Danish Basin.
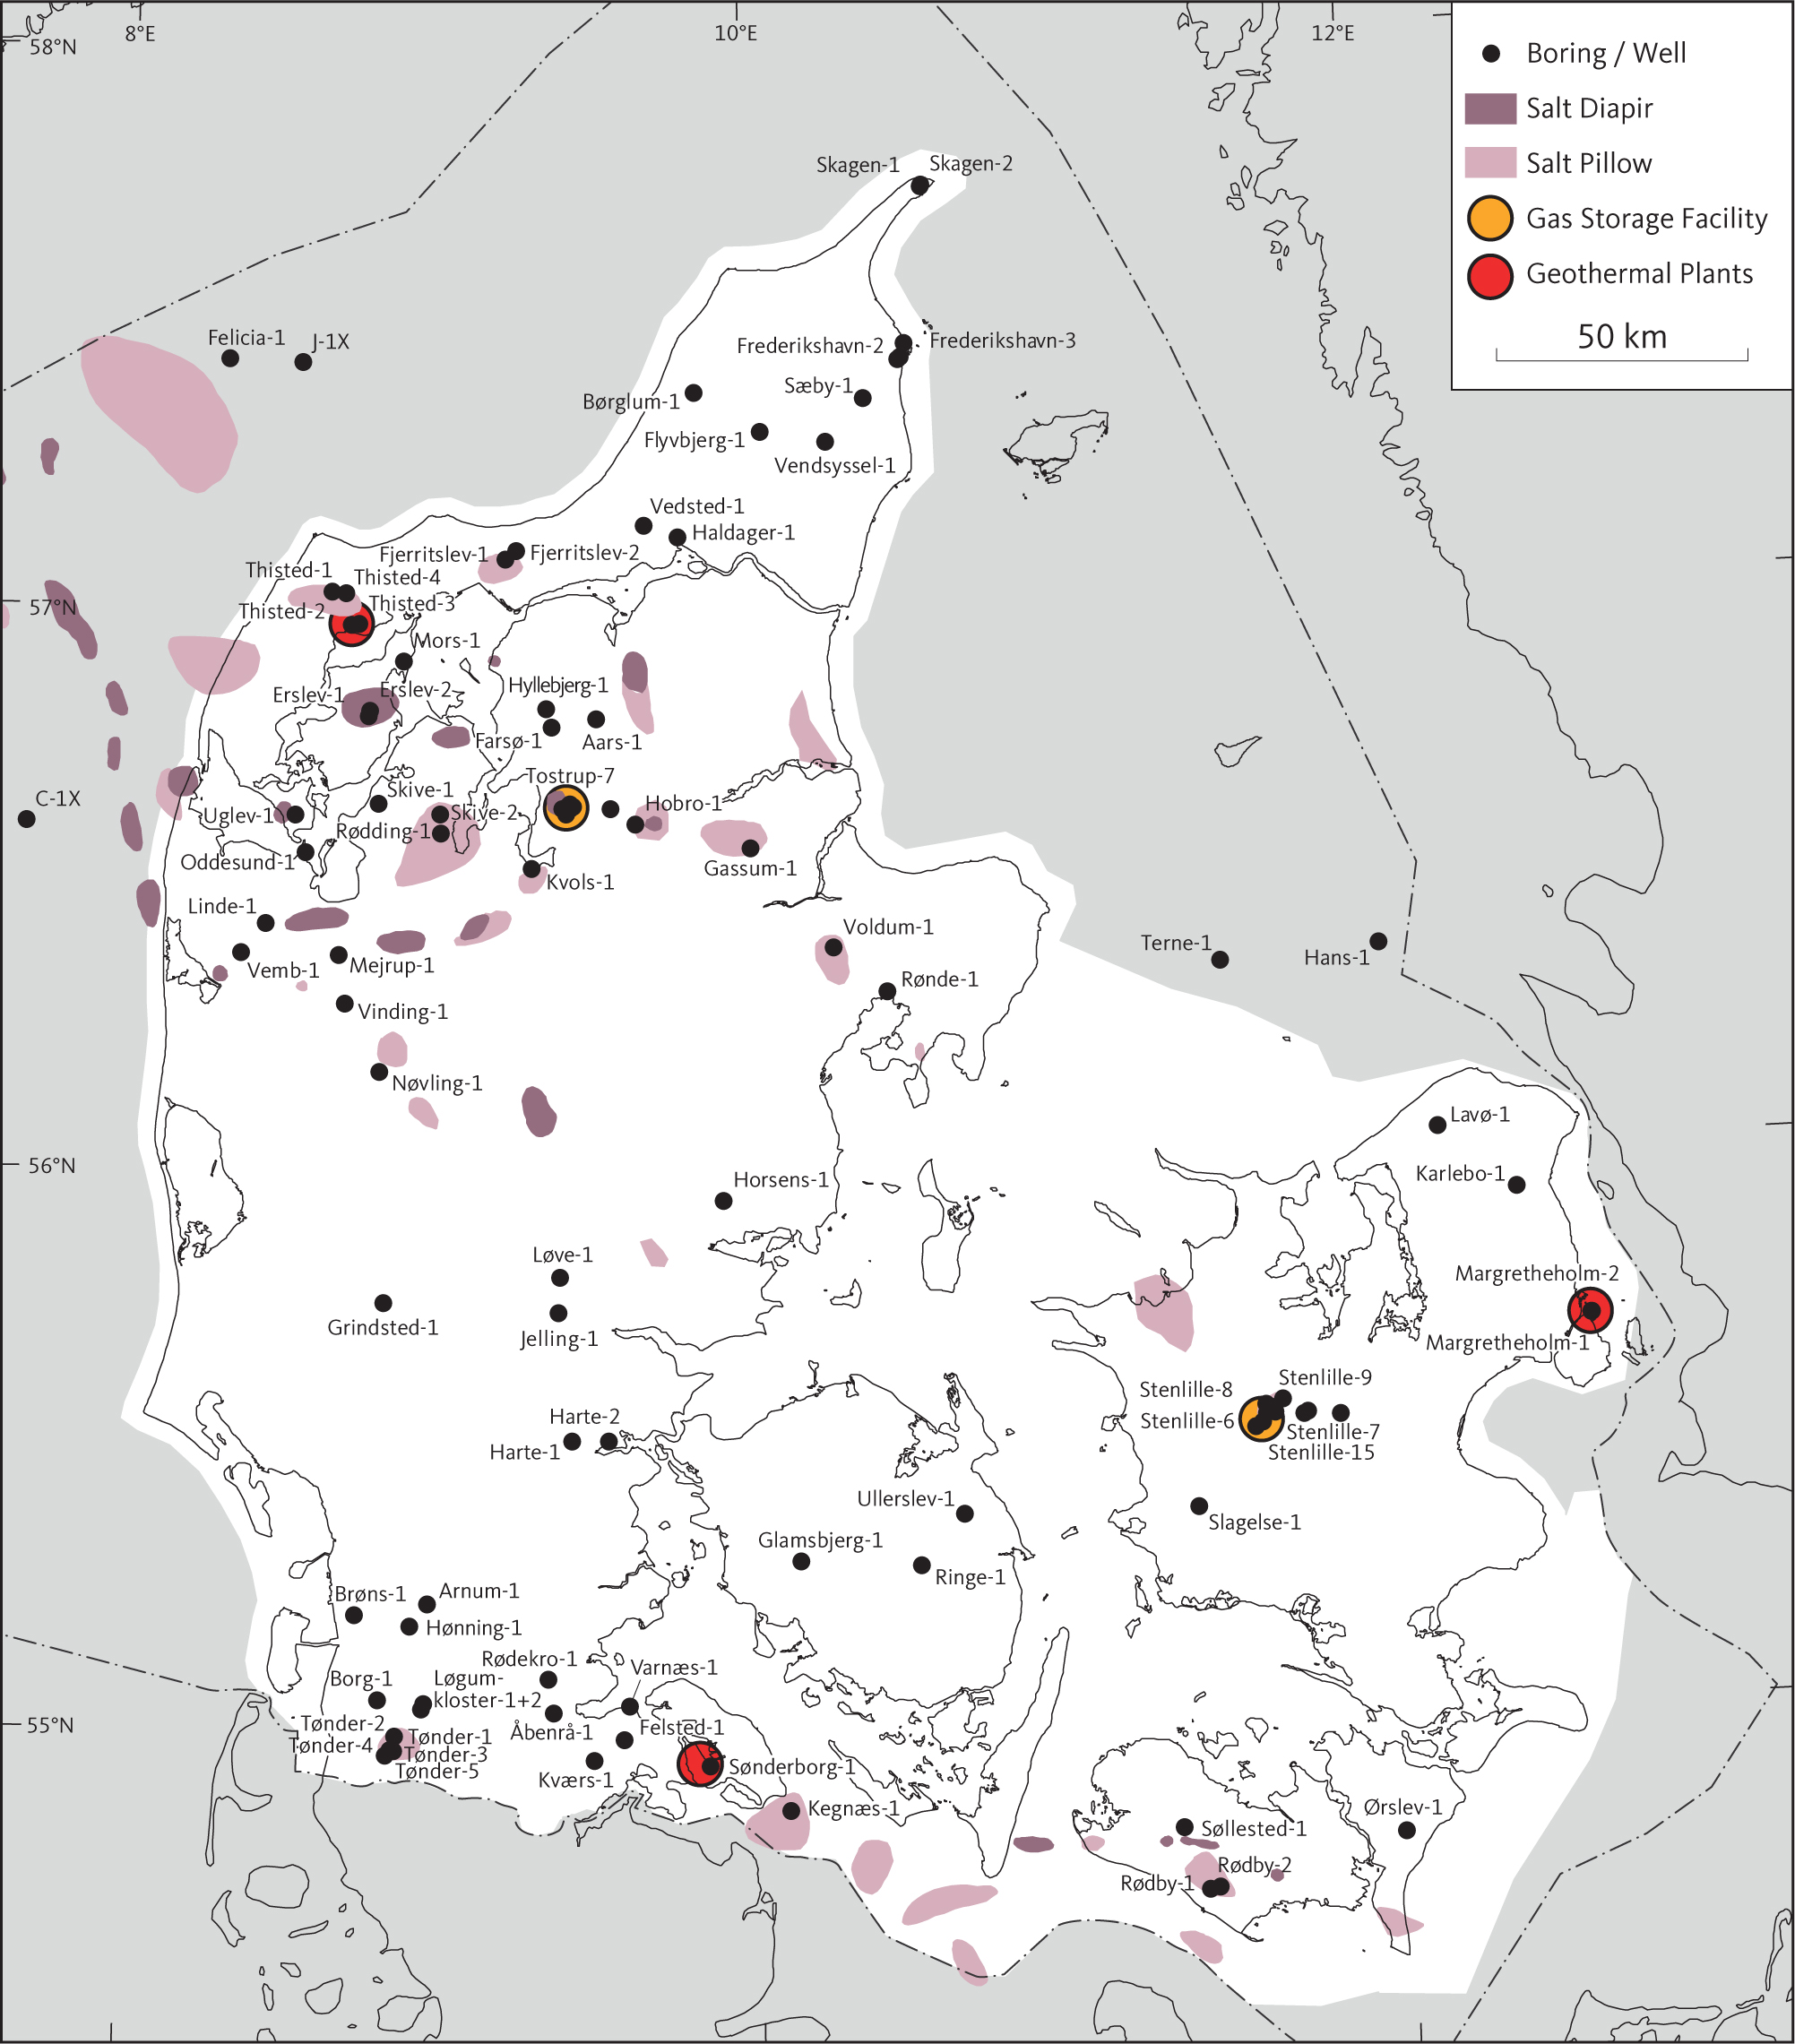
Fig. 2 Map showing location of geothermal sites and gas storage facilities. In addition, salt structures and wells are shown in the study area. The study area is shown as a white area.
The study is based on all reflection seismic data supplemented by wireline logs and lithologic information from all deep wells released prior to 2022. In addition, gravity data compiled as Bouguer and free air anomaly maps supplemented the seismic interpretation in locating, for example, salt structures and major faults. Twenty regional seismic horizons are interpreted and tied to lithostratigraphic boundaries documented in the deep wells by Nielsen & Japsen (1991). The result of the seismic mapping is a 16-layer digital elevation model, outlining the structural architecture of the study area. Seismic profiles document seismic reference sections illustrating the interpreted boundaries of the stratigraphic units with ties to wireline logs and several structural elements, some of which have been mentioned previously in the relevant literature. Eight selected cross-sections illustrating the regional structural pattern are included in Appendix 1.
For this study, it is crucial that the boundaries of the stratigraphic units are correlated correctly to the deep wells and interpreted consistently between the wells and in the parts of the study area where wells are absent. To this end, the boundaries of the units and their internal seismic facies are defined and documented. During conversion of the seismic interpretation in TWT sec to depths, the interpreted depth horizons are smoothed when needed to tie to stratigraphic picks in the wells. We hope that the outcome of the project will form the basis for future studies of the structural–stratigraphic evolution of the area as well as predicting depths and lithology in undrilled areas prior to costly deep exploration wells.
The depths and isochore maps showing the geographical distribution of the stratigraphic units form the basis for our interpretation of the structural evolution of the study area. The isochore maps reveal the variation in thickness of the stratigraphic units reflecting the spatial variation in accommodation space during deposition and, in some cases, preservation during subsequent erosion events. The maps establish an important foundation for future studies, adding to the understanding of the tectonostratigraphic evolution of the area. The isochore maps also support interpretation of the influence and development of deep-seated regional faults that are not directly observable in the Mesozoic succession as the ductile Zechstein evaporites dampen the response and disconnect the deep structures from the sedimentary section above the Zechstein. This is often testified by faults below the Zechstein that terminate upward in the Zechstein layer and by faults above the layer that detach towards the top of the Zechstein.
The tectonostratigraphical development of the study area is illustrated by maps and seismic cross-sections. The important tectonic episodes and halokinetic events that have contributed to the evolution of the area are identified and discussed. While previous studies have mainly focussed on various parts of the area or specific elements, this monograph presents a regional interpretation of the subsurface evolution in a consistent and detailed manner, leading to an improved understanding of the geological evolution of the area. The maps illustrating the distribution and depths of the identified stratigraphic units form a basis for further studies and for exploration and exploitation activities related to geothermal energy, storage of CO2, hydrogen, natural gas, radioactive waste and modelling of the subsurface and brine geochemistry.
1.2 Exploration and exploitation history
The deep subsurface onshore Denmark is a potential source of hydrocarbons and geothermal energy and also provides possibilities for temporary storage of surplus production of heat and gas, and storage of CO2 from industry. The tested hydrocarbon plays have been negative whereas natural gas is temporarily stored in reservoir sandstones of the Upper Triassic Gassum Formation in the Stenlille structure, central Sjælland, and in salt caverns in Lille Torup salt dome, Jylland (Fig. 2; Thomsen et al. 1987; Danish Energy Agency 1995; Petersen et al. 2008; Schovsbo et al. 2014, Schovsbo & Jacobsen 2019). Geothermal heat has been utilised from reservoir sandstones in the Gassum Formation in the geothermal plant at Thisted and was also explored in Sønderborg and from Lower Triassic reservoir sandstones in the Bunter Sandstone or Skagerrak Formation in Copenhagen (Fig. 2).
Most of the c. 80 deep exploration wells onshore and inshore Denmark have been drilled in the search for hydrocarbons and to a lesser degree for exploration of geothermal energy, while more than 30 wells have been drilled to develop gas-storage facilities and three geothermal plants. The many deep wells and associated pre-drill seismic data have provided valuable information about the Danish subsurface in the onshore and inshore areas. This study comprehensively compiles and integrates many seismic surveys, including digitalisation of old seismic paper profiles, which vary in age and quality, into a coherent seismic network. The array of deep wells intersecting this seismic network forms the basis for our interpretation of the seismic data and the construction of the maps presented here, showing the depth, thickness and lateral extent of the stratigraphic units, some of which contain significant sandstone reservoirs.
In recent years, there has been a particular focus on how to utilise the deep geothermal resources that are present in the Danish subsurface, and which may contribute to the Danish energy supply for district heating (Mathiesen et al. 2010; Weibel et al. 2020). Geothermal energy is a sustainable and environmentally friendly energy source, which may lead to a considerable reduction in the emission of greenhouse gases by replacing natural gas and biogas in the district heating system. Geothermal energy is sustainable, stable and independent of climate and seasonal variations, in contrast to wind and solar energy, and district heating distribution systems are already established and widely accepted in most cities and larger towns in Denmark. The absence of well-constrained subsurface models for successful well planning has been one of the primary obstacles to more intensive utilisation (Kristensen et al. 2016).
The only requirement for the accumulation and utilisation of geothermal energy in the subsurface is essentially the presence of a suitable reservoir buried deep enough to ensure sufficiently high temperatures of the geothermal water to be economically profitable in a district heating plant production. As a rule of thumb, the reservoirs should be present within the depth interval 800–3000 m. The temperature gradient of 25–30°C/km in the Danish subsurface implies that at depths shallower than 800 m, the temperature is generally too low, whereas at depths greater than 3000 m, diagenetic alternations related to high pressure and temperature conditions reduce the porosity and permeability of the reservoir sandstones (Kristensen et al. 2016; Vosgerau et al. 2016). The geological prerequisites for the utilisation of deep geothermal energy are fulfilled in large parts of Denmark as outlined on the map of the geothermal potential in Denmark which is accessible from the WebGIS portal (GEUS 2016). The maps available from the portal are constructed at GEUS based on the results from this study combined with reservoir data from the deep wells penetrating the reservoirs. The seismic depth maps can also be visualised through an interactive 3D viewer providing an intuitive overview of the subsurface topography of a selection of important horizons (Vosgerau et al. 2016).
Recently, investigations for permanent storage of CO2 have been initiated (Hjelm et al. 2022; Gregersen et al. 2025). Subsurface storage of CO2 commonly requires that a reservoir–seal pair is present in a closed structure (Frykman et al. 2009). Potential locations could be depleted oil/gas reservoirs found offshore in the Danish part of the North Sea Basin. Local subsurface structures such as those related to salt structures are found onshore Denmark and within the inshore area (Petersen et al. 2022; Weibel et al. 2023; Petersen et al. 2024; Gregersen et al. 2025). Most of these structures have not been of interest to hydrocarbon exploration or for geothermal energy. The maps presented here show closed structures within the Top Pre Zechstein to Chalk Group section that have not been included in previous assessments (e.g. Hjelm et al. 2022).
This study summarises and illustrates new findings regarding the structures and composition of the Danish onshore and inshore areas. The maps show the regional structural–stratigraphic architecture, although it is acknowledged that data is sparse or of poor quality in some areas, where only a limited picture of the subsurface can be attained. However, it is our hope that the maps can provide significant information for different types of exploitation of the subsurface, allowing those areas that appear most promising based on current knowledge to be identified. However, more comprehensive estimates of whether the subsurface meets the criteria for a given type of exploitation in a specific area of interest must of course be based on detailed analysis of local data and its incorporation with supplementary data to develop a robust local geological model.
1.3 Structural setting
In the Palaeozoic, the study area (Fig. 1) experienced the closing of the Thor Ocean during the Caledonian orogeny (e.g. Cocks & Fortey 1982; Berthelsen 1998), the far-field effects of the Variscan orogeny and Late Carboniferous – earliest Permian rifting. This rift event and associated uplift and erosion was linked to mantle plume activity represented by the Skagerrak Centred Large Igneous Province (SCLIP) and created the top pre-Zechstein horizon (e.g. Sørensen 1986; Liboriussen et al. 1987; Ziegler 1988; Michelsen & Nielsen 1993; Heeremans & Faleide 2004; Torsvik et al. 2008). Late Cretaceous compression and several phases of basin inversion (e.g. Mogensen & Jensen 1994; Mogensen & Korstgård 2003; Kamla et al. 2014) were followed by Cenozoic uplift (Fig. 1), and regression (Japsen 1992, 1993, 2018; Rasmussen 2017).
1.3.1 Structural elements
Since the termination of the Devonian–Carboniferous Variscan Orogeny, the Danish Basin has experienced a geological evolution similar to that of the North German and Polish basins. Therefore, some authors have considered these basins to be part of a single basin system, the Central European Basin System (Scheck-Wenderoth & Lamarche 2005). The Central European Basin System is described as an area composed of sedimentary basins initiated after the Variscan orogeny south and south-east of the Tornquist Zone (e.g. Scheck-Wenderoth & Lamarche 2005; Maystrenko et al. 2008). It extends across Poland, northern Germany, Denmark and the Netherlands into the southern North Sea (Fig. 1). In the context of this study, the Danish Basin is considered to extend to the NE across both the Sorgenfrei–Tornquist Zone and the Skagerrak–Kattegat Platform in accordance with Bertelsen (1978, 1980) and Nielsen (2003). Figure 3 shows the major geological structures as interpreted in the present study based on the available reflection seismic data supplemented by the Bouguer gravity anomaly map covering Jylland and Fyn (Petersen 1983). Maps showing more details of the fault pattern are presented by Vejbæk (1997) and Nielsen (2003).
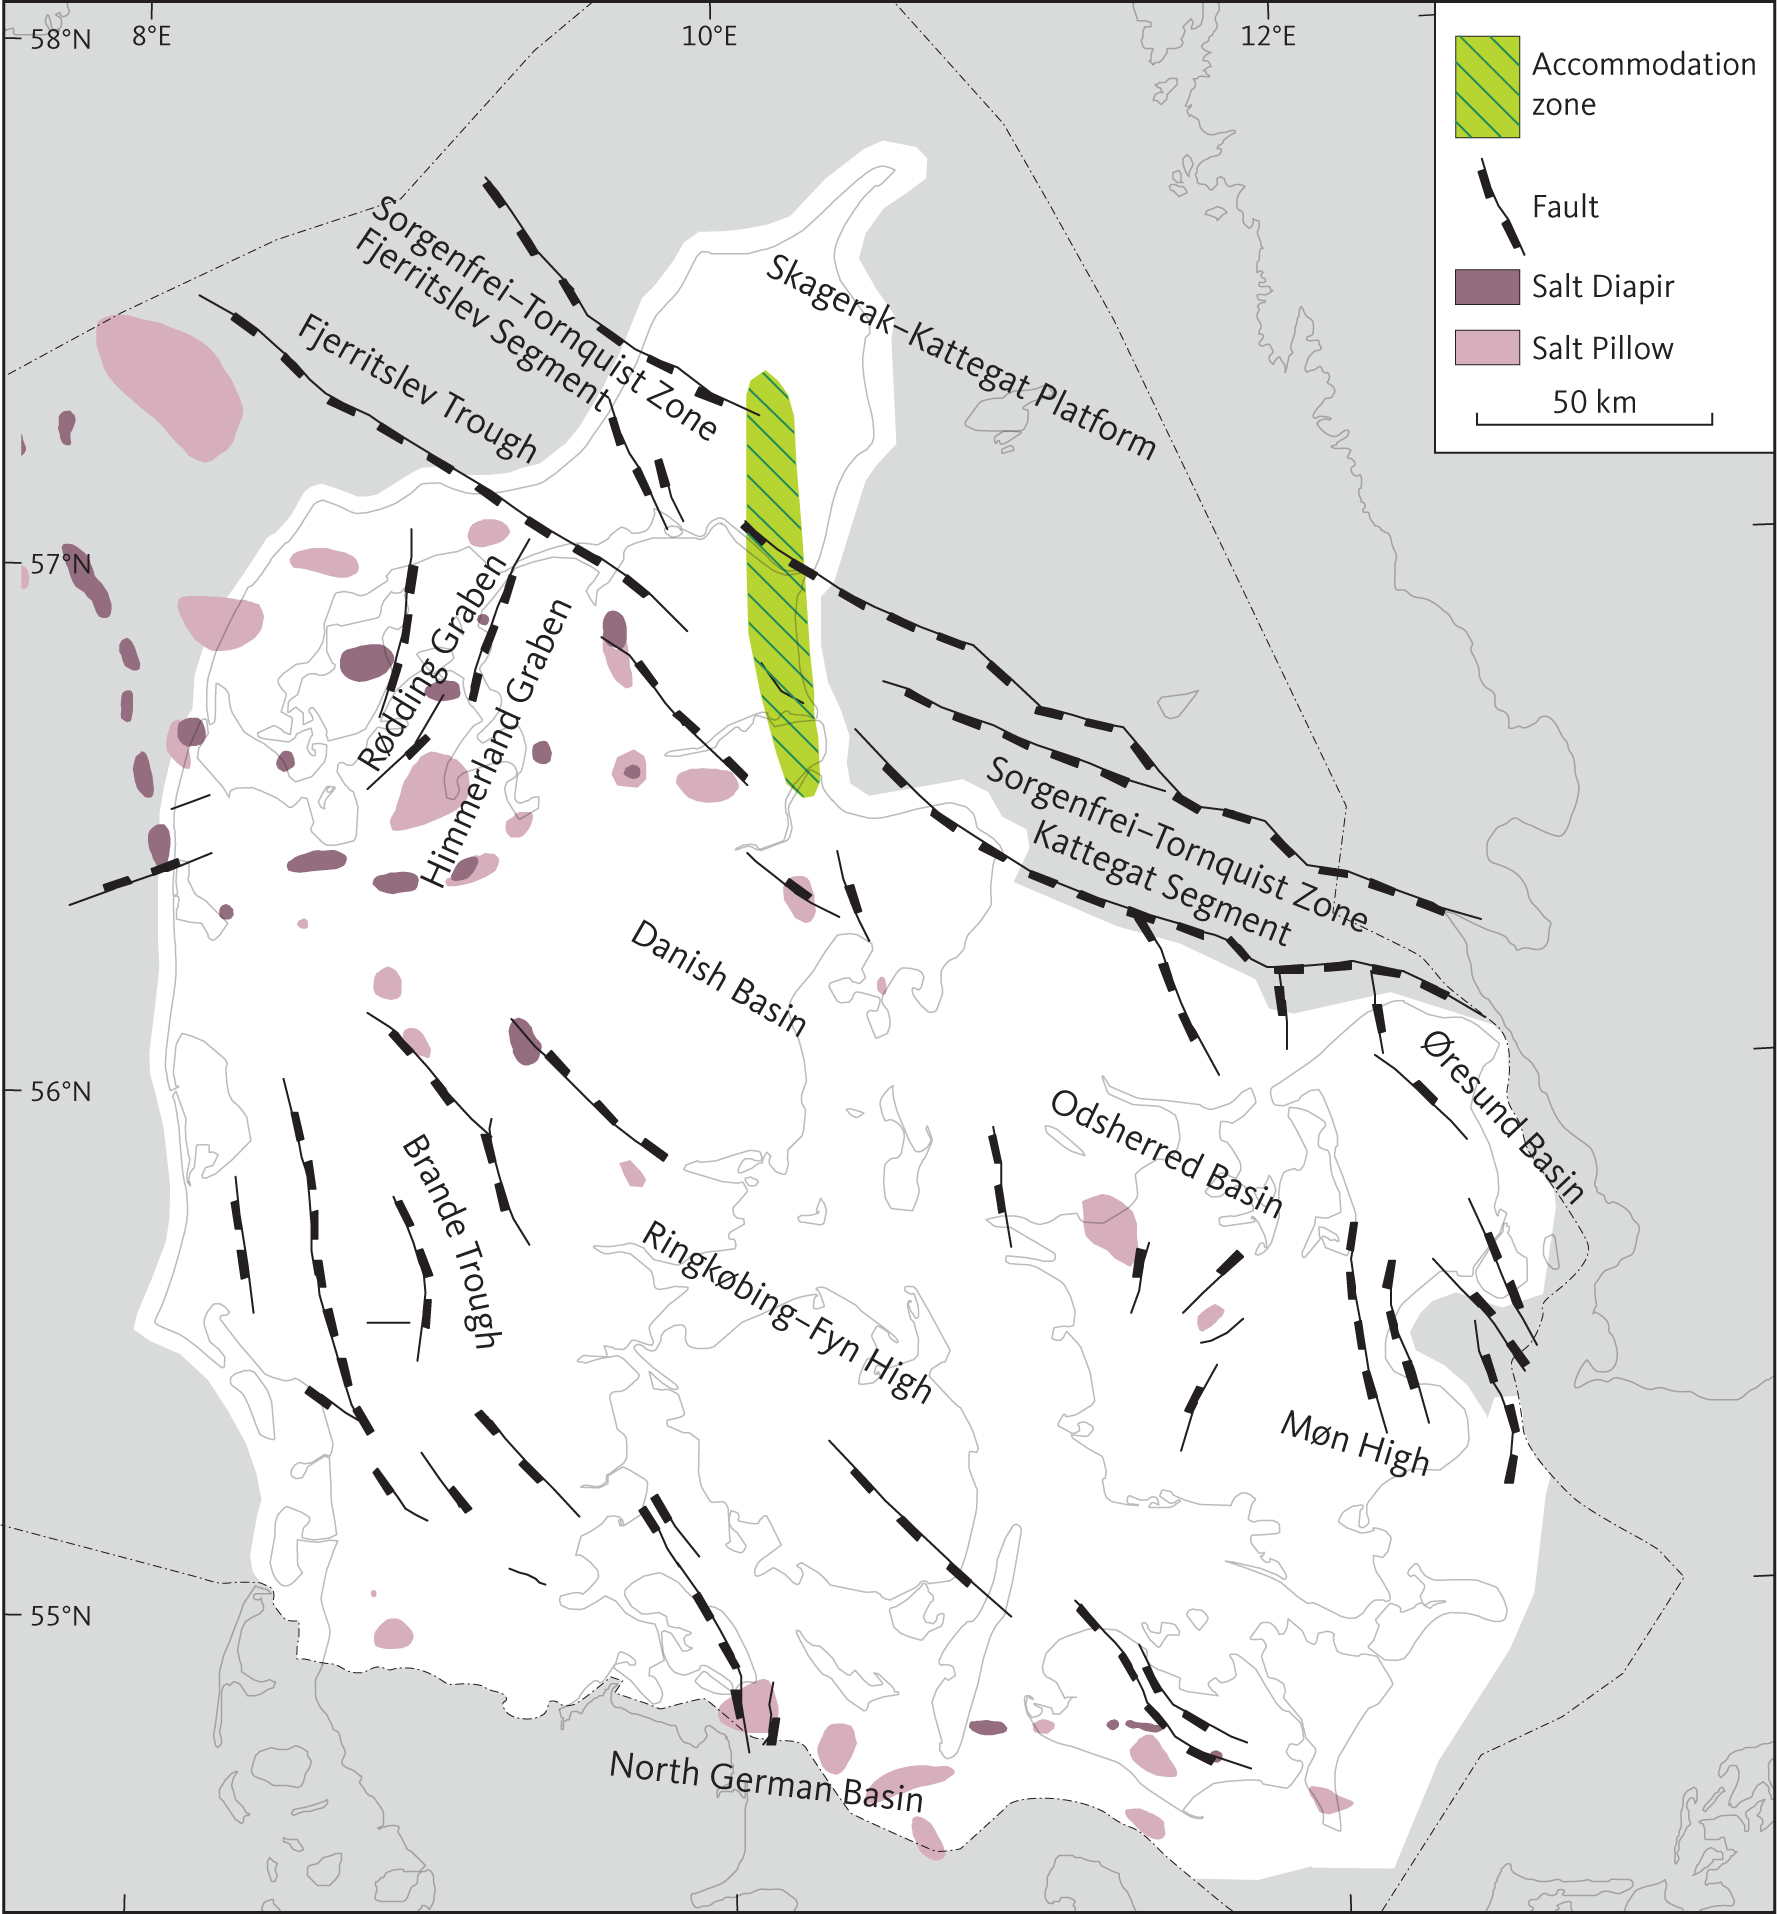
Fig. 3 Mapped major structural elements within the study area based on the present study. Major faults at the top pre-Zechstein surface. Salt structures mapped in the study area show the relation to the major structural elements, i.e. faults. For more detailed maps showing additional faults at the top pre-Zechstein surface, see Vejbæk (1997) and Nielsen (2003). Fig. 3 was combined with maps by Vejbæk (1997) and Nielsen (2003) to reach the conclusion that most salt structures in the study area are related to faults at the top pre-Zechstein surface. The Sorgenfrei–Tornquist Zone Kattegat Segment is bounded to the south by the Grenå-Helsingborg Fault (e.g. Kamla et al. 2014).
The north-western part of the Tornquist Zone, the Sorgenfrei–Tornquist Zone, extends across the northern part of the study area and has been active through Mesozoic and Cenozoic times (e.g. Vejbæk 1990; Mogensen 1994; Mogensen & Jensen 1994; Vejbæk 1997; Mogensen & Korstgård 2003). It is characterised by pronounced crustal changes across the zone (e.g. Berthelsen 1988; Thybo et al. 1999) and its origin and early structural evolution are ambiguous (e.g. Strömberg 1976; Berthelsen 1998). South-west of the Sorgenfrei–Tornquist Zone, the crust is thinner than the normal crust of the Baltic Shield north-east of the Tornquist Zone (e.g. Thybo 2001).
Complex fault zones sub-parallel to the Sorgenfrei–Tornquist Zone cut through the Mesozoic and Cenozoic succession and into the basement and are apparently closely related to a series of highs located along an ESE–WNW trend separating the Danish Basin from the North German Basin, the Mid North Sea High, the Ringkøbing–Fyn High and the Møn High (Fig. 3; e.g. Thybo 1997). The crust below these highs is consistently thicker than that below the basins to the north and south (Thybo 1997).
Approximately N–S-trending basin-bounding faults outline smaller basins within the Danish Basin (notably the Rødding Graben, the Himmerland Graben, the Odsherred Basin, the Øresund Basin and the Brande Trough; Fig. 3).
Widespread halokinesis associated with the Zechstein Group evaporites has been reported from deeper parts of all the basins within the Central European Basin System and caused considerable local deformation (e.g. Jaritz 1987). Studies concerned with the development of salt structures in the study area have found that there is a correlation between the location of salt diapirs and the faults offsetting the Top pre-Zechstein surface, as the salt diapirs generally are located above or in the vicinity of such faults (e.g. Madirazza 1968, 1975, 1977, 1986; Boldreel 1985; Koyi & Petersen 1993). Similar observations also apply to most of the salt pillows in the study area. The location of salt structures in the Danish Basin along basement faults is thus an indication of syn-tectonic initiation of salt mobilisation.
2 Data and methods
2.1 Deep wells
Within the study area, 82 Danish released deep exploration wells were drilled in the period 1935–2010 (Fig. 4). Complete data sets (e.g. completion reports) from these wells have been made available for this study, as well as data from three more recent exploration wells (Kvols-2, Løve-1 and Vendsyssel-1) and from the many appraisal wells in the Stenlille area. Furthermore, data from seven Swedish wells were used in the mapping of the Øresund Basin (Erlström et al. 2018). Information, including location and final well reports on the Danish wells, can be found on GEUS’ homepage (GEUS 1981), and information on the Swedish wells is listed in Erlström et al. (2018). Most of the wells were drilled in connection with exploration for hydrocarbons. In the northern part of the North German Basin, the wells were mainly targeting the Zechstein interval (mainly zone Z2, Nielsen & Japsen 1991) which is also the interval of interest in North Germany and Poland. Generally, the wells in the Danish Basin were targeting Upper Triassic or Jurassic sandstone reservoirs with some deeper exceptions (e.g. Felica-1, Hans-1, Nøvling-1, Rønde-1, Stenlille-19 and Terne-1). Wells drilled for deep geothermal heating purposes (Aars-1, Farsø-1, Kvols-2, Margretheholm 1–2, Sønderborg-1–2 and Thisted-2, -3 & -5) had Lower and Upper Triassic sandstone reservoirs as target. In the search for storage sites for natural gas, the Stenlille 1–19 and Tønder 1–4 wells were drilled targeting Lower and Upper Triassic sandstone reservoirs, respectively. In addition to the deep wells, several shallower wells have been drilled into the Zechstein salt on most salt diapirs (Sorgenfrei & Buch 1964).
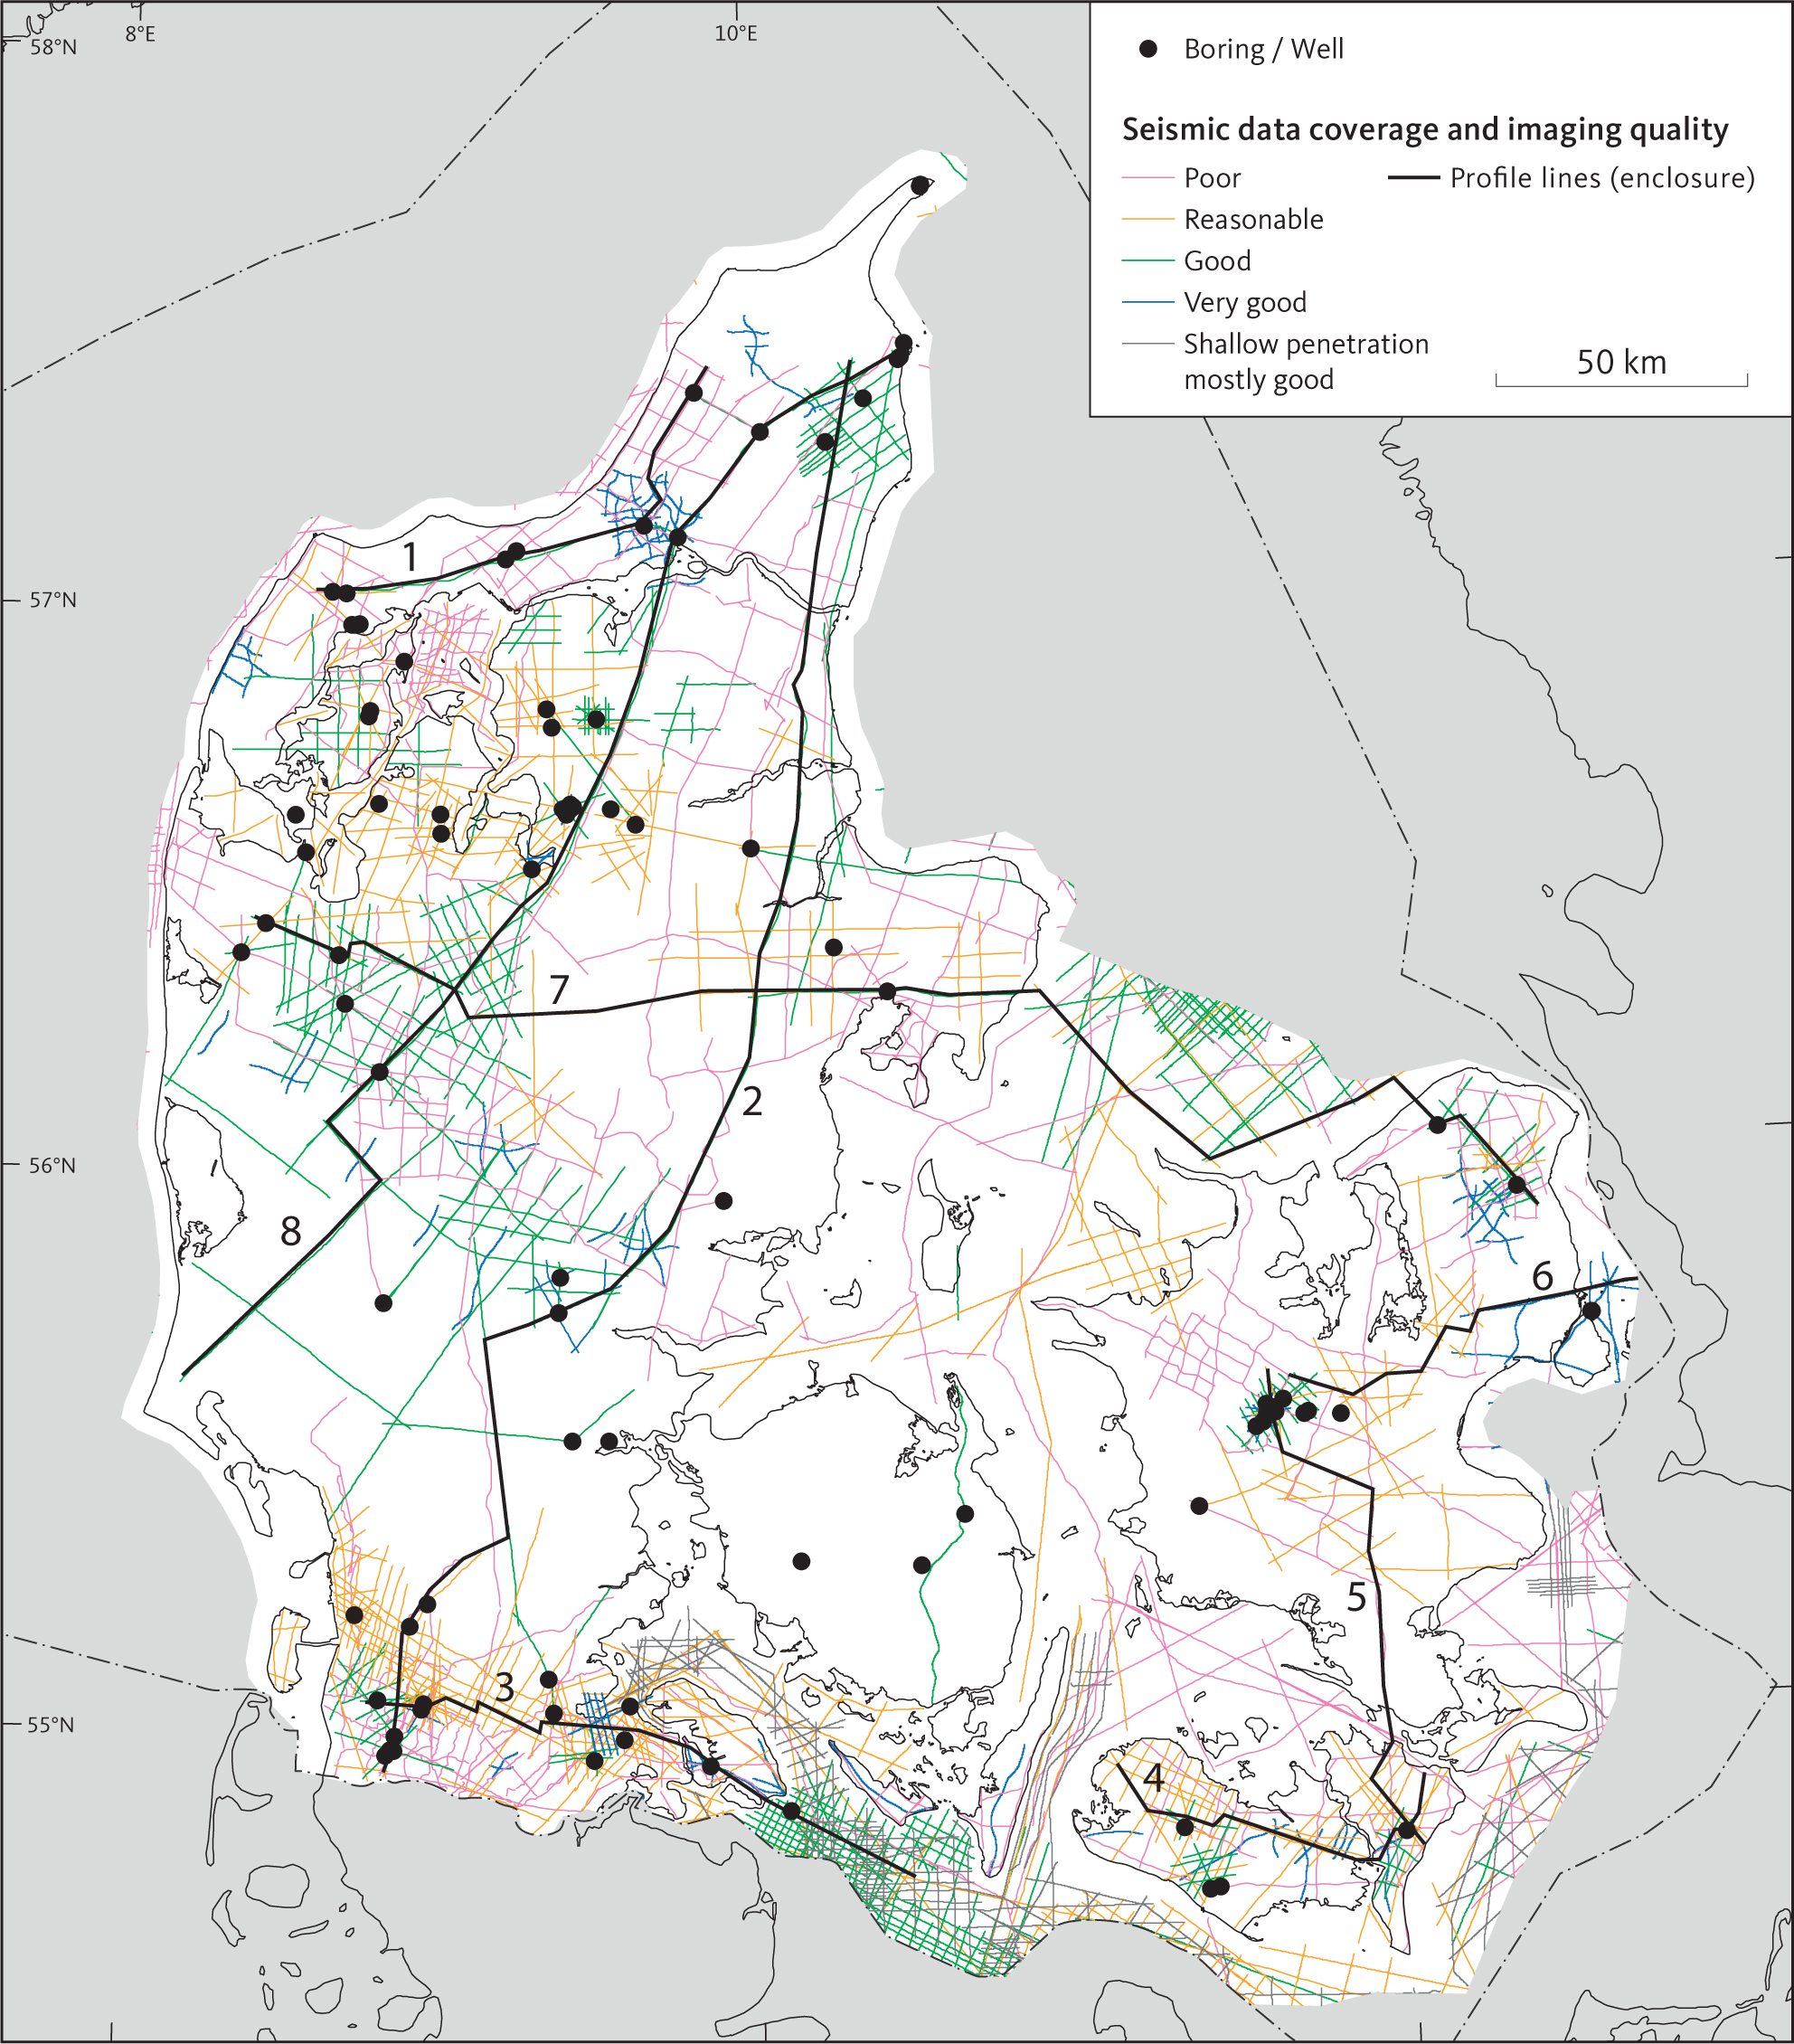
Fig. 4 Seismic data grouped according to imaging quality. The profiles are found in Appendix 1 and are constituted of combined seismic profiles. The wells used in the present study are marked by a black dot.
2.2 Wireline logs
A varied suite of wireline logs have been measured in all the deep wells within the study area and the results of these were used in this study (GEUS 2013). In the very early days of exploration using wireline logs, the logging suite consisted of calliper, SP (self-potential) and resistivity or induction logs, but later the number and sophistication of log types gradually increased to include sonic or acoustic, gamma-ray and spectral gamma-ray, density, photoelectric factor and neutron logs. Quality control of the wireline logs included checking for hole conditions and depth consistency between different runs in the same well section. When the same log had been run in different sections of the well, we carried out a simple merge for the present study. A conversion from depth data to two-way travel time was carried out to facilitate the correlation between wells and seismic data and the construction of synthetic seismograms. Selected logs are displayed on the seismic profiles shown in sections 4.1 to 4.7 of this study to facilitate the correlation between wells and seismic data and the construction of synthetic seismograms.
2.3 Seismic database
The reflection seismic database for the present study comprises of a large number of released surveys acquired in the period 1948–2011 with some additional surveys acquired since 2011 specifically released for this study. The locations of the seismic profiles and the wells are shown in Fig. 4, where the colour code for the seismic profiles indicates the vintage of the surveys (see Vosgerau et al. 2016). Information on the acquisition and processing concerning the surveys can be found at GEUS homepage (GEUS 2013). The seismic data were typically acquired by various commercial geophysical companies in relation to hydrocarbon exploration, deep geothermal heating and storage for natural gas; also utilised here is seismic data acquired for research by Aarhus University, Denmark and a cooperation between Aarhus University and Hamburg University. The data are almost entirely 2D data apart from two 3D surveys that were specifically acquired related to potential sites for storage of natural gas. The first seismic data for hydrocarbon exploration were acquired by dynamite with rather low fold and normal move out (NMO), and the processing of these data was extremely simple (GEUS 2013), whereas the recent data have been acquired digitally by using an array of vibrators and state-of-the-art processing. Data recorded in the early days, but also some later surveys, have been saved as paper versions only. In 2013, these paper versions were scanned into digital format at GEUS to facilitate loading onto workstation for the present study. The recording lengths of the seismic data are in accordance with the purpose of the surveys and are generally in the depth interval of 0–7 sec TWT. The offshore data acquired by Aarhus University using a Sleeve gun seismic array consist of high-resolution data with a recording length of 3 sec TWT. This is less than most of the seismic surveys used in this study but provides a higher resolution. Slight depth discrepancies and apparent phase shifts between seismic surveys turned out to be common. Mostly, these are assumed to be an effect of differences between acquisition and processing parameters for the various surveys which constitute the seismic database, and these discrepancies were corrected during the quality control process before finally being loaded onto a workstation.
2.4 Gravity data
An overview map of the free air gravity data of the study area produced by DTU Space was utilised in the study (Gabriel Strykowski, personal communication). The Bouguer residual gravity anomaly maps of Sorgenfrei & Buch (1964) and Petersen (1983) were used to reveal more detailed information of the subsurface. The Bouguer residual gravity anomaly map covering Jylland and Fyn (Petersen 1983) has been used to constrain the major faults, grabens and highs, the tectonic framework of Fyn and the delineations of larger salt structures. Overall, we found that there is a high level of correspondence between structures identified on the Bouguer gravity map and those interpreted on seismic profiles. The Bouguer residual gravity was additionally used for guidance in areas with very sparse seismic data.
2.5 Seismic interpretation
To achieve a detailed and consistent depth model of the study area, it was decided to interpret seismic units that tie to regional lithostratigraphic boundaries compiled by Nielsen & Japsen (1991). The correlation between the mapped seismic units and the lithostratigraphy is illustrated in Fig. 5. After tying all wells to the seismic profiles intersecting the wells, we interpreted the seismic profiles between them and subsequently carried out seismic grid interpretations. In some instances, lithostratigraphic boundaries could not be tied precisely from well to well by a seismic horizon. Mostly the mis-ties were small (less than 50 ms TWT) and considered a consequence of using a composite seismic database. The mis-ties were subsequently corrected in the gridding process when seismic times were converted to depth by smoothing the interpreted depth horizons to fit with the well picks. Some lithostratigraphic units have been characterised by time-transgressive tops or bases (e.g. the Gassum and Frederikshavn Formations; Michelsen et al. 2003; Nielsen 2003). The top of seismic unit E.2 corresponding to the Gassum Formation is represented by three surfaces that have been merged and the base by two merged surfaces, as illustrated in Fig. 5. This solution provides a consistent mapping of this important reservoir unit and reflects that the Gassum Formation was deposited as extensive sand sheets during several short-lived regressions (Nielsen 2003).
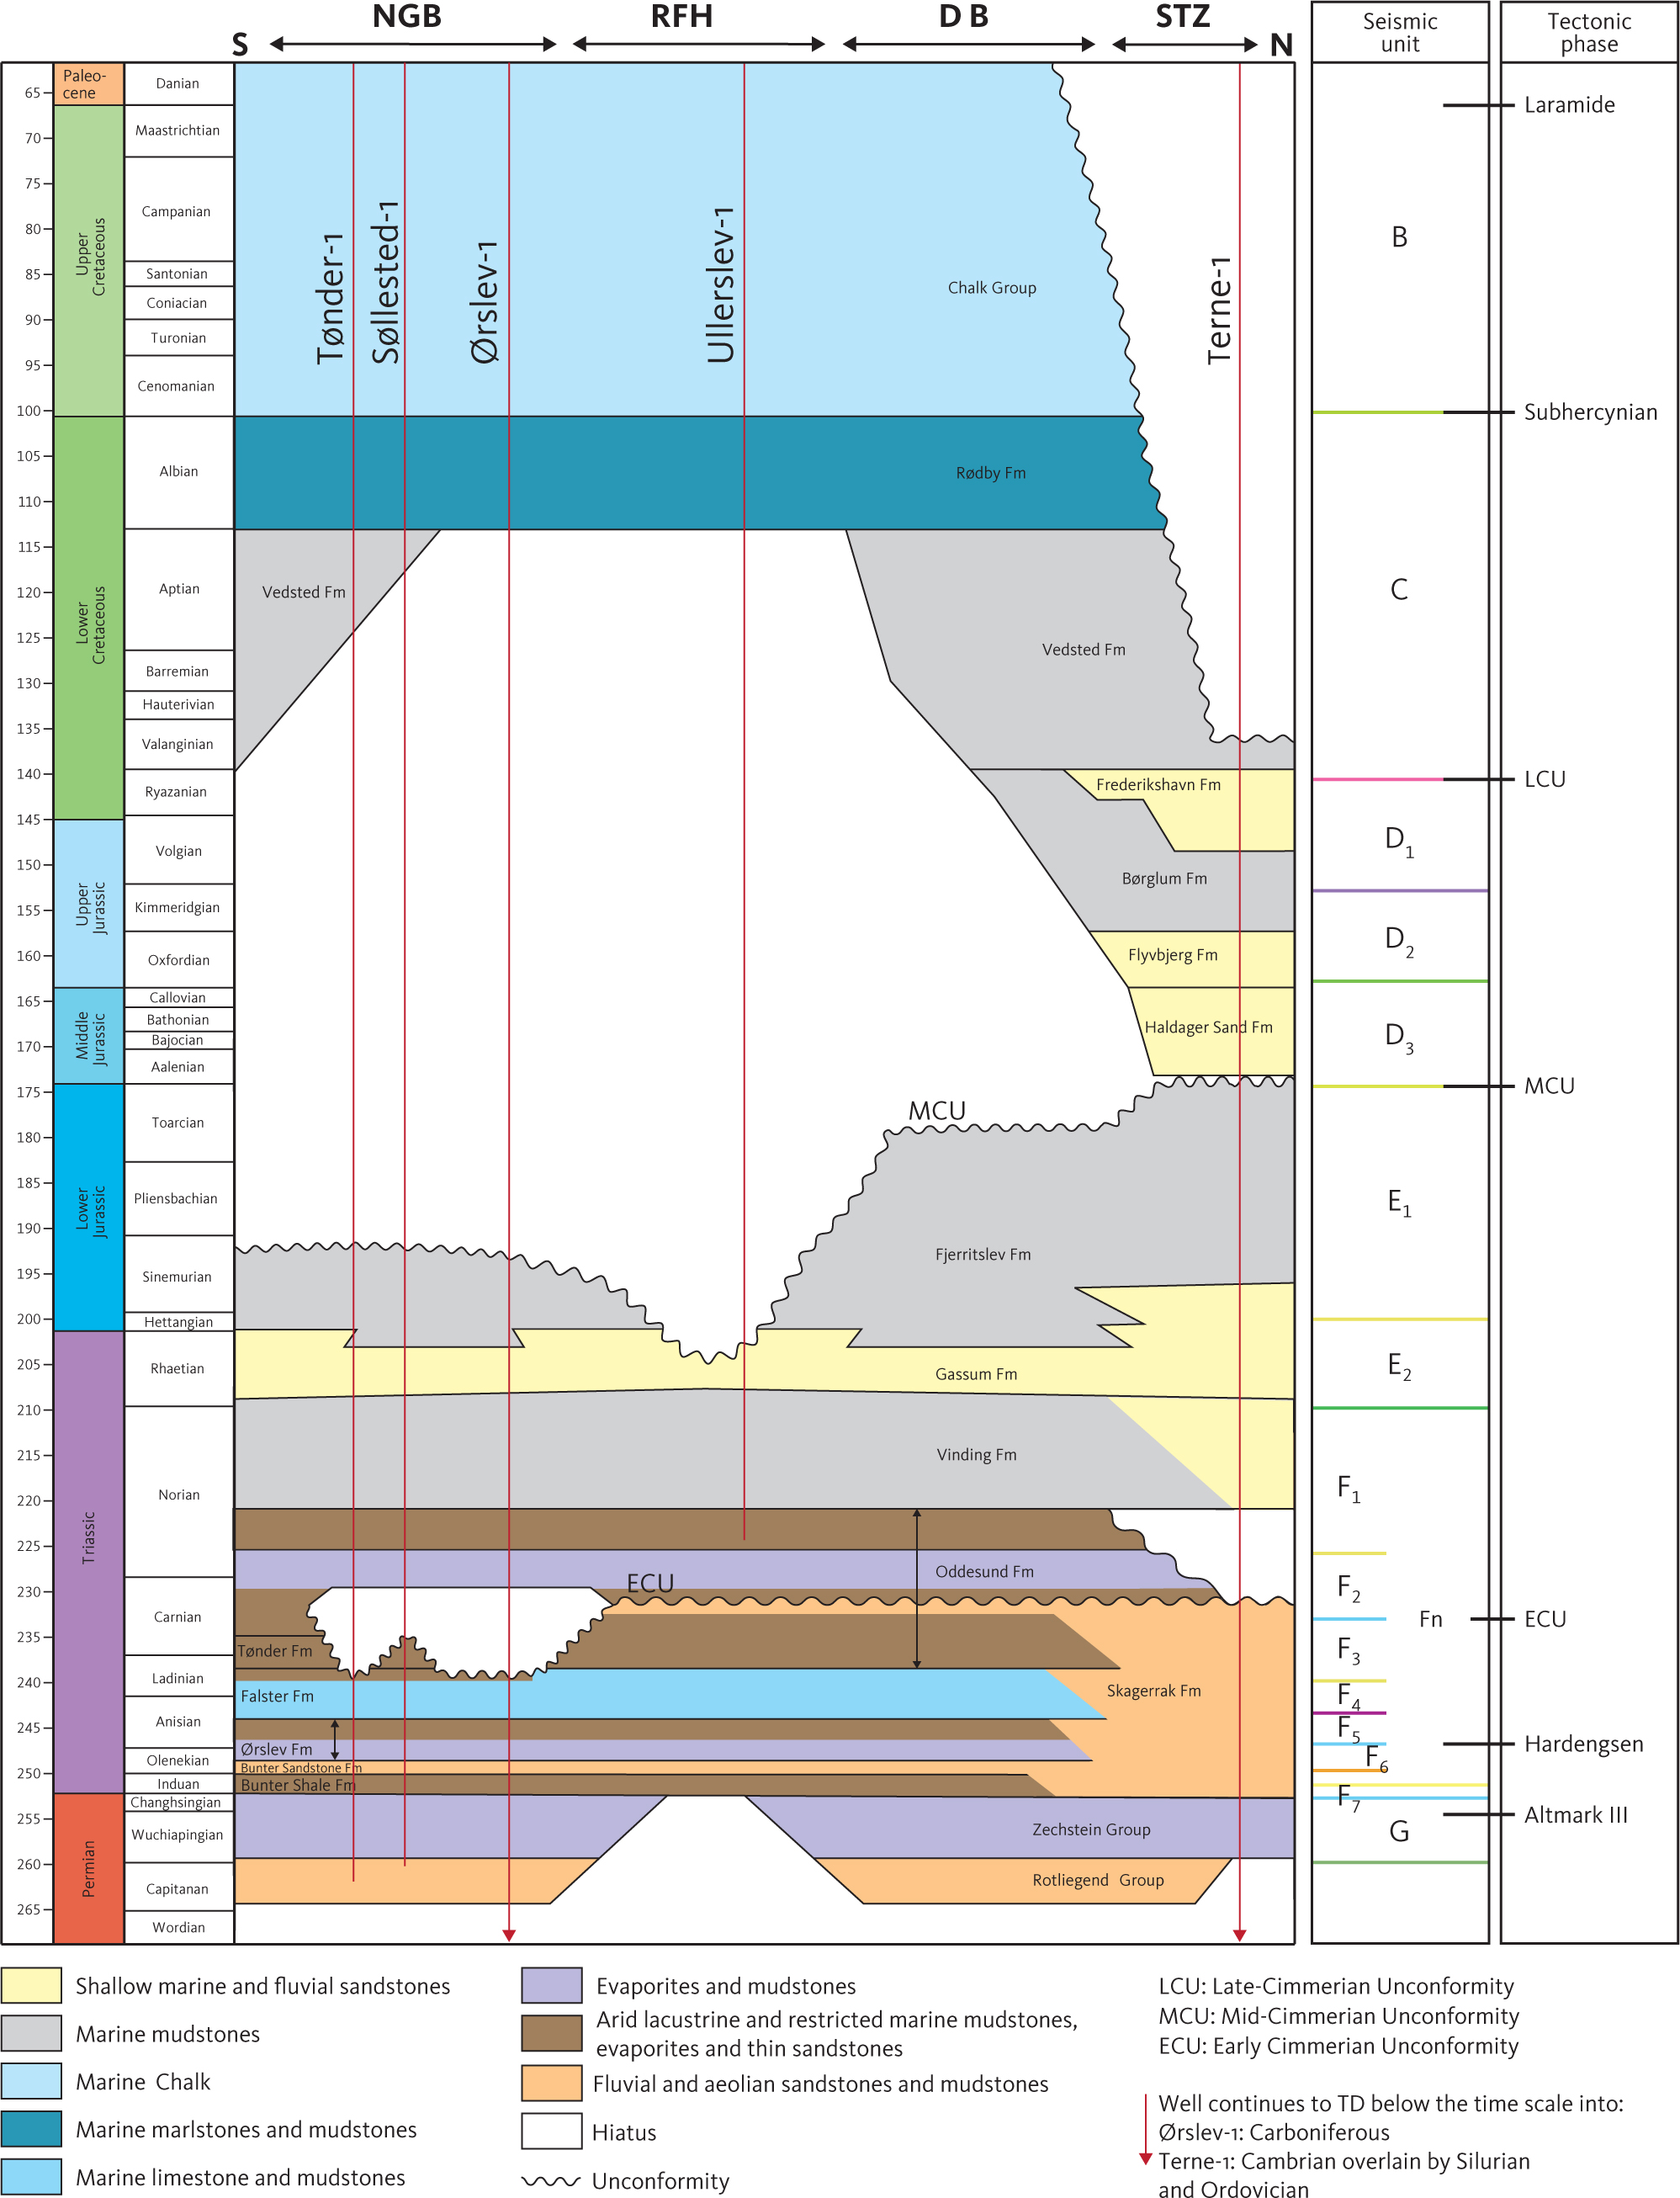
Fig. 5 Stratigraphic timetable, lithostratigraphic units and major unconformities in the study area and regional tectonic and thermal events. Regional events from Bachmann et al. (2008) and Torsvik et al. (2008).
Figure 6 shows overview maps with the location of seismic profiles where the individual units interpreted are marked by colours. Depth and isochore maps were produced for the seismic units, indicating wells reaching or penetrating the individual units. We checked the individual maps for artefacts by comparing them with the depth and thickness at all wells and comparing the TWT version of the maps with the interpreted seismic profiles; maps were imported as horizons on the seismic profiles to ensure that they corresponded to the interpretation of the particular profile.
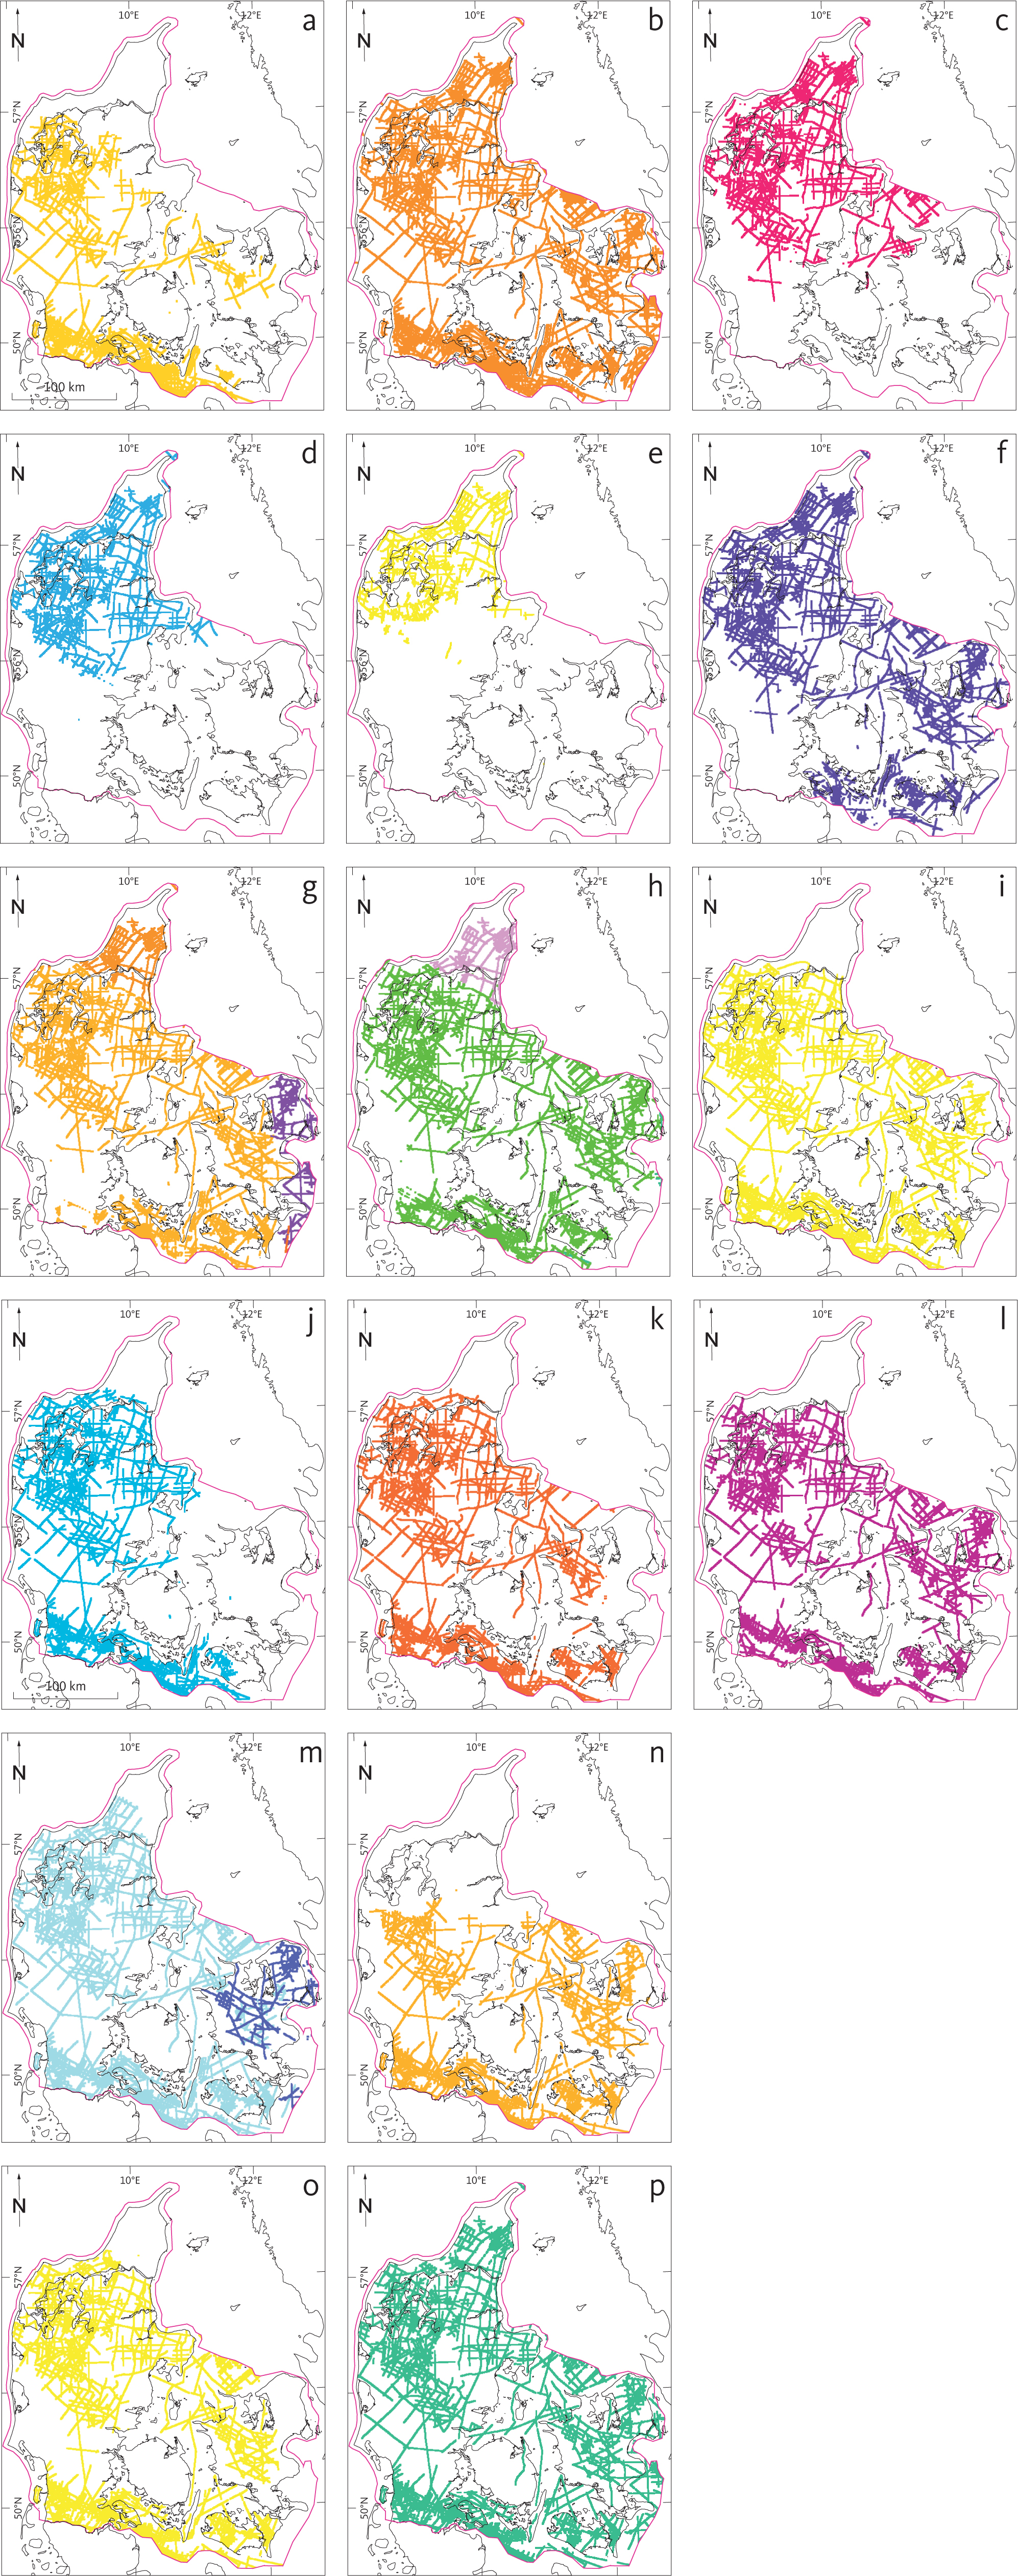
Fig. 6 Distribution of the investigated units within study area. Seismic interpretation of the units is shown as coloured lines. (a): Top Unit B (Chalk Group). (b): Top Unit C (Lower Cretaceous units). (c): Top Unit D1 (Frederikshavn Formation). (d): Top Unit D2 (Børglum and Flyvbjerg Formations). (e): Top Unit D3 (Haldager Sand Formation). (f): E1 (Fjerritslev Formation). (g): Unit E2 (Gassum Formation*). (h): Unit F1 (Vinding Formation shown as green and Skagerrak Formation shown as purple). (i): Unit F2 (Oddesund Formation). (j): Unit F3 (Tønder Formation). (k): Unit F4 (Falster Formation). (l): Unit F5 (Ørslev Formation). (m): Unit F6 (Bunter Sandstone Formation). (n): Unit F7 (Bunter Shale Formation). (o): Unit FN (Skagerrak Formation). (p): Unit G (Zechstein Group). * In the Skagerrak–Kattegat Platform and Sorgenfrei–Tornquist Zone, the seismic horizon representing the top of unit E2 (shown with a dark orange colour) ties approximately with the transgressive surface, TS11 of Nielsen (2003), in North German Basin. In most of the Danish Basin it ties approximately with TS9 (shown as a light orange colour) and in the Øresund Basin the top of unit E2 (shown as dark purple colour) ties approximately with TS15.
In places where Zechstein salt is absent, faults are seen to cut through the top Pre-Zechstein horizon and extend into the Mesozoic and Cenozoic succession. Changes of unit thickness across the faults were analysed to constrain timing and magnitude of faulting in the Pre-Zechstein succession. In areas where Zechstein salt is present, faults cutting through the Mesozoic and Cenozoic successions typically detach at the top of the Zechstein Group. Faults in this setting are to some extent connected with salt mobilisation and may be used to estimate the timing of faulting in the pre-Zechstein succession.
A number of salt diapirs occur in the study area, which complicates the structural–stratigraphic interpretation as mobilisation of the Zechstein salt has caused piercing, faulting and folding of the overlying post-Zechstein layers. This limits the seismic interpretation of the horizons towards and within areas affected by the salt mobilisation. In such areas, a diapiric signature is marked on the maps where interpretation of the horizons is impossible. The Top Zechstein Group horizon is difficult to follow in the areas affected by the mobilisation of the Zechstein layers, but in some areas, a number of shallow wells have been drilled into the Zechstein diapirs, constraining the depth to horizon in these locations.
On TWT seismic profiles, the reflection from the Top Pre-Zechstein horizon below salt structures may be seen as a dome, as the velocity of the salt is higher than the surrounding sediments (velocity pull up). This artefact has been corrected in the depth and isochore maps by depth conversion of the individual layers.
Regular grids, representing the interpreted (TWT) horizons listed in Table 1, are created by gridding in seismic interpretation software. The used algorithm is based on convergent interpolation modified to include fault data in the gridding and is considered suitable for gridding inhomogeneous data sets (Petrel® software). Geometry of the grids is given in Table 2. Overall, the raw TWT surface grids tie well to the corresponding stratigraphic markers in the boreholes. A final adjustment to the markers in each borehole was made in a zone tapering within 5000 m from the boreholes.
| Two-Way-Time Grids (s) Depth Grids (m) | |||||||
| Horizon | Top | Base | Top | Base | Isochore | ||
| Chalk Group | Top+Base | + | + | + | + | + | |
| Low. Cret. units | Top1 | m | m | + | + | + | |
| Frederikshavn Fm | Top | + | m | + | + | + | |
| Børglum Fm. | Top | + | |||||
| Flyvbjerg Fm. | Top | ||||||
| Haldager Sand Fm | Top | + | m | + | + | + | |
| Fjerritslev Fm | Top | + | m | + | + | + | |
| Fjerritslev F-II Mb | Top | ||||||
| Fjerritslev F-I Mb | Top | ||||||
| Gassum Fm1 | Top2 | m1 | m | +2 | + | +2 | |
| Skagerrak Fm3 | Top | + | m | + | + | + | |
| Vinding Fm4 | Top | + | m | + | + | + | |
| Oddesund Fm4 | Top5 | + | m | + | + | + | |
| Oddesund O2 Mb | |||||||
| Oddesund O1 Mb | |||||||
| Tønder Fm4, 6 | Top | + | m | ||||
| Falster Fm4 | Top5 | + | m | + | + | + | |
| Ørslev Fm4,3 | Top5 | + | m | + | + | + | |
| Bunter Sandstone Fm4,5,4 | Top4 | + | m | + | + | + | |
| Bunter Shale Fm3 | Top | + | m | + | + | + | |
| Zechstein Group | Top+Base | + | + | + | + | + | |
| Top Zechstein 2 | Top | ||||||
| TWT grids constructed by merging are indicated by letter ‘m’. ‘Low.’ is Lower; ‘Cret.’ is Cretaceous; ‘Fm’ is Formation; ‘Mb’ is Member. 1 The Gassum Formation is time-transgressive (e.g. Michelsen 1989; Nielsen 2003). In this study, the top of the formation is represented by three seismic horizons: Top Gassum – Sorgenfrei–Tornquist zone (in northern Jylland), Top Gassum – ØSB (in the Øresund Basin; equivalent to Top Karlebo Mb and Top Gassum – Danish Basin (in the rest of the Danish Basin and in the North German Basin). The base of the formation is equivalent to the Top Skagerrak seismic horizon in northern Jylland and Top Vinding seismic horizon throughout the Danish Basin and in the North German Basin. 2 The Skagerrak Formation is identified in the Sorgenfrei–Tornquist Zone and the Skagerrak–Kattegat Platform only. 3 The Vinding, Oddesund, Tønder, Falster, Ørslev, Bunter Sandstone and Bunter Shale Formations are identified in the Danish Basin and North German Basin. 4 A seismic horizon equivalent to the Bunter Sst. Fm. is interpreted in the Sorgenfrei–Tornquist Zone. 5 The boundary between the Tønder and Oddesund Formations is not well constrained (e.g. Clausen & Pedersen 1999; Michelsen & Clausen 2002). It is possible that the Top Tønder seismic horizon interpreted in the Danish Basin is somewhat different from that interpreted in the North German Basin. |
|||||||
| min. | max. | cell dims. | |
| x (easting) | 436000 | 738000 | 400 |
| y (northing) | 6040000 | 64083400 | 400 |
Based on available checkshot data from the Danish exploration boreholes in the study area, we constructed a regional multi-layer velocity model to convert the surface grids from the time domain (TWT) tied to boreholes and to the depth domain (m) using a simple velocity-depth relation:

Eq. 1 is a widely used linear velocity versus depth function in depth conversion workflows. The equation models how velocity increases with depth due to compaction, where ʋ is the velocity at depth z within a specific lithostratigraphic layer, ʋ0 is the velocity at the top of the interpreted seismic horizon at a given location, representing the starting or minimum velocity for that interval. ʋ0 is derived from well velocity log data and available quality controlled checkshot data specific to each lithostratigraphic interval and location. k is the velocity gradient, expressing how much the velocity increases per unit depth and is related to geological compaction and burial effects. z is the depth below a chosen datum. The datum is typically positive downward, i.e. z increases with depth, and the datum reference here is the mean sea level. Petrel® supports depth conversion using the velocity function in Eq. 1, but uses a negative k due to Petrel® depth conversion. Assigning the interpreted lithostratigraphic horizons, the ʋ0 and k parameters for each model layer were based on checkshot and well data. Input ʋ0 and k values at each relevant XY location were picked directly from well data or calculated grid surfaces. After selecting the appropriate time maps (gridded TWT surfaces), the velocity model was constructed and quality checked by comparing the depth-converted surfaces with the well tops. Initially a simple 1D velocity model composed of five layers was made using checkshot data from 42 boreholes distributed fairly evenly throughout the study area (Fig. 7). In the depth range represented by the data points, this model provides a reasonable fit to the checkshot data. This velocity model was further refined by generating functions with spatially varying ʋ0 values and constant values of k (Table 3). The Petrel® advanced velocity modelling workflow was used to generate the final digital 3D elevation model. Without applying correction, the average depth residual was in the order of approximately 50 m. However, in the final velocity model, well tops were used as a correction to improve depth-converted horizons by adjusting/trimming/smoothing the velocities. This depth conversion workflow gives geologically reasonable, data-calibrated regional depth surfaces based on the seismic gridded time horizons given in Table 1.
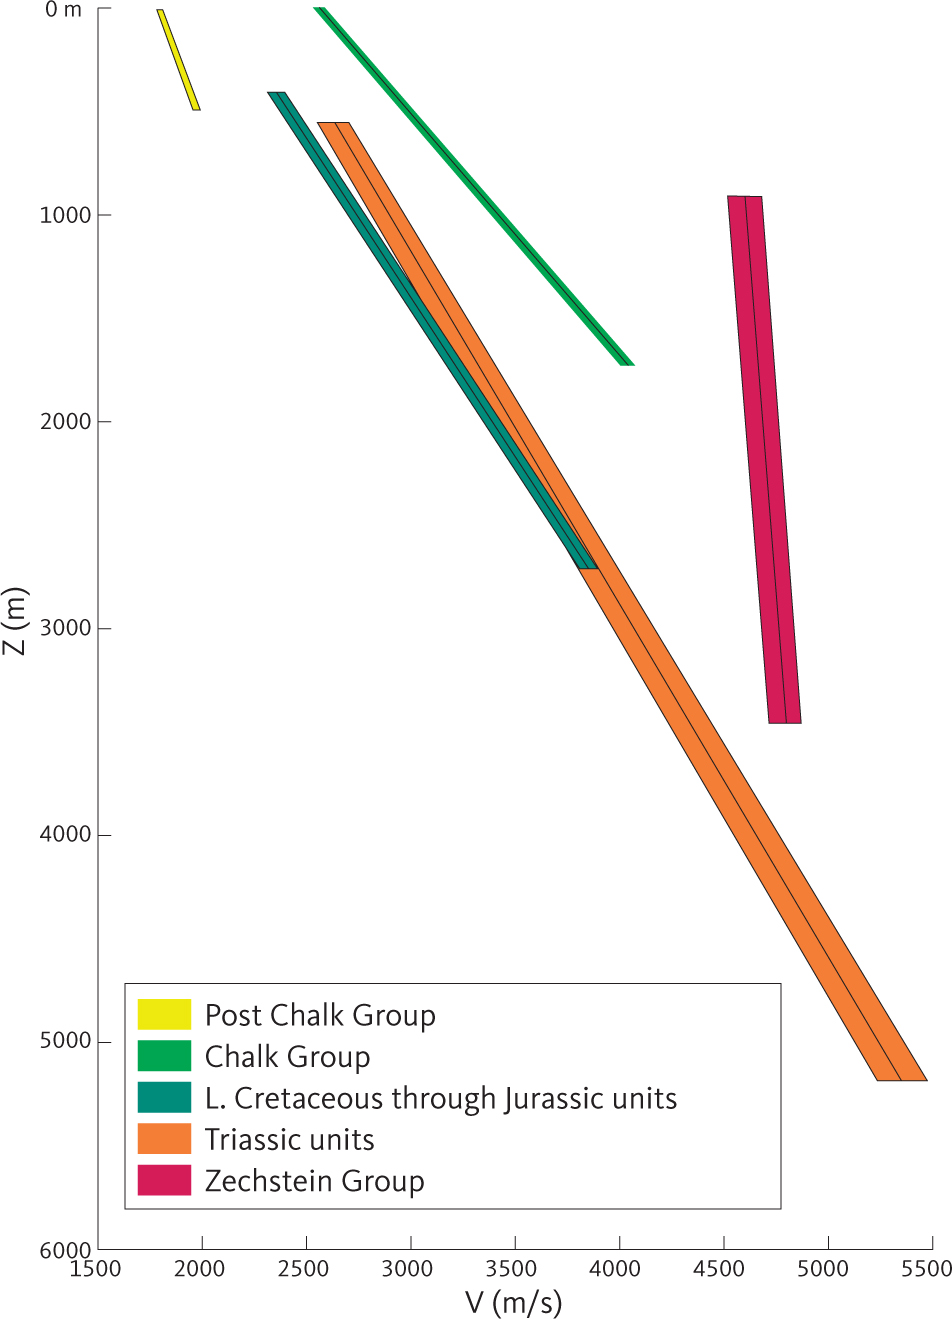
Fig. 7 Estimated simple 1D instantaneous velocity functions of the Permian, Mesozoic and Cenozoic units within the Danish area. The functions are based on well-velocity surveys illustrating that data availability limits the depth range for the various units. For each unit, 3 standard deviation error estimates are shown as zones around a black centre line used as a mean velocity. Intercept velocity and the velocity gradient are both functions of lithology and compression/burial (e.g. Japsen 1993; Japsen et al. 2007, 2016); the narrow velocity range in the Zechstein Group reflects that this group is dominated by massive evaporites with low compressibility. Z: Depth below sea level measured in m. V: Seismic (P wave) velocity measured in m/s based on well information.
| Horizon surface | K coefficient | Velocity function |
| Top Chalk | –0.36 | Post Chalk Group |
| Top Lower Cretaceous | –0.86 | Chalk Group |
| Top Frederikshavn | –0.65 | L. Cret. through Jurassic |
| Top Børglum | ||
| Top Haldager | ||
| Top Fjerritslev | ||
| Top Triassic | ||
| Top Bunter Sandstone | –0.59 | Triassic Units |
| Top Bunter Shale | ||
| Base Triassic | ||
| Top Pre-Zechstein | –0.08 | Zechstein Group |
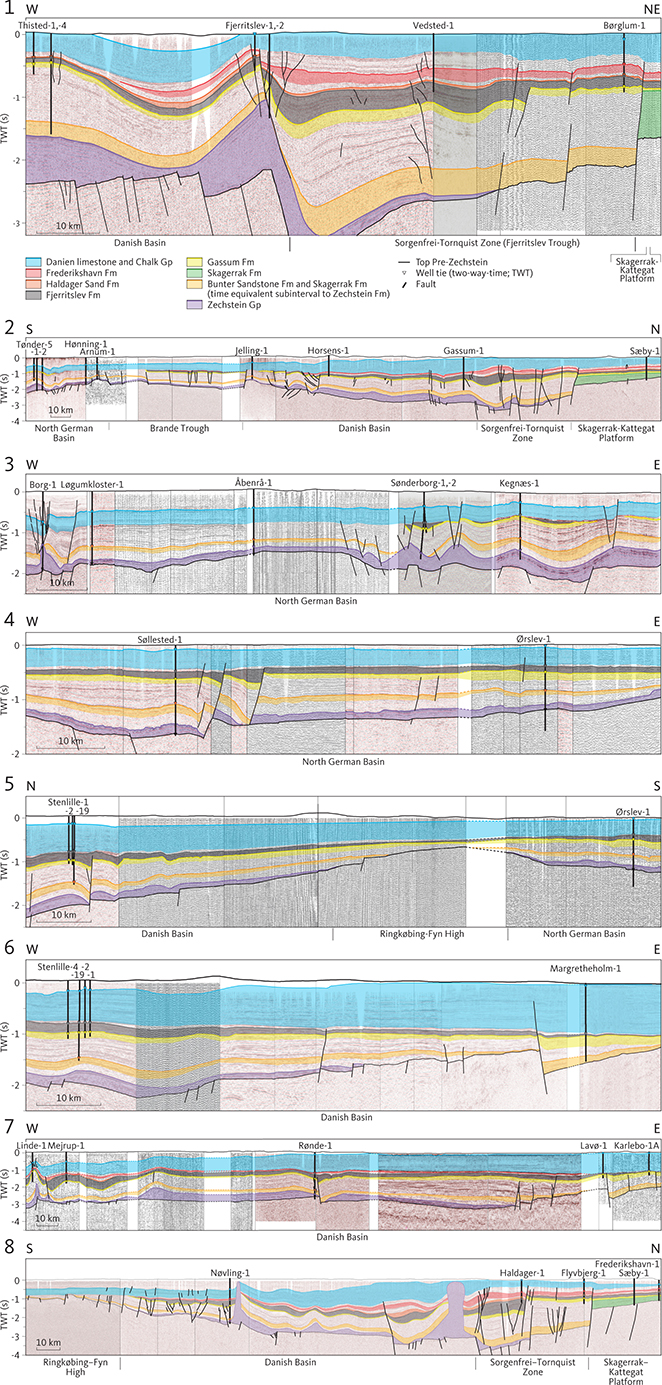
Eight cross-sections have been constructed (Appendix 1) based on interpreted seismic profiles to illustrate the geologic succession in another manner than the depth and isochore maps and the interpreted seismic profiles. On the cross-sections, potential reservoir formations and the Zechstein Fm are colour-coded.
3 Results of interpretation and gridding
The seismic interpretation carried out as part of this study builds on earlier research, notably the lithostratigraphic unit boundaries compiled by Nielsen & Japsen (1991), which refer to Mesozoic lithostratigraphy defined in earlier papers (notably Bertelsen 1978, 1980; Michelsen 1978) with later revisions (e.g. Michelsen 1989; Michelsen & Clausen 2002; Michelsen et al. 2003). In wells released after 1991, lithostratigraphic tops have been obtained from well reports and GEUS’ databases.
Seismic horizons generally reflect events of short duration in contrast to lithostratigraphic boundaries that may reflect facies changes which migrate across a basin in a finite time interval which are considerably longer (Mitchum et al. 1977). In addition, even clear seismic ties may be difficult to trace from drilled structural highs into deeper parts of the basins. We accordingly used an informal terminology for the interpreted seismic units (Fig. 5).
In this section, the seismic interpretation of the study area is presented. Both seismic indications of depositional features and indications of tectonic modification of the units are presented in the descriptions. For this reason, we describe the seismic units top down. Subsequently the structural and depositional evolution is presented bottom-up.
Seven major seismic units are interpreted. From top to bottom they are termed unit A to G.
Keeping the reservations regarding the correlation between seismic and lithostratigraphic interpretation in mind, these seismic units relate to specific lithostratigraphic units as outlined below.
| Unit A | includes the Cenozoic. It overlies a distinct seismic horizon tying to the top of the Chalk Group (the Cenozoic is not treated further in this study). |
| Unit B | includes the Chalk Group and is bounded at the top by the base unit A and at the bottom by a seismic horizon tying to the base of the Chalk Group. |
| Unit C | includes the Lower Cretaceous units of Nielsen & Japsen (1991) and is bounded at the top by the base unit B horizon (where the Chalk Group is present). In the central part of the study area, the base unit B horizon is a distinct angular unconformity. |
| Unit D | includes the Middle and Upper Jurassic units of Nielsen & Japsen (1991). The lower boundary is an unconformity formed at the boundary between the Lower and Middle Jurassic (Nielsen 2003). |
| Unit E | includes the Fjerritslev and Gassum Formations. The base of unit E is tying to the base of the time-transgressive Gassum Formation and is represented by a combination of two seismic horizons; each of these surfaces are mapped in restricted parts of the study area |
| Unit F | includes the Triassic units of Nielsen & Japsen (1991) and is bounded at the base by a seismic horizon tying approximately to the top of the Zechstein Group and by the base of the Gassum Formation. |
| Unit G | includes the Zechstein Group and is bounded at the base by the top pre-Zechstein surface, a distinct unconformity truncating Permian–Carboniferous synrift deposits and older units. |
These units correspond to six major depositional intervals, each characterised by a relatively uniform succession and bounded by major lithological boundaries or significant angular unconformities. Unit E, bounded at the top by a significant angular unconformity, is considered the terminal part of the depositional interval starting at the base of unit F.
The following sections describe seismic units B to G interpreted and mapped in this study. Regarding unit A, the reader is referred to Rasmussen (2017). Units D, E and F are subdivided into smaller units. Below unit G, we have identified the Rotliegend Group and Carboniferous, Devonian and Lower Palaeozoic strata, and these are briefly described based on observations on the seismic profiles. No maps of these four stratal packages are presented, as a systematic interpretation has not been carried out. The description of each unit (B–G) or sub-unit starts with a general reference to the literature. This is followed by a description of the overall seismic character of the unit and one or both of the bounding horizons. The descriptions are supported by seismic sections illustrating the character of the unit in the vicinity of wells with ties to the correlating lithostratigraphic units, depth maps and isochore maps
The extent of the seismic horizons and the lithostratigraphic boundaries are shown on Fig. 6. On depth maps related to the interpreted horizons, it is indicated in which wells the horizon has been penetrated, and on the related isochore maps, it is indicated in which wells the unit is drilled and penetrated. Eight cross-sections through the study area are presented in Appendix 1 to illustrate the geologic column in the different parts of the study area.
The original map and figures constructed in Petrel is ED50-UTM32 (“MENTOR:ED50-UTM32:European 1950 Based UTM, Zone 32 North, Meter”), and maps for publication have been adjusted to the map template constructed in GIS (“GIS-DK-Standard: ETRS89-UTM32”).
3.1 Unit B – Chalk Group
3.1.1 Background and borehole data
Unit B corresponds to the Chalk Group, which comprises Upper Cretaceous and Danian deposits, up to about 2000 m of carbonates, mostly chalk, with intercalations of flint (Vejbæk et al. 2010; Surlyk et al. 2013). The Chalk Group is present throughout the study area and adjacent areas (Fig. 6) except for the northern and eastern part of the study area where it is lacking in the Skagen-1, Skagen-2, Hans-1 and Terne-1 wells (Sorgenfrei & Buch 1964; Nielsen & Japsen 1991).
Otherwise, it is identified in all the deep boreholes penetrating the Cenozoic succession. The absence of the Chalk Group in the northern and eastern part of the study area is interpreted to reflect uplift and erosion during the Neogene (Japsen 1993; Japsen & Bidstrup 1999; Japsen et al. 2002). In most of the boreholes, identification of the Chalk Group is based on lithological and palaeontological examination of cuttings. Petrophysical logs were measured through at least the lower part of the Chalk Group in many of the deep boreholes. Mostly, either a gamma-ray or spontaneous potential log was incorporated in the log suite through the group, and commonly also a sonic log was part of the logging suite. Overall, the chalk is characterised by low gamma-ray level (<10 GAPI) and low sonic transit times compared to the bounding units, although for some wells the transit time decreases in the lower part of the unit. Using a log suite comprising either a gamma-ray or a sonic log, the base of the Chalk can be established with a precision of about 2–3 m (depending on the vintage and quality of the log).
3.1.2 Top and base of seismic unit B
The top of unit B is defined by a reflection of high amplitude and high continuity associated with a high impedance contrast found at the top of the Chalk Group (Fig. 8). Generally, a few logs have been measured through the upper part of the unit B. All seismic to borehole correlations for this horizon are based solely on the TWT converted well-tops compiled by Nielsen & Japsen (1991)rather than logs and synthetic seismograms.
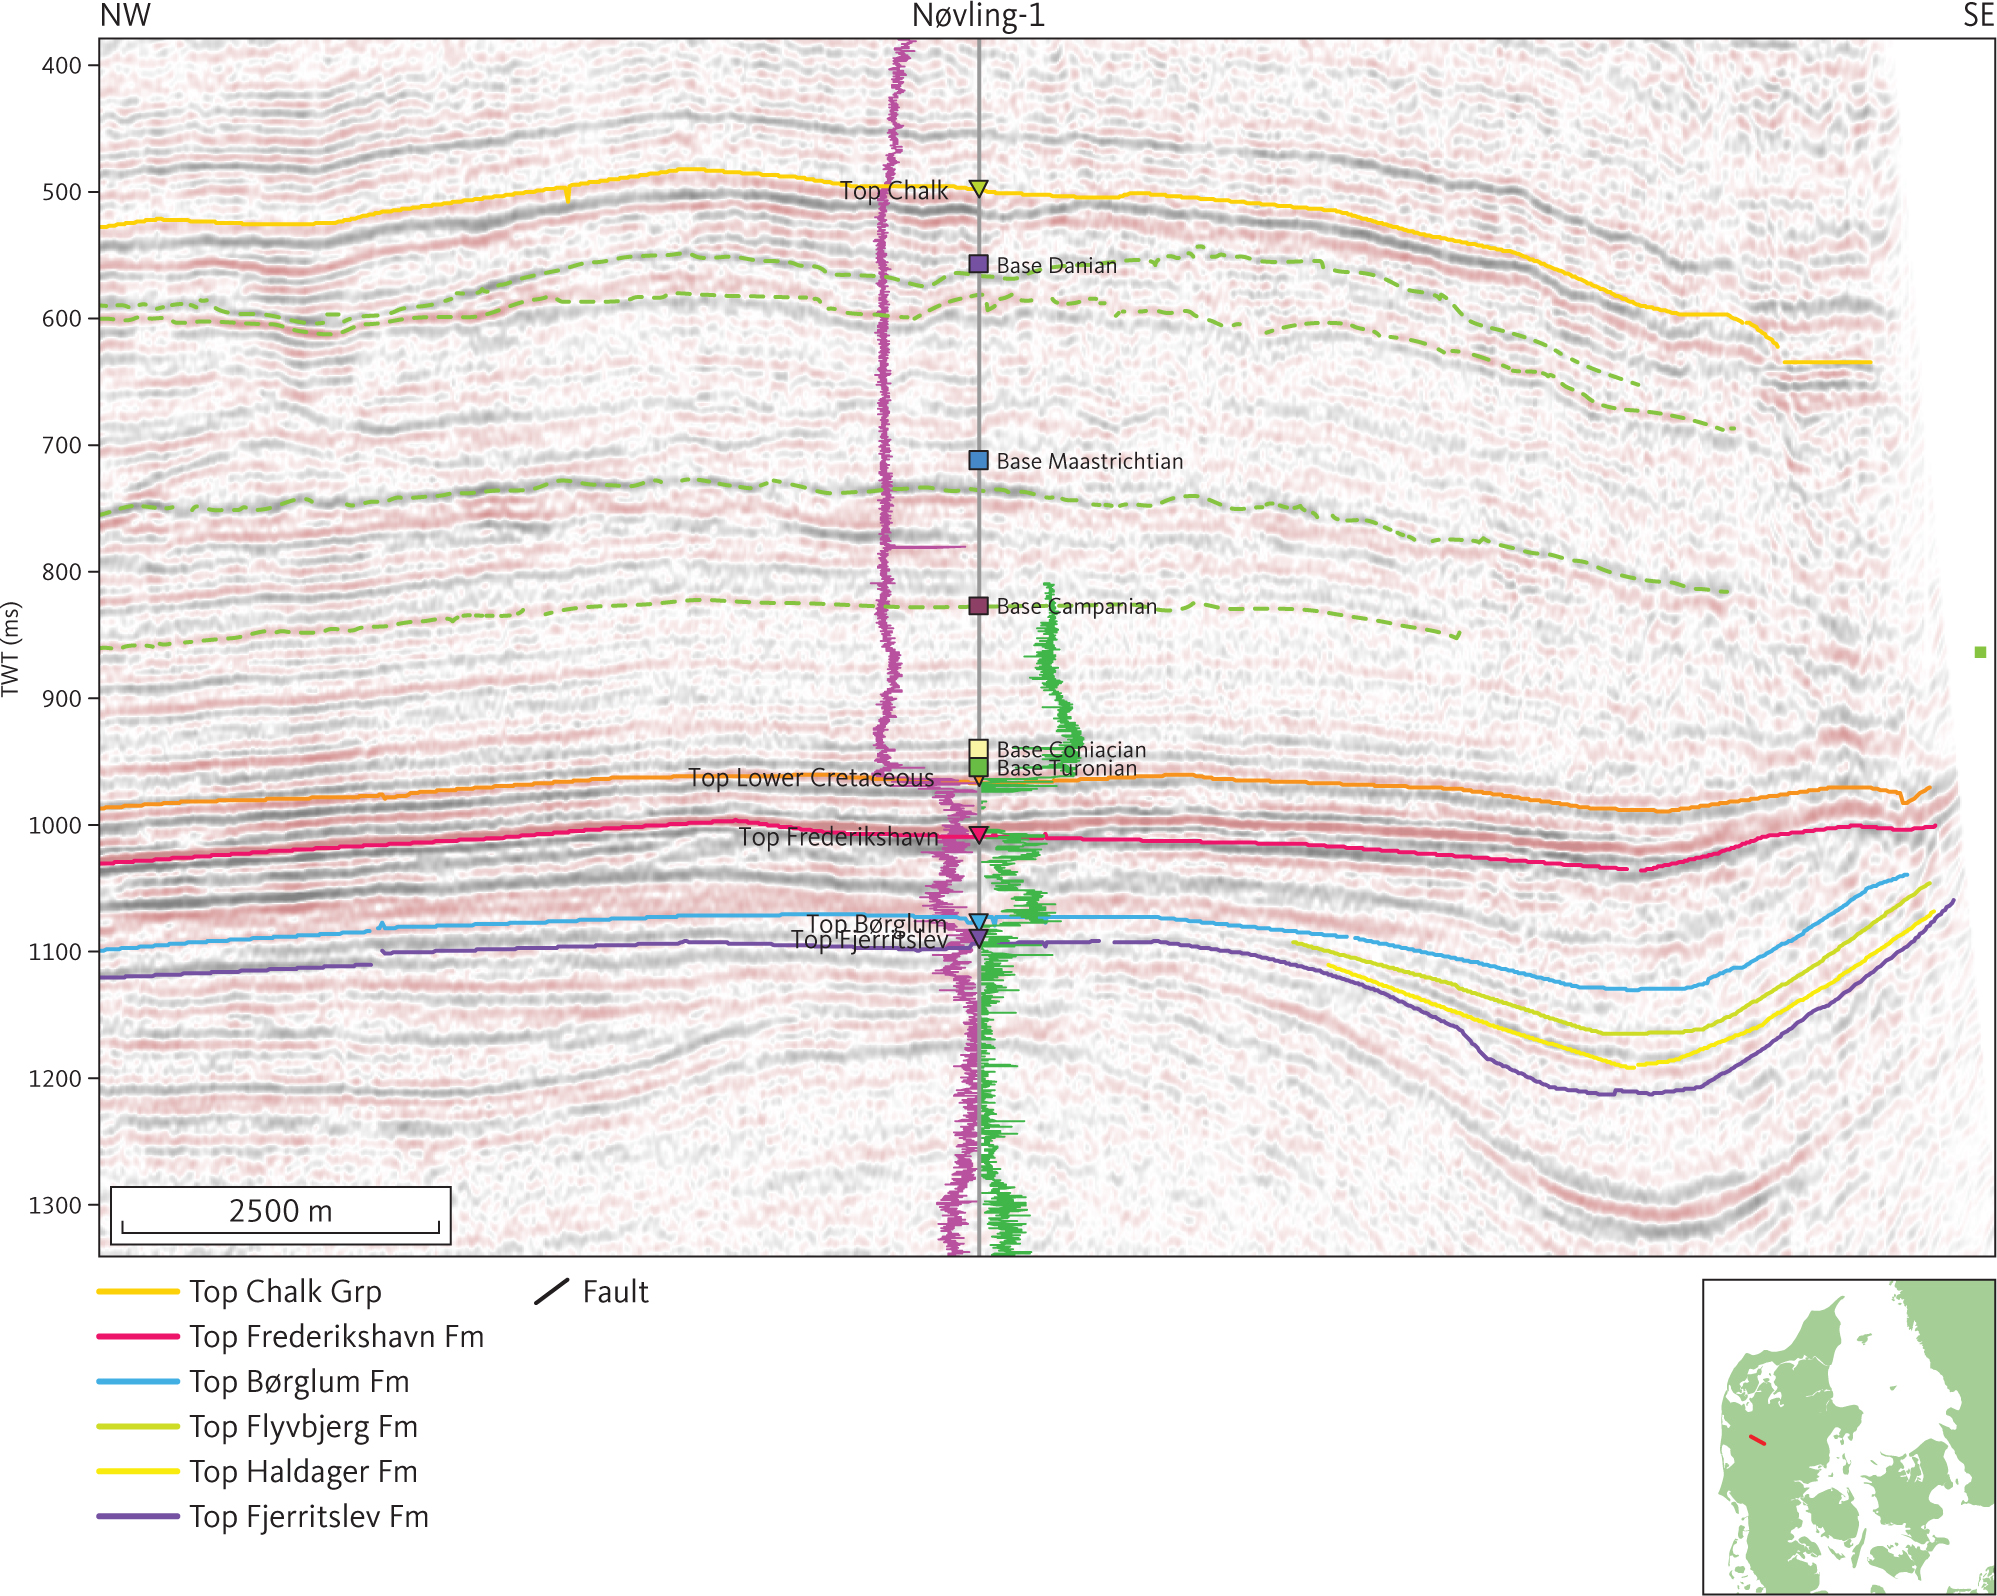
Fig. 8 Seismic section (ADK85-144) illustrating the seismic character of the Chalk Group at the Nøvling-1 well. The gamma-ray and sonic logs are shown as purple and green lines, respectively, on either side of the Nøvling-1 path, with highest values closest to the well trace. Stippled green horizons within the Chalk Group are not mapped systematically. Inserted map shows the location of the profile.
Imaging of unit B is generally poor where it occurs at shallower depths than about 300 m below MSL (mean sea level). Picking the seismic horizon corresponding to the top of unit B is thus very uncertain in large areas of northern and eastern Denmark. In a large part of these areas, the top of the Chalk Group is identical to the pre-Quaternary surface (Binzer & Stockmarr 1994; Nielsen et al. 2008). Where this is the case, the top pre-Quaternary surface has been used to provide a comprehensive grid of the top of the Chalk Group (Fig. 9). The difference between the picked seismic interpretation and the well top are in the range 0–20 m; 0–25 ms. Overall, the top of unit B is picked with an accuracy in TWT depth of c. 50 ms, corresponding to about 40–50 m.
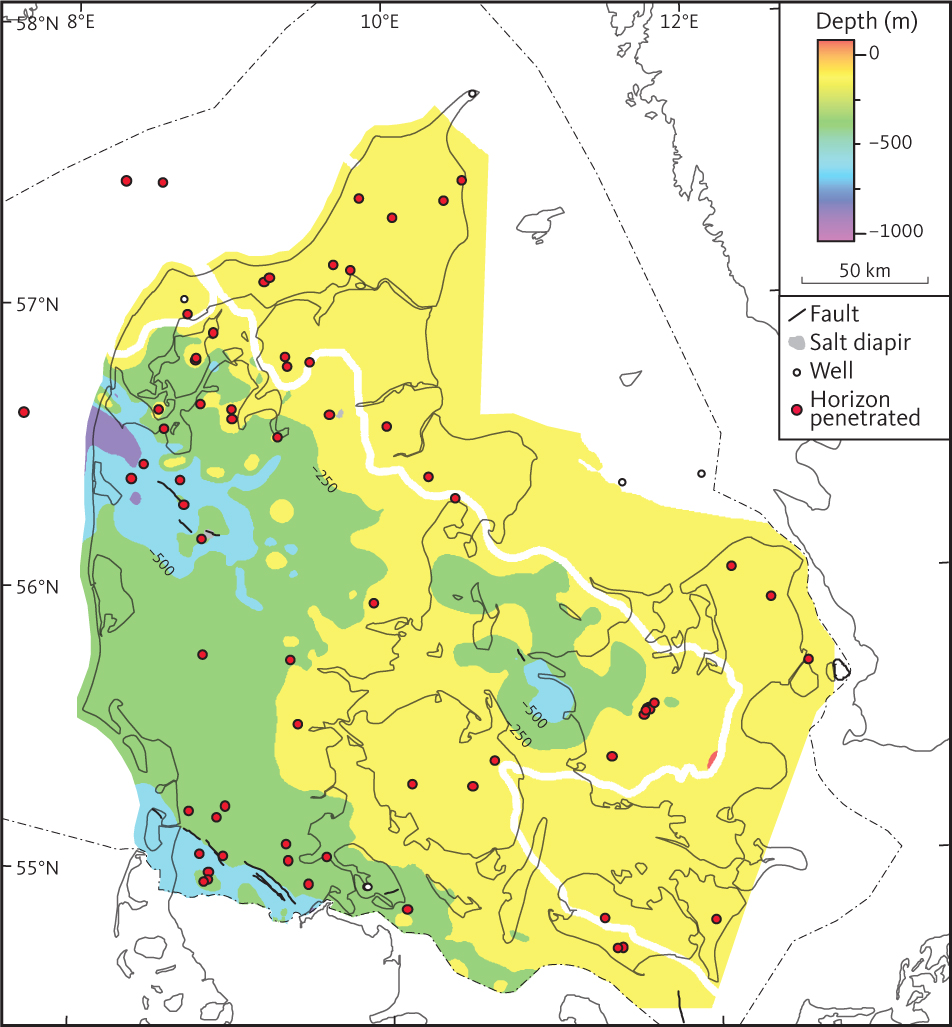
Fig. 9 Depth to the top of seismic unit B (the Chalk Group). The Chalk Group is truncated by erosion to the north and east of the bold white line in the study area.
The seismic horizon of the top of unit B is located at its greatest depth in the southern and central part of the Danish Basin (c. 900 m below MSL) and in the North German Basin (c. 800 m below MSL). Overall, westward deepening of the top unit B is observed in both basins (Fig. 9). Northward shallowing of the top surface across the Sorgenfrei–Tornquist Zone and Skagerrak-Kattegat Platform is attributed mostly to Cenozoic uplift and erosion (e.g. Japsen 1993). Unit B is also observed at shallow depths above the Ringkøbing–Fyn High but no pronounced erosion of the top is observed in this area. Where the horizon is deepest in the Danish Basin and the North German Basin it appears to be warped (Figs 9, 10). Three diapirs penetrate the horizon (Fig. 9), and locally the horizon is offset by Cenozoic faulting (Figs 10, 11). The deformation of the surface is mostly associated with thinning/doming caused by halokinesis of unit G (the Zechstein Fm).
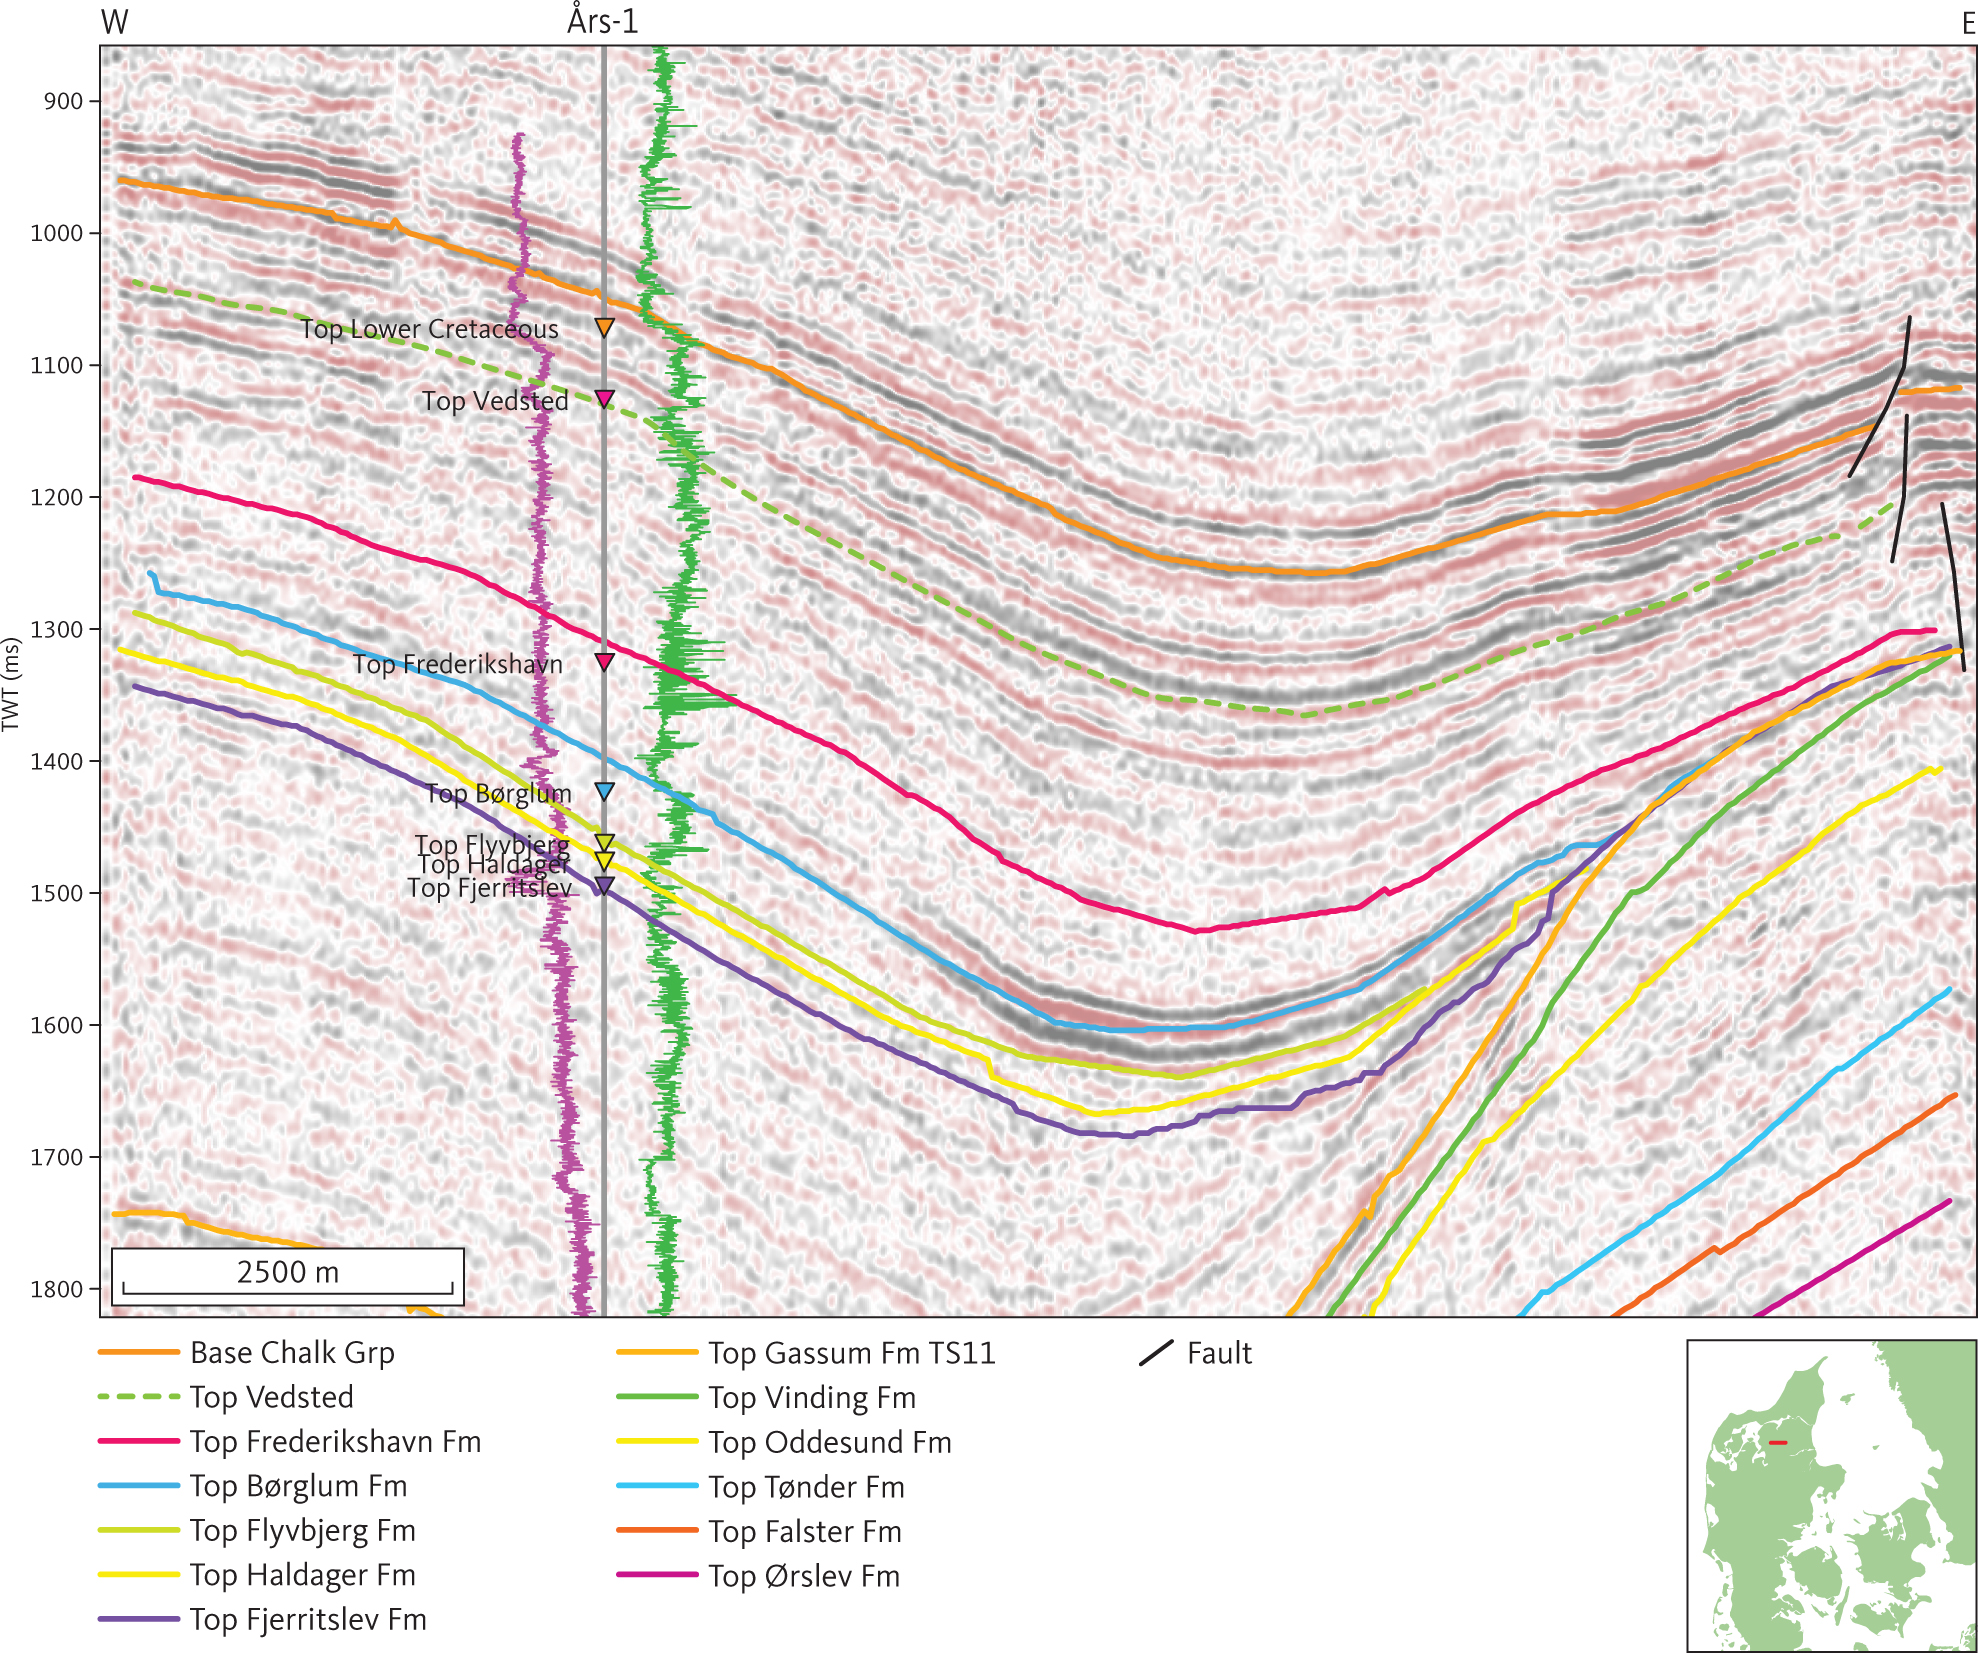
Fig. 10 Seismic section (D82-3) illustrating the seismic character of the Lower Cretaceous at the Års-1 well. The gamma-ray and sonic logs are shown as purple and green lines, respectively, on either side of the Års-1 well path, with highest values closest to the well trace. The top Vedsted Formation shown as a stippled green horizon is distinct around Års-1, but not mapped systematically. Thickening of the Vedsted Formation and Frederikshavn Formation (D1, see Section 3.3.1) away from the structure in eastern part of the section is attributed to the Late Cimmerian tectonic phase that took place in the Kimmeridgian. Inserted map shows the location of the profile.
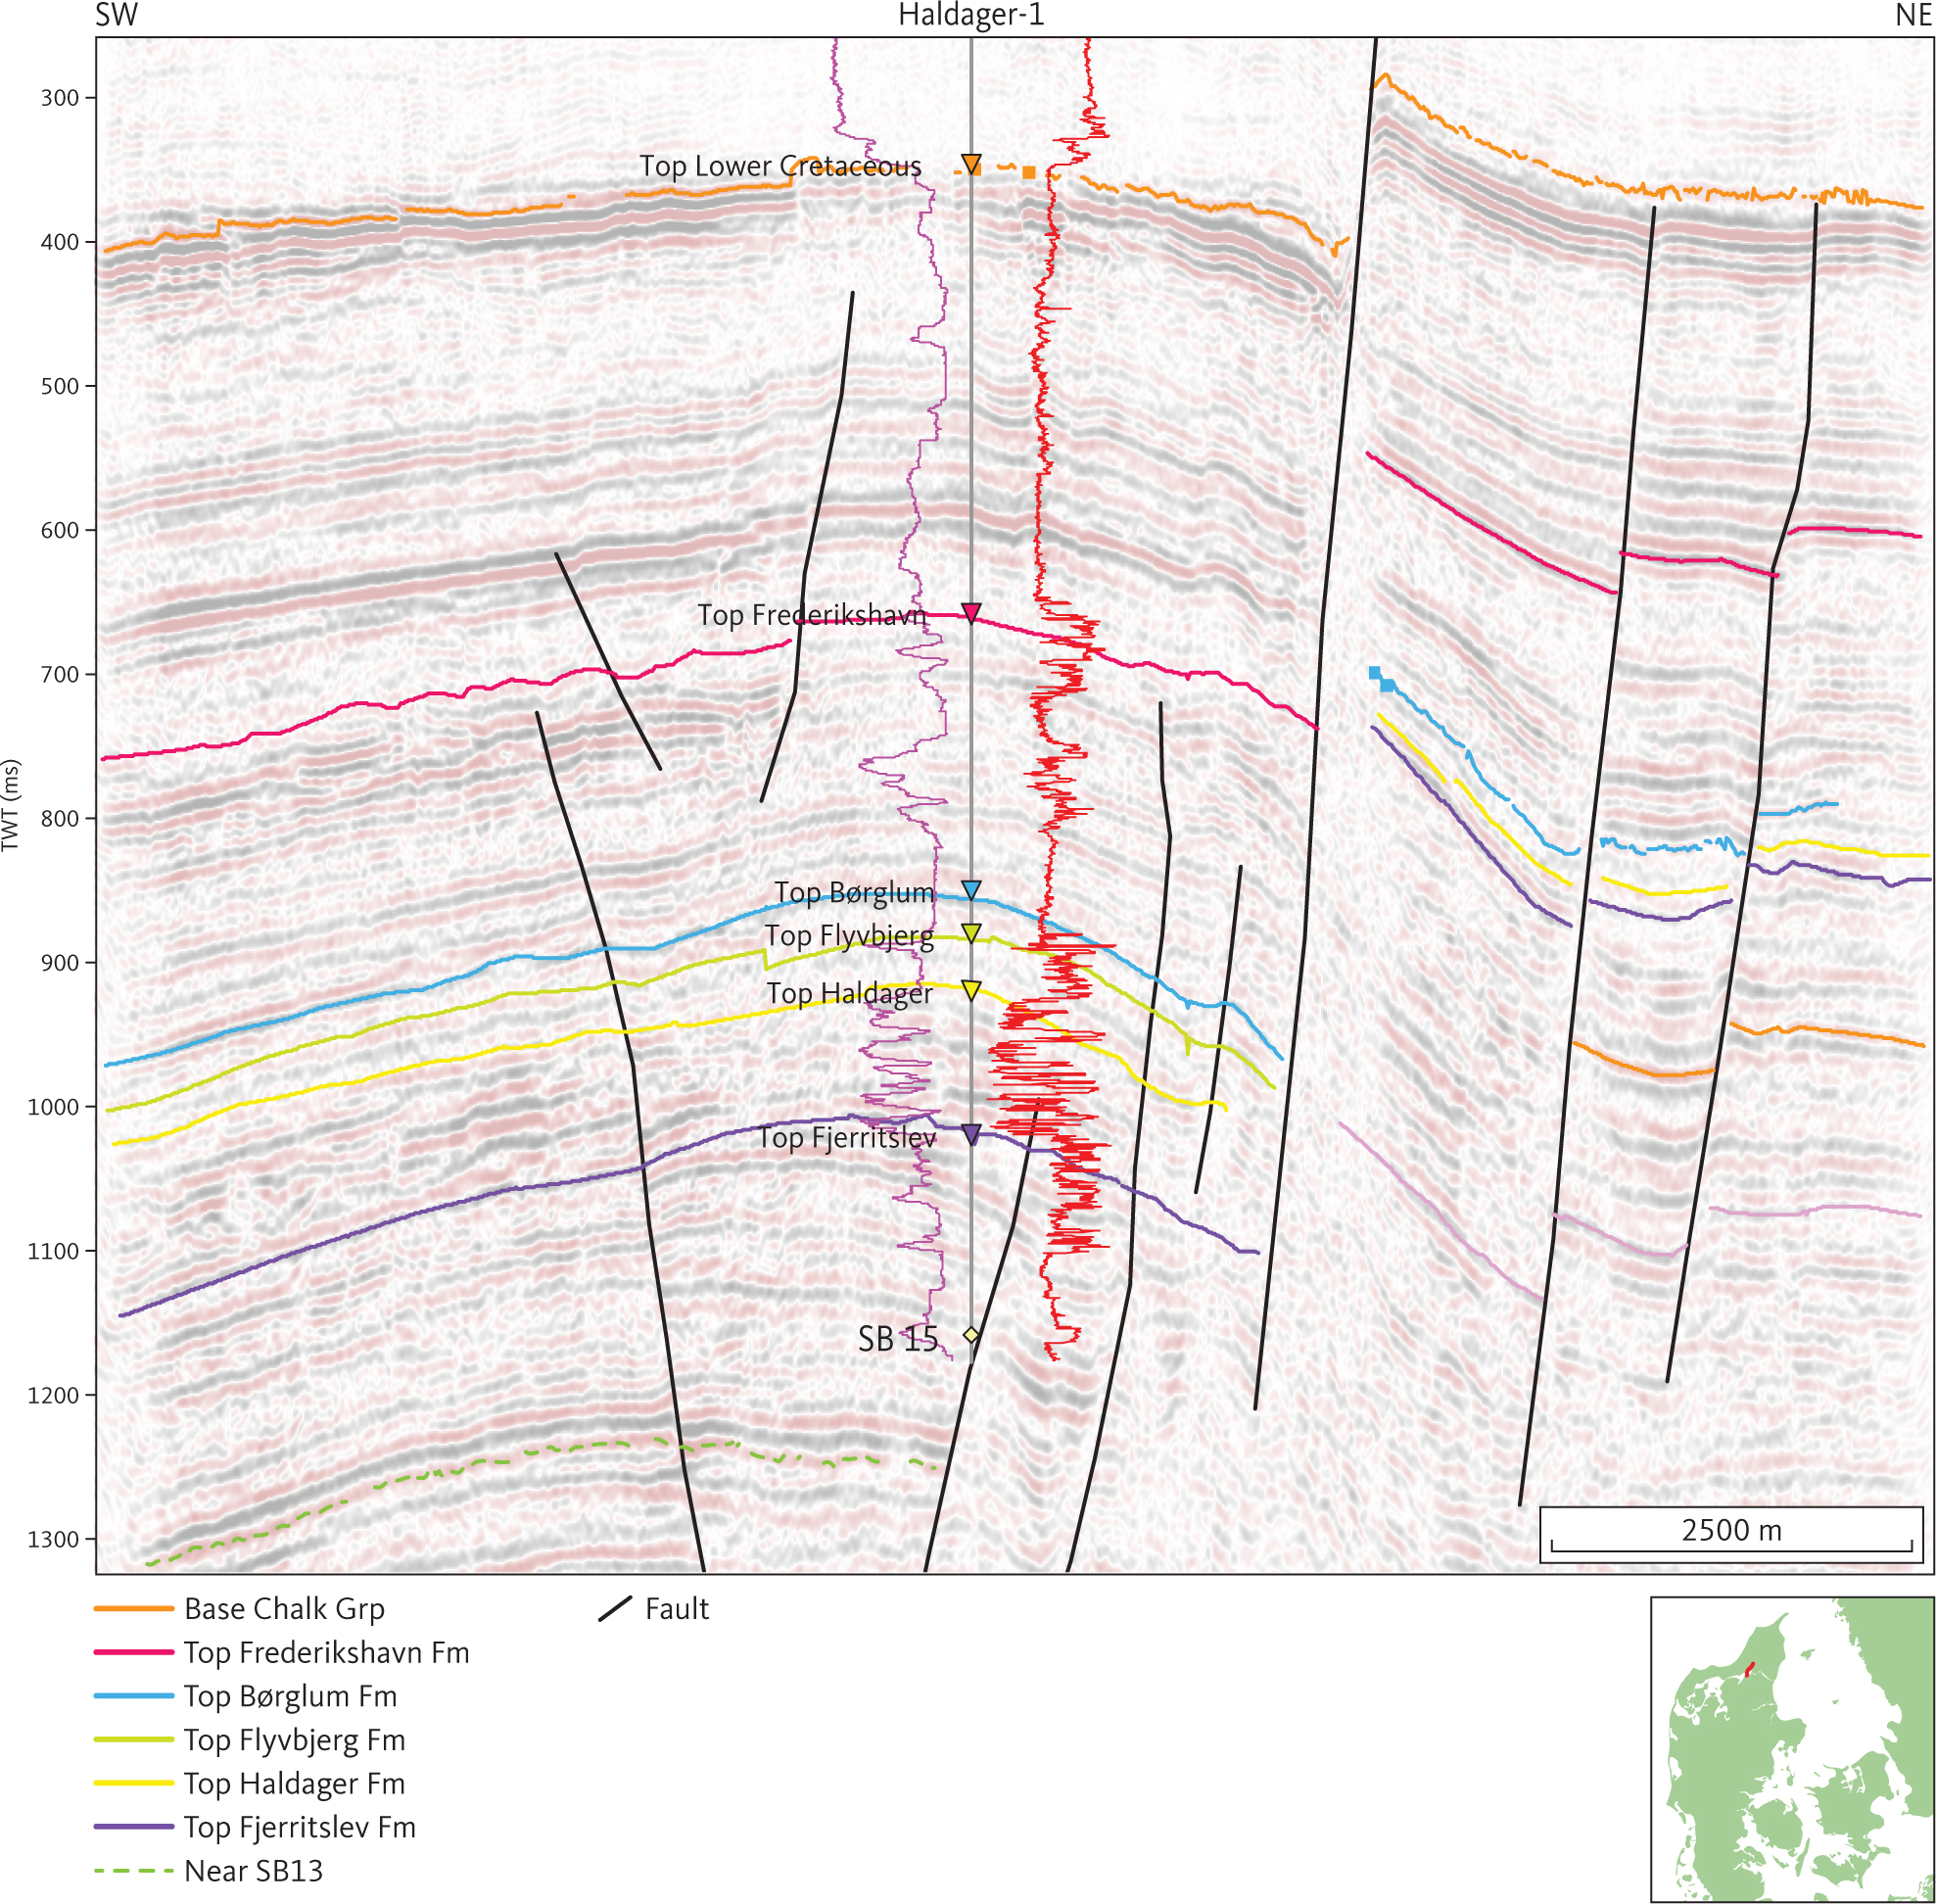
Fig. 11 Seismic section (VAT08-10) across the Fjerritslev Fault Zone illustrating the seismic character of the Frederikshavn Formation at the Haldager-1 well in northern Jylland. The gamma-ray and short space resistivity (10”) logs are shown as purple and red lines, respectively, on either side of the Haldager-1 well path with the highest values closest to well trace. The SB13-horizon within the Fjerritslev Formation (E1; see Section 3.4.1), shown as a stippled green horizon, is not mapped systematically. Inserted map shows the location of the profile.
The base of unit B is picked on a high amplitude and high continuity reflection at the base of the Chalk Group (Fig. 8). The reflection is associated with a high impedance contrast found at the base of the Chalk Group. The depth grid of the base unit B seismic horizon is illustrated in Fig. 12. The horizon is found at around 1000 m and 800 m below MSL in the North German Basin and above the Ringkøbing–Fyn High, respectively. In the Danish Basin, the horizon deepens towards the north–north-east. The greatest depth of the horizon is in southern Kattegat (c. 2350 m below MSL) and in local depocentres related to salt structures in Jylland (more than 2500 m below MSL), where it occurs 2650 m below MSL. The horizon is cut by some faults of which most are associated with thinning/doming of the Zechstein Fm (Fig. 12). The Grenå–Hälsingborg (Håkansson & Pedersen 1992; Pedersen 1992; Kamla et al. 2014) and Fjerritslev faults separate the central part of the Danish Basin from the shallower Skagerrak–Kattegat platform (c. 500–1000 m). Salt movements have little influence on deformation along the Grenå–Hälsingborg and Fjerritslev faults (Fig. 12).
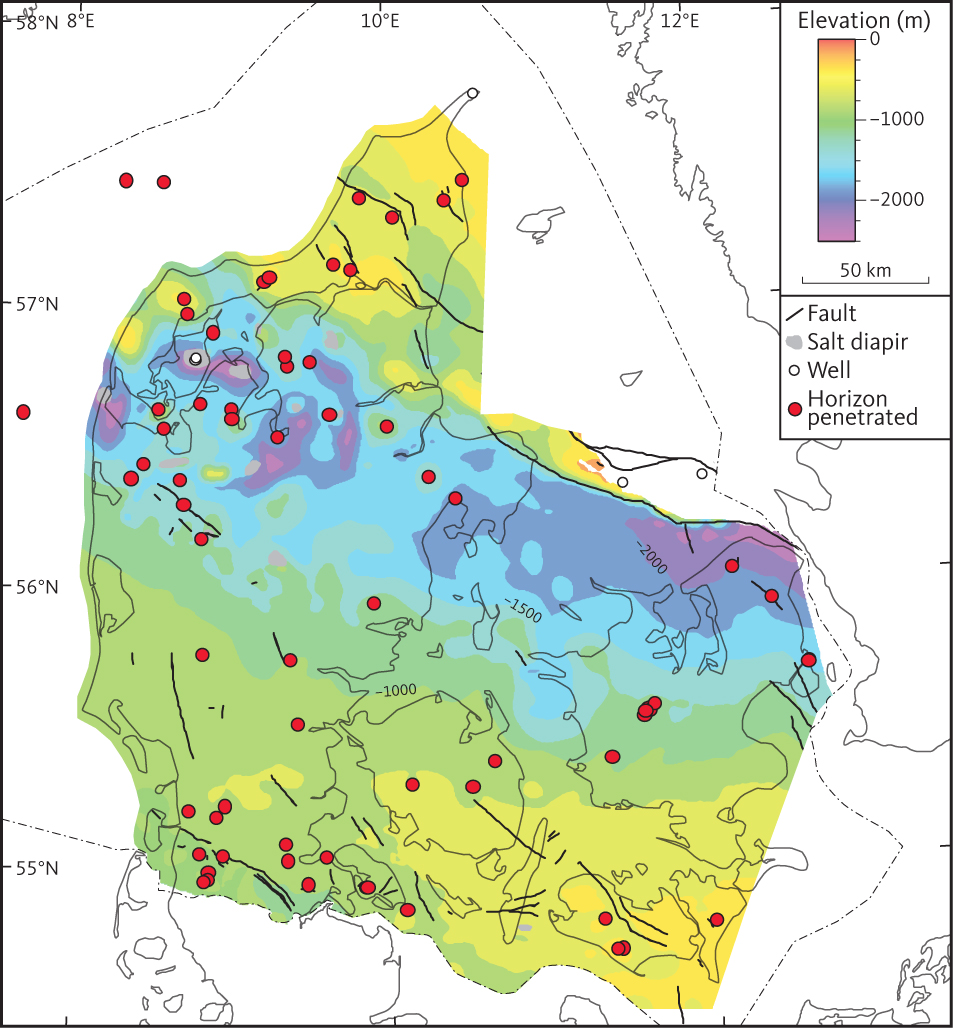
Fig. 12 Depth to the base of seismic unit B (the Chalk Group). Note northward deepening of the surface into the Sorgenfrei–Tornquist Zone and abrupt shallowing onto the Skagerrak–Kattegat Platform. The depth of the Chalk Group on the Skagerrak–Kattegat Platform is to some extent caused by Cenozoic inversion and regional uplift (Japsen 1993; Mogensen & Jensen 1994; Japsen et al. 2016).
3.1.3 Seismic character of unit B
On reflection seismic data acquired and processed in order to image the Chalk Group, unit B is typically characterised by reflections from sub-parallel internal horizons of high continuity and moderate amplitude (Fig. 8). Minor unconformities are observed within the unit and can generally, along with some additional pronounced seismic horizons, be traced in seismic data of good quality throughout most of the study area (e.g. Surlyk et al. 2013; Larsen et al. 2014). In the present study, the significance of the internal horizons in unit B is not interpreted, but they may reflect a dynamic depositional environment influenced by strong bottom currents as proposed by Surlyk et al. (2013). Where the Chalk Group is located at shallower depths than about 300 m below MSL, the seismic profiles are generally characterised by poor imaging, especially for the upper part of the group.
3.1.4 Isochore of seismic unit B
A thickness isochore map of unit B is presented in Fig. 13. Overall, unit B thickens from c. 500 m in the North German Basin to c. 2300 m in south-eastern Kattegat, just south of the Grenå–Hälsingborg Fault. Thicknesses up to c. 2600 m are reached in local depocentres associated with salt structures south of the Fjerritslev Fault (e.g. Boldreel 1985). Unit B thins northwards across the Sorgenfrei–Tornquist Zone and the Skagerrak–Kattegat Platform. In the Kattegat, north of the Grenå–Hälsingborg Fault, the Chalk Group is absent or very thin. The northward thinning of unit B is associated with erosion following Cenozoic inversion in the Sorgenfrei–Tornquist zone and uplift of the Skagerrak–Kattegat Platform (Japsen 1993).
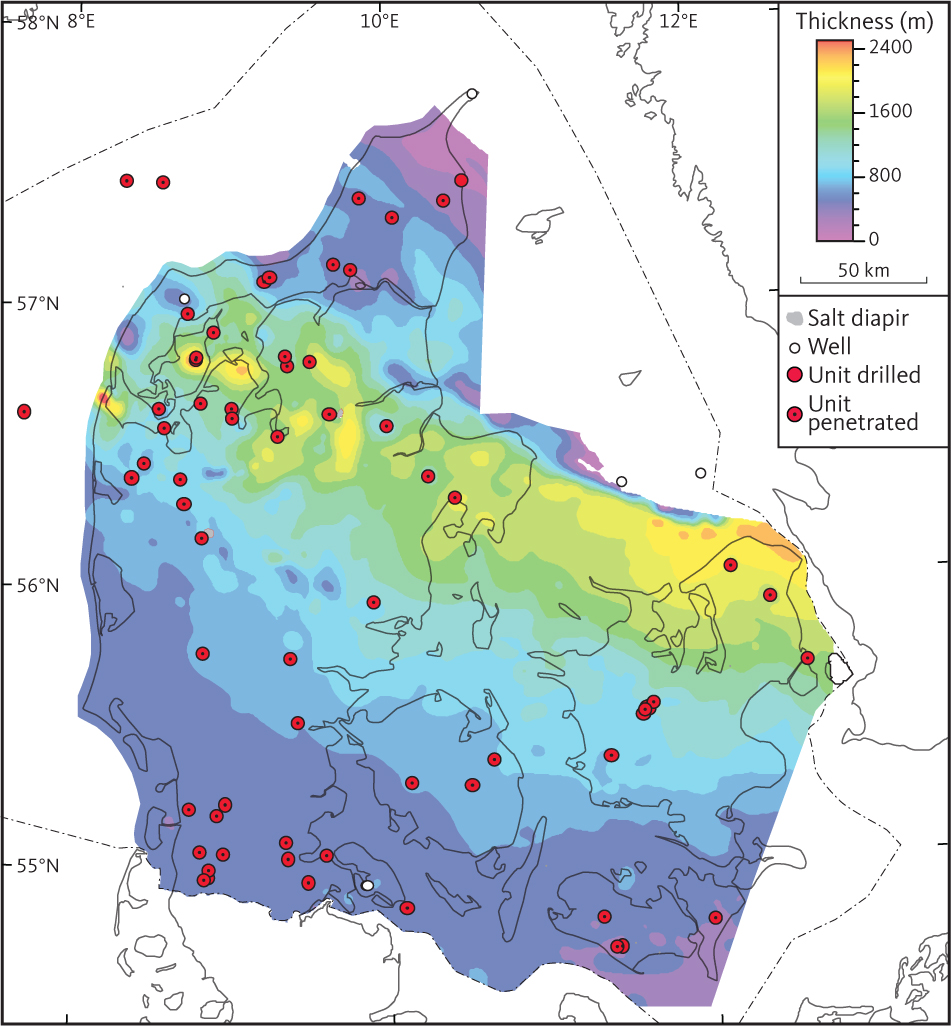
Fig. 13 Isochore map of seismic unit B (the Chalk Group). The Chalk Group is truncated by erosion in the northern and eastern part of the study area (see Fig. 9).
3.2 Unit C – Lower Cretaceous units
3.2.1 Background and borehole data
Within the study area, we find that unit C is equivalent to the Lower Cretaceous units that are observed in all deep boreholes in the study area, except the Hans-1 and Skagen-2 boreholes (e.g. Nielsen & Japsen 1991). Within the north-eastern part of the study area, the Lower Cretaceous units comprise a succession of mostly sandstones and claystones grouped in the Vedsted Formation (Larsen 1966; Pedersen et al. 2021). To the south-west, the upper part of the Lower Cretaceous is dominated by marly sediments of the Rødby Formation (Larsen 1966). The Vedsted Formation is not present in the boreholes located in the southern part of Danish Basin (Larsen 1966; Nielsen & Japsen 1991). In northern Jylland, the lowermost Cretaceous was considered a separate formation, the Skagen Formation (Larsen 1966) but it is now included as the upper part (D1) of the mostly Upper Jurassic Frederikshavn Formation (Michelsen 1978; Michelsen et al. 2003).
More than 700 m of Lower Cretaceous sediments are observed in the Fjerritslev-2 borehole, whereas the thickness is less than 400 m in the remaining boreholes within the study area.
We based our identification of Lower Cretaceous sediments in boreholes on lithological and palaeontological data, supported by our interpretation of petrophysical logs. Overall, petrophysical logs through the Lower Cretaceous are characterised by low amplitude and low frequency patterns on the SP and GR logs indicating a mudstone-dominated but fairly homogeneous succession (Fig. 10).
3.2.2 Base of unit C
The subcrop of unit C is shown in Fig. 14. In the northern part of the study area, the base unit C seismic horizon is characterised by fair lateral continuity of reflections of mostly low to moderate amplitude.
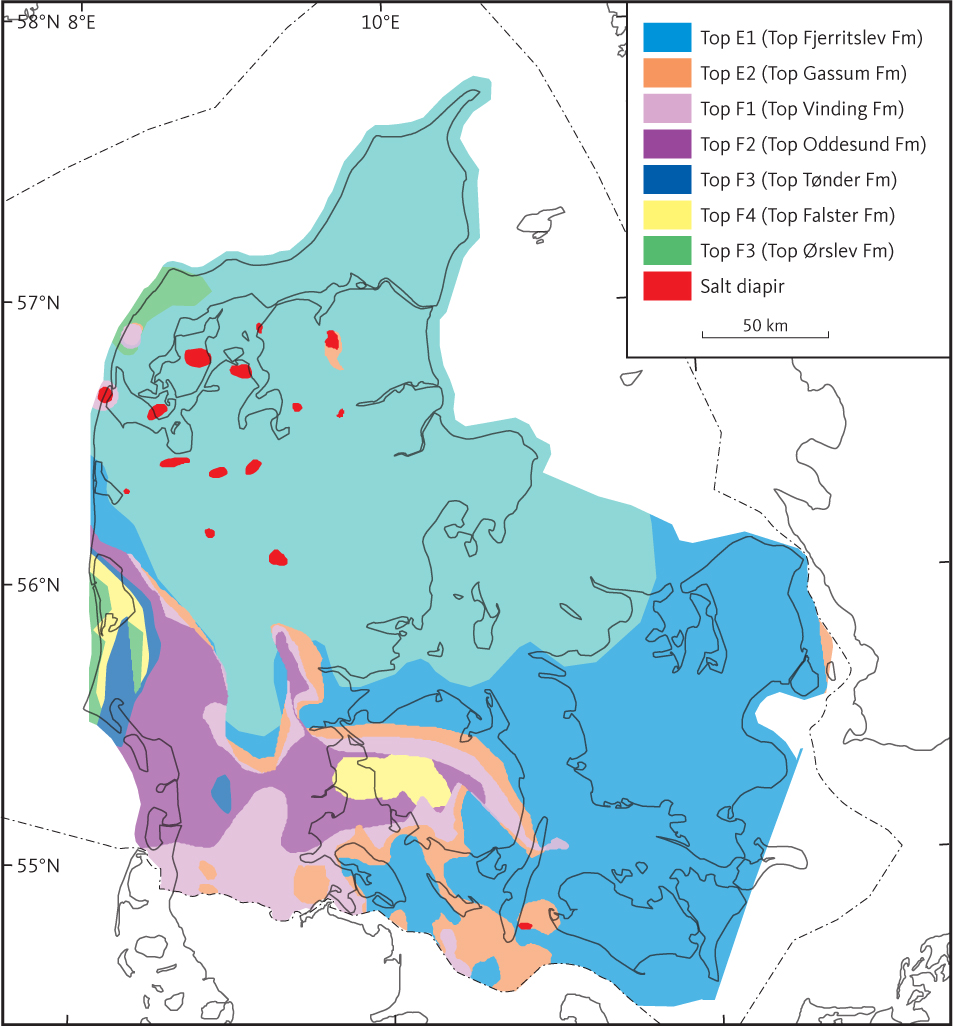
Fig. 14 Subcrop below the base of seismic unit C (the Lower Cretaceous) and the Late Cimmerian Unconformity. The serrated line indicates where the Late Cimmerian Unconformity cut the Middle Cimmerian Unconformity.
In the southern part of the study area, the base of unit C is recognised as an angular unconformity corresponding to a hiatus extending throughout most of the Lower Cretaceous (Valanginian–Aptian). Here, unit C rests directly on the Jurassic or Triassic strata of units D, E and F (Fig. 15). This suggests considerable tectonic uplift in the southern part of Denmark during the latest Jurassic and earliest Cretaceous. Norling & Bergström (1987) demonstrated the presence of high-angle unconformities associated with contemporaneous faulting during Tithonian–Berriasian through Barremian time at Vomb and Fyledalen in Skåne, southern Sweden. These unconformities are presumably linked to the same tectonic movements responsible for the formation of the angular unconformity in the southern part of the study area. Overall, the base unit C seismic horizon shows the same tectonic modifications as the base unit B horizon. It is possible that in the northern part of the study area, the lower boundary of unit C does not represent a hiatus.
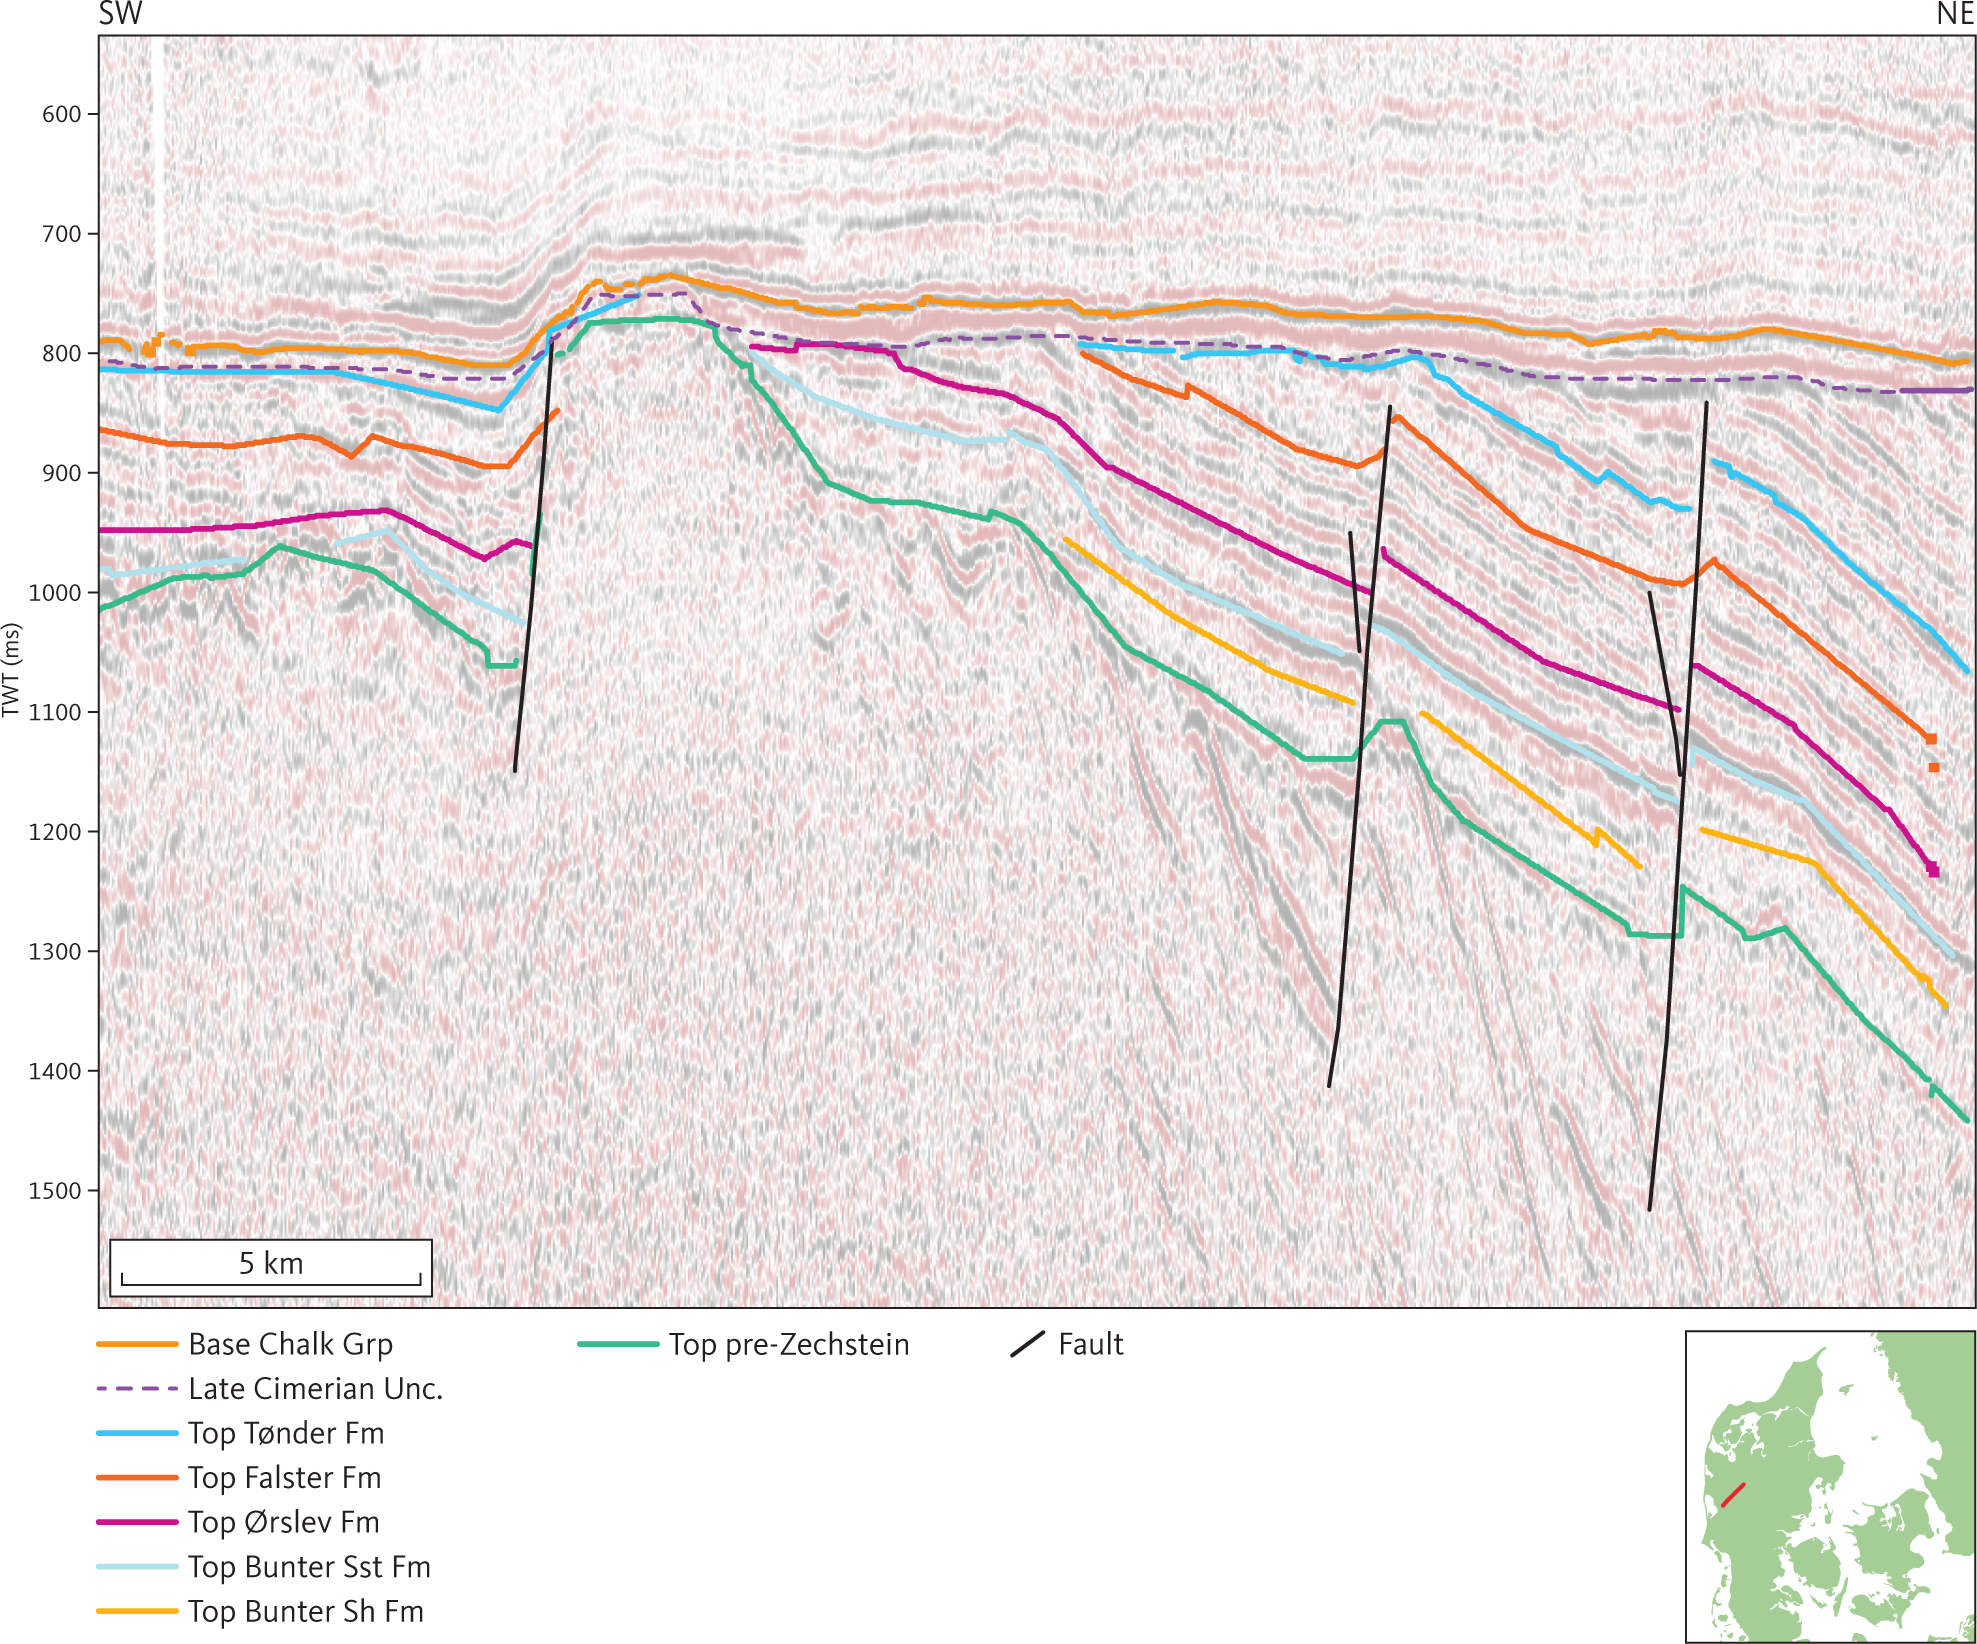
Fig. 15 Seismic section (DCJ-3) illustrating the Late Cimmerian Unconformity truncating Triassic and older units, below the Lower Cretaceous on the Ringkøbing–Fyn High. In this section, internal horizons in the Late Triassic Oddesund Formation (Unit F2) are parallel with reflection horizons in older Triassic units (F3–F7; see Section 3.5). Therefore, the Tectonic movements depicted by the profile are mostly associated with the Late or Middle Cimmerian tectonic phases. The flexure of the Cretaceous units seen in the left side of the figure is associated with Cenozoic reactivation of faults that have been active in either the Triassic or Jurassic or both. Inserted map shows the location of the profile. Unc.: uncomformity.
3.2.3 Seismic character of unit C
Unit C comprises a package of parallel to sub-parallel internal reflections, mostly of low-moderate amplitude and continuity (Fig. 10). In the northern part of the study area, high amplitude reflections of good continuity and high amplitude are interspersed between low amplitude reflections and locally a top Vedsted/base Rødby seismic horizon can be interpreted (Fig. 10). As the TWT thickness of unit C rarely exceeds 250 ms and mostly is less than 50 ms, the top Vedsted/base Rødby horizon has not been interpreted systematically.
3.2.4 Isochore of unit C
In most of the study area unit C is barely discernible in the seismic profiles, having a thickness of less than 75 m (Fig. 16). The greatest thicknesses are reached in the Fjerritslev Trough, up to about 700 m in the vicinity of the Fjerritslev-1 well.
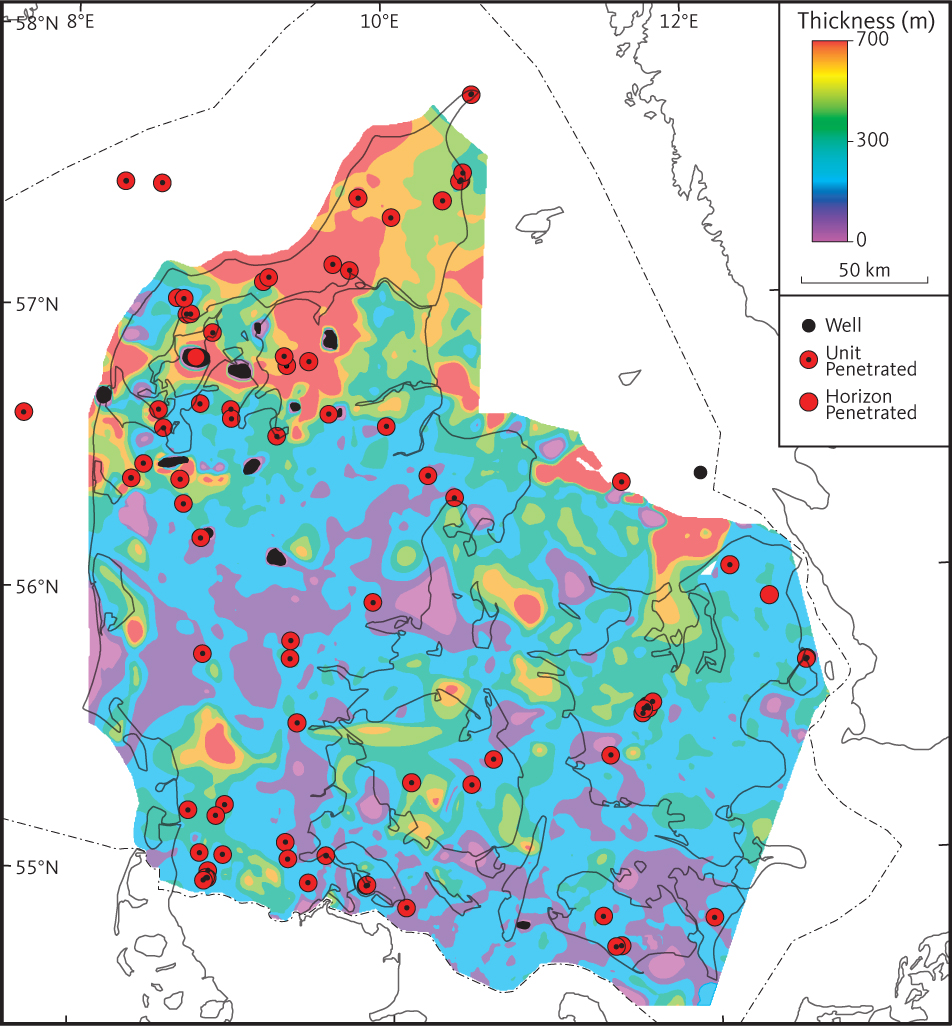
Fig. 16 Isochore map of unit C (Lower Cretaceous). Salt structures penetrating the unit are indicated in black shading.
3.3 Unit D – Middle and Upper Jurassic units
The Middle and Upper Jurassic units in the study area comprise the Haldager Sandstone, Flyvbjerg, Børglum and Frederikshavn Formations and are equivalent to unit D. The unit is present in the northern part of the study area and is subdivided into three sub-units (D1–D3). D1 is more or less equivalent to the Frederikshavn Formation. In the western part of the study area, it may include parts of the Børglum Formation. D2 corresponds to the Flyvbjerg Formation and part of the Børglum Formation, and D3 corresponds to the Haldager Sandstone Formation.
3.3.1 Seismic unit D1 – Frederikshavn Formation
3.3.1.1 Background and borehole data
The Upper Jurassic – Lower Cretaceous Frederikshavn Formation comprises grey and greenish silt- and sandstones with some calcareous intercalations as well as interbeds of claystone (Michelsen 1978; Michelsen et al. 2003). The formation has been encountered in most of the deep boreholes in the northern and central part of Jylland and also in the Terne-1 borehole (Fig. 6). In boreholes, the formation is generally 50–150 m thick but in the Sorgenfrei–Tornquist Zone can be more than 230 m thick. Maximum drilled thicknesses of 243 m and 258 m were encountered in the Haldager-1 and Terne-1 wells, respectively. In wells west and south of Haldager-1 and Terne-1, the formation thins, becoming more fine-grained, the proportion of sandstones decreases and is gradually replaced by the claystone-dominated Børglum Formation. The presence of sandy layers in the south-western part of the basin, for example a thin veneer of the formation in the Brande Trough, suggests that the Ringkøbing–Fyn High was subaerially exposed during deposition and contributed to the sediment supply to adjacent depocentres.
Our identification of the Frederikshavn Formation in the boreholes is based on lithological and palaeontological data and petrophysical log interpretations. The petrophysical log patterns generally reflect interbedding of sand-, silt- and claystones and the presence of overall coarsening-upwards cycles best observed on spontaneous potential and gamma-ray logs (Fig. 11; Michelsen et al. 2003).
3.3.1.2 Top of unit D1
The top of unit D1 corresponds to the conformable part of the base of unit C. A map of the horizon is shown in Fig. 17.
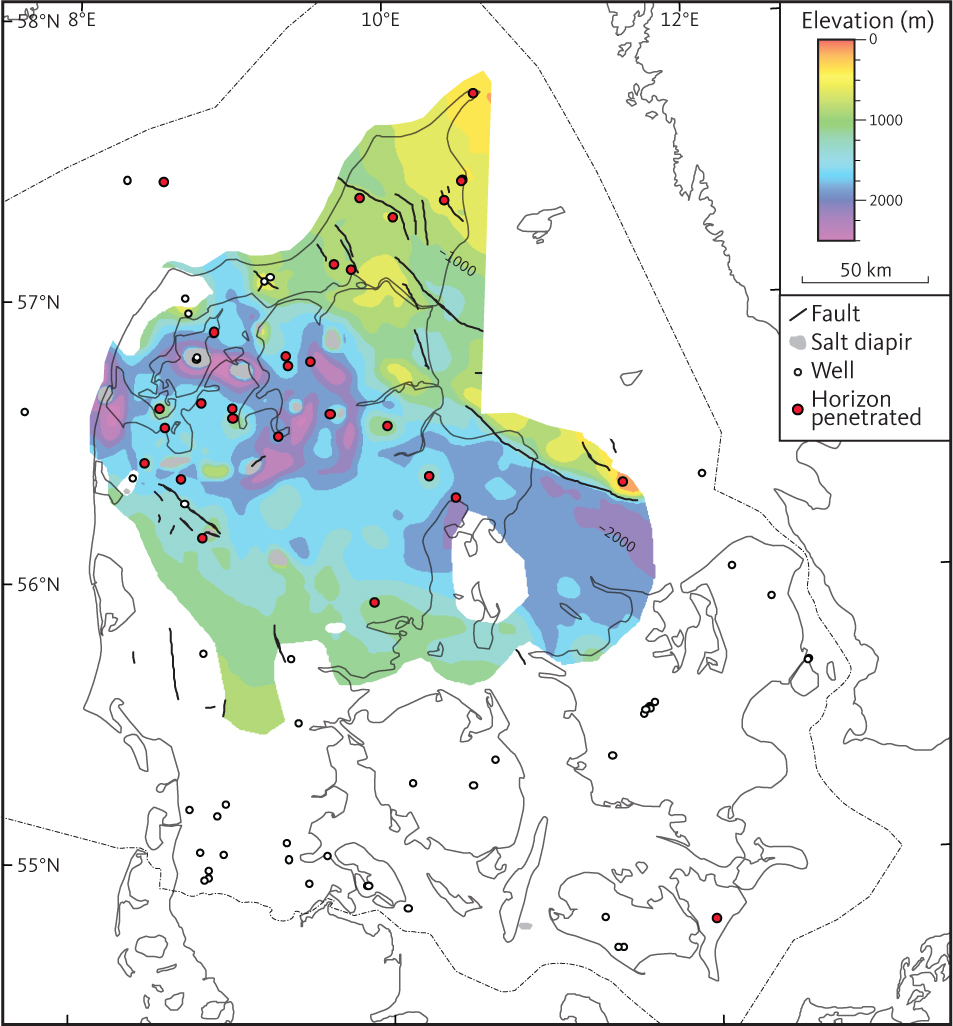
Fig. 17 Depth to the top of seismic unit D1 (Frederikshavn Formation).
3.3.1.3 Seismic character unit D1
Unit D1 comprises a package of mostly parallel or sub-parallel internal reflections, mostly of low-moderate amplitude and fair continuity. Zones of complex reflector configurations with local internal unconformities within the unit are commonly seen on seismic profiles (Figs 10, 11). Onlap of lowermost reflectors onto the basal horizon can be seen locally (Fig. 18).
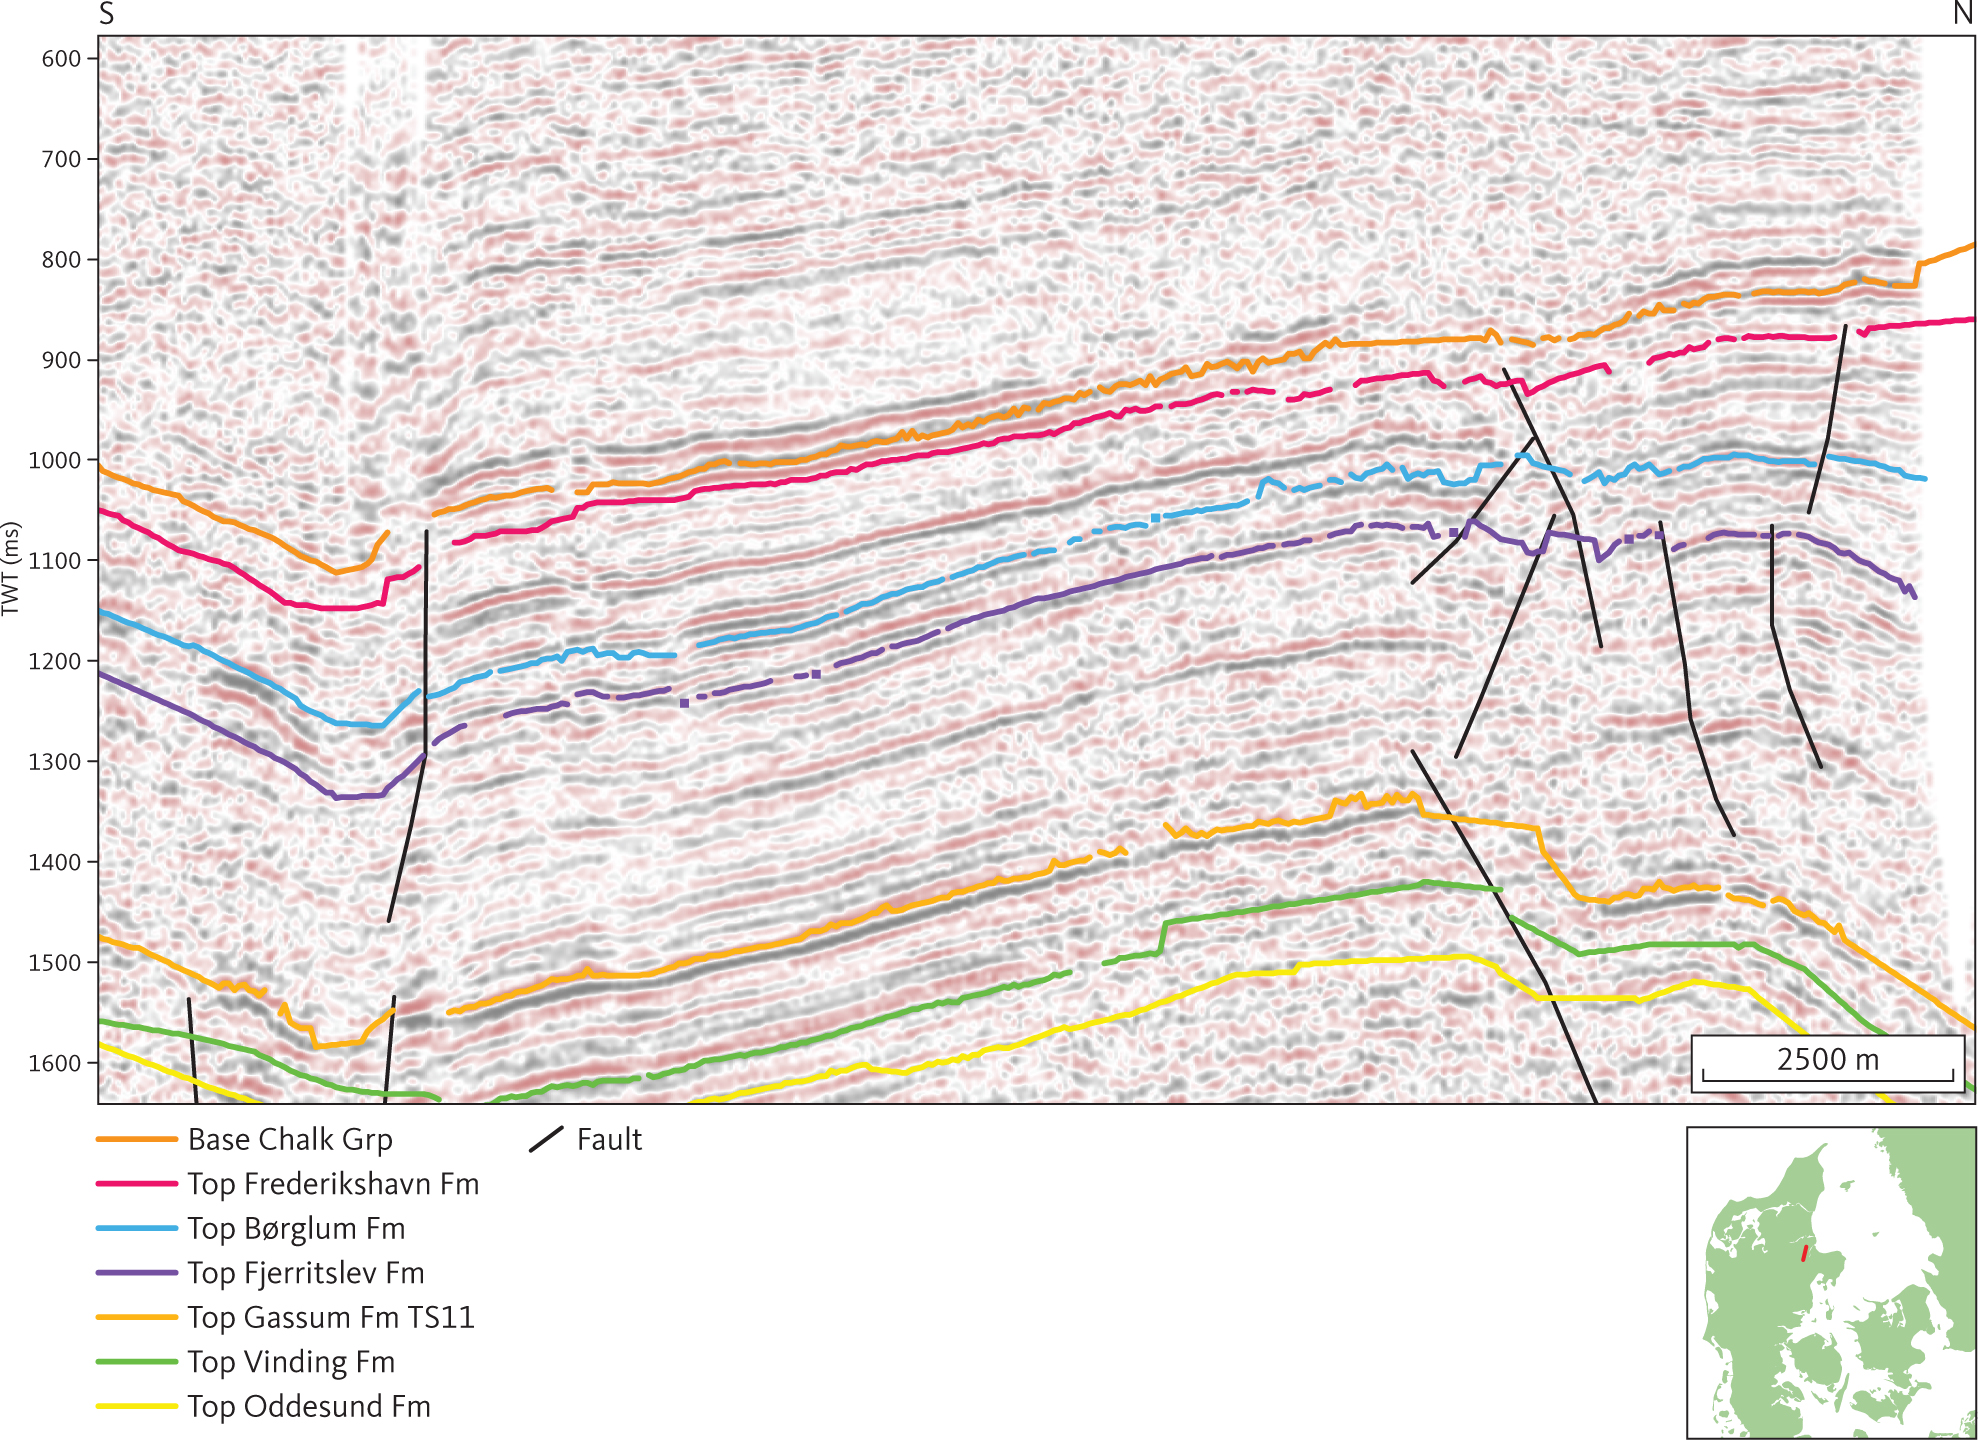
Fig. 18 Seismic section (DNJ-400) illustrating onlap of internal reflectors onto the base of unit D1 (see Section 3.3.1) in a rim-synclinal at the Gassum salt pillow. Inserted map shows the location of the profile.
3.3.1.4 Isochore of unit D1
An isochore map of unit D1 is presented in Fig. 19. The greatest thicknesses of the unit (c. 500–600 m) are observed in an elongated depocentre along the Sorgenfrei–Tornquist Zone. The large thicknesses observed in this elongated depocentre are associated with syn-depositional movements on faults (Fig. 11). Large thicknesses of unit D1 are also seen in local rim synclines within the salt-dome province in northern Jylland. Otherwise, the thickness of the unit is generally less than 175 m.
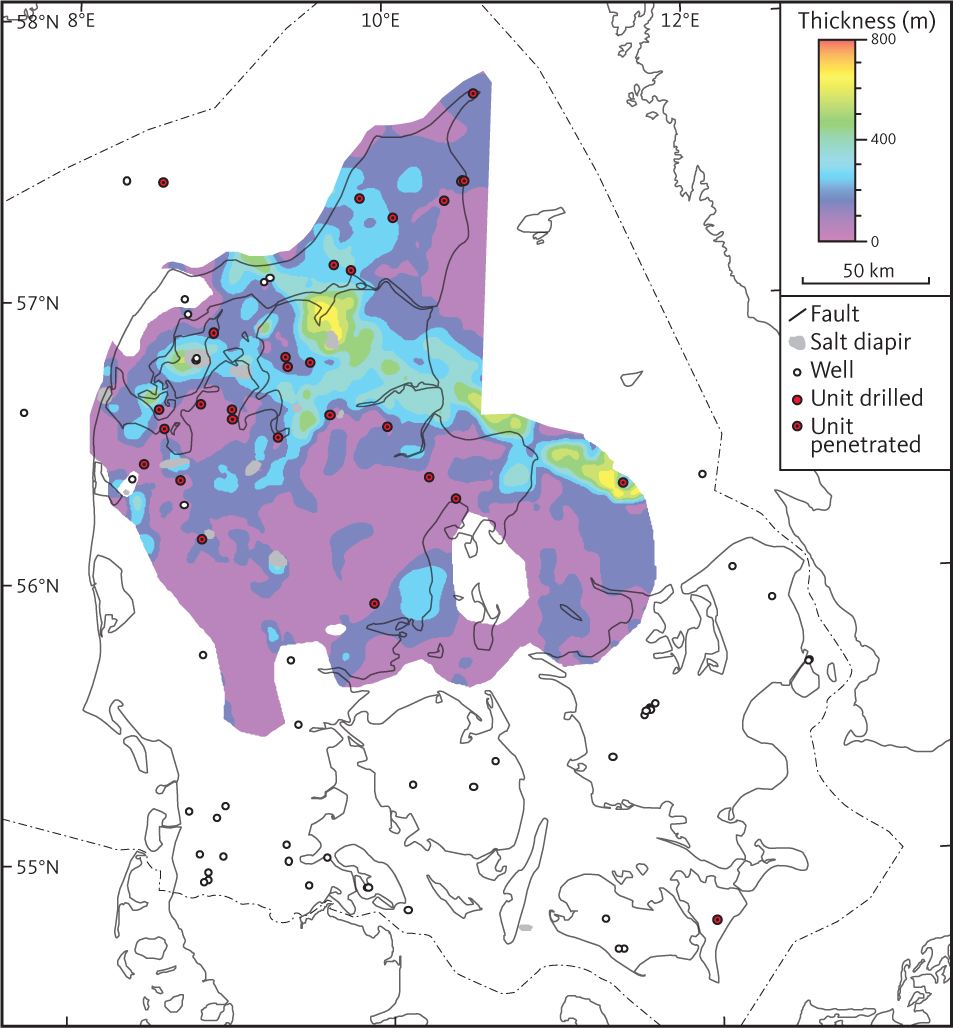
Fig. 19 Isochore map of seismic unit D1 (Frederikshavn Formation).
3.3.2 Seismic unit D2 – Børglum and Flyvbjerg Formations
3.3.2.1 Background and borehole data
The Børglum and Flyvbjerg Formations are both thin. In the relevant boreholes, the combined thickness of the two formations is mostly less than 100 m (Nielsen & Japsen 1991) corresponding to 2–4 seismic cycles. A seismic horizon correlating to the boundary between the Børglum and Flyvbjerg Formations, D2-a, is identified in a few seismic sections, but is not mapped systematically. The two formations are thus represented as one unit in this study, the seismic unit D2. In the Mors-1 and Fjerritslev-2 wells, the maximum drilled thicknesses of unit D2 are 147 m and 137 m respectively. Dark grey and greenish marine claystones represent the Børglum Formation (Michelsen 1978; Michelsen et al. 2003). The Flyvbjerg Formation comprises a mainly marine succession of sandstones, siltstones and claystones, and in the northern and eastern part of the study area, the upper part of the formation is dominated by sandstones that are frequently glauconitic and calcareous (Michelsen et al. 2003; Nielsen 2003). In the northern and central part of Jylland and in the Terne-1 borehole the unit D2 is present but are absent on the Ringkøbing–Fyn High and in the North German Basin (Fig. 6). Overall, the two formations do not extend as far south as the overlying Frederikshavn Formation (seismic unit D1). Identification of the Børglum and Flyvbjerg Formations is based on lithological and palaeontological data and petrophysical log interpretations. Overall, the petrophysical log patterns through the Børglum Formation reflect fairly clean claystones (e.g. high gamma-ray and low spontaneous potential response). Varying gamma-ray and spontaneous potential log values reflect a mixed lithology and a downward change to a sandier lithology at the base of the formation characterize the Flyvbjerg Formation. (Figs 20, 21; e.g. Michelsen 1978; Michelsen et al. 2003; Nielsen 2003).
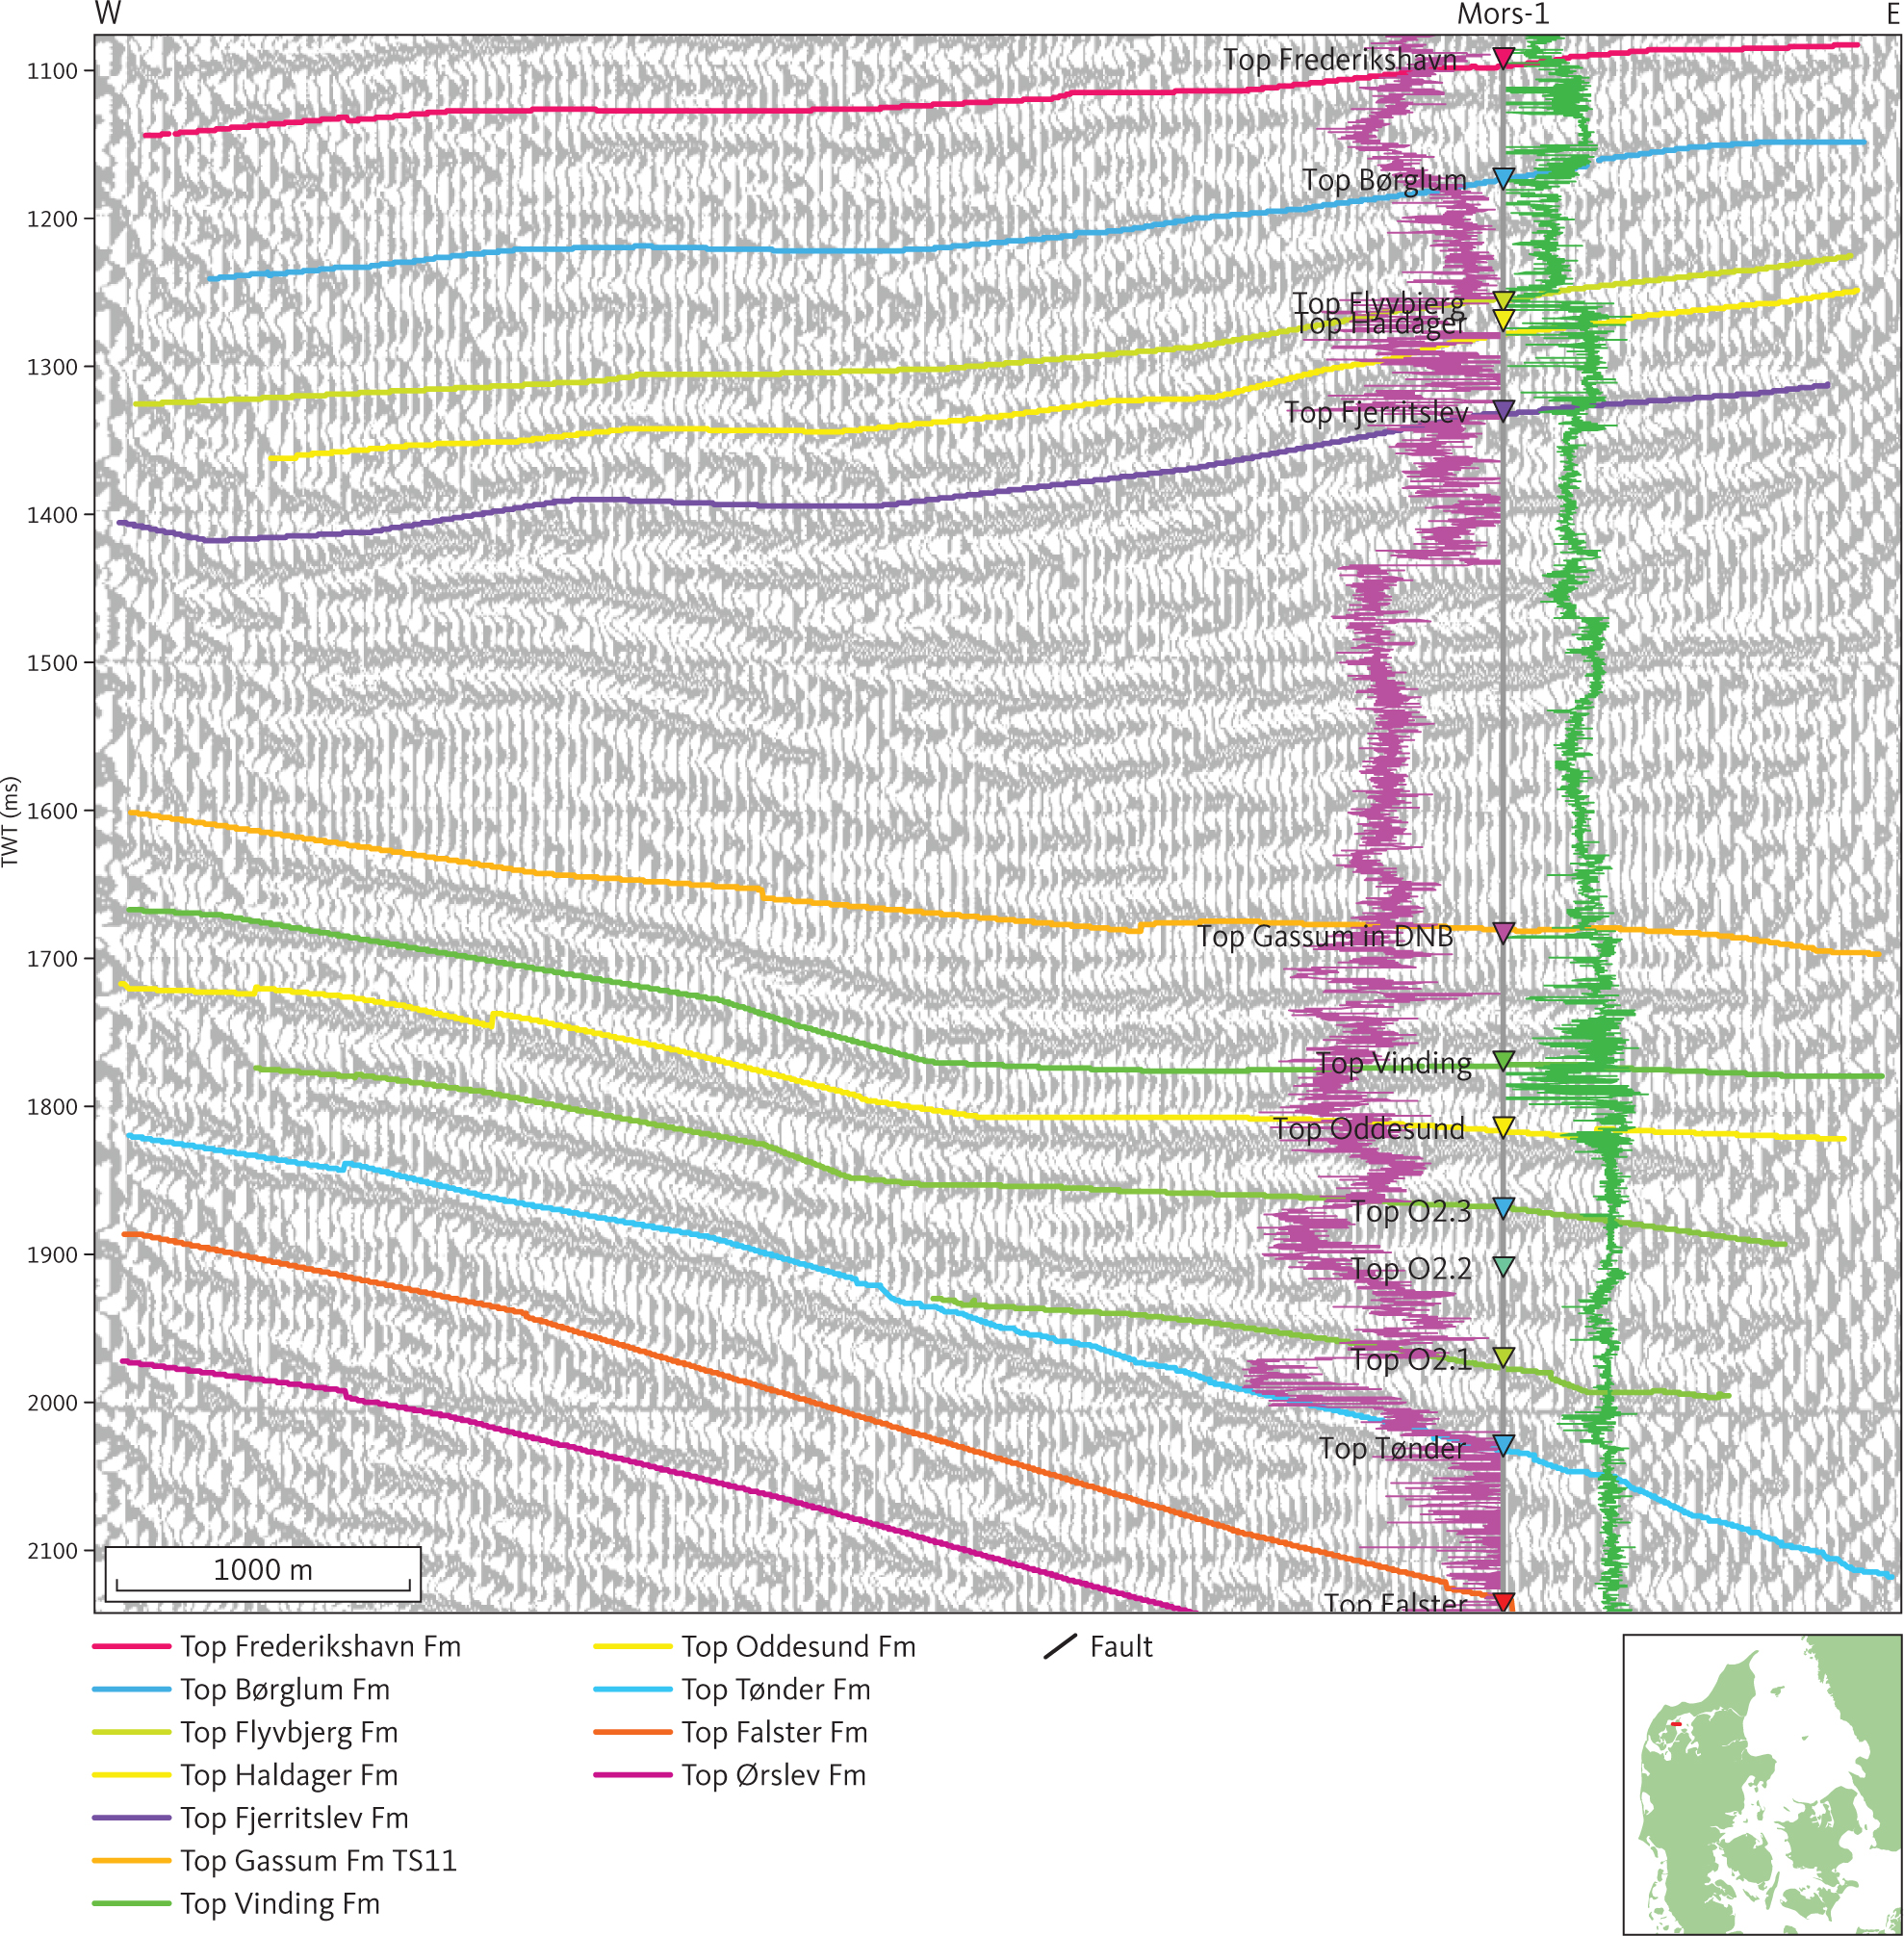
Fig. 20 Seismic section (PRKL-73248) illustrating the character of Upper and Middle Jurassic (seismic unit D1–D3; see sections 3.3.1–3.3.3) in the vicinity of the Mors-1 well. The gamma-ray and sonic logs are shown as purple and green logs, respectively, on either side of the Mors-1 well path with the highest values towards the well path. The top of the Flyvbjerg Formation is characterised by a downward change from shales into sandy sediments is seen as distinct excursions in the well logs. The corresponding seismic horizon, D2-a, is not mapped systematically. A short period of Early Jurassic subsidence in the area around the Mors-1 well is indicated by onlap onto a horizon that correlates approximately with SB15 of Nielsen (2003; green horizon in the Fjerritslev Formation). The O2.1 and O2.3 evaporite beds of Bertelsen (1980) tie with internal reflectors (shown as green lines) within the Oddesund Formation (seismic unit F2). DNB: Danish Norwegian Basin. Inserted map shows the location of the profile.
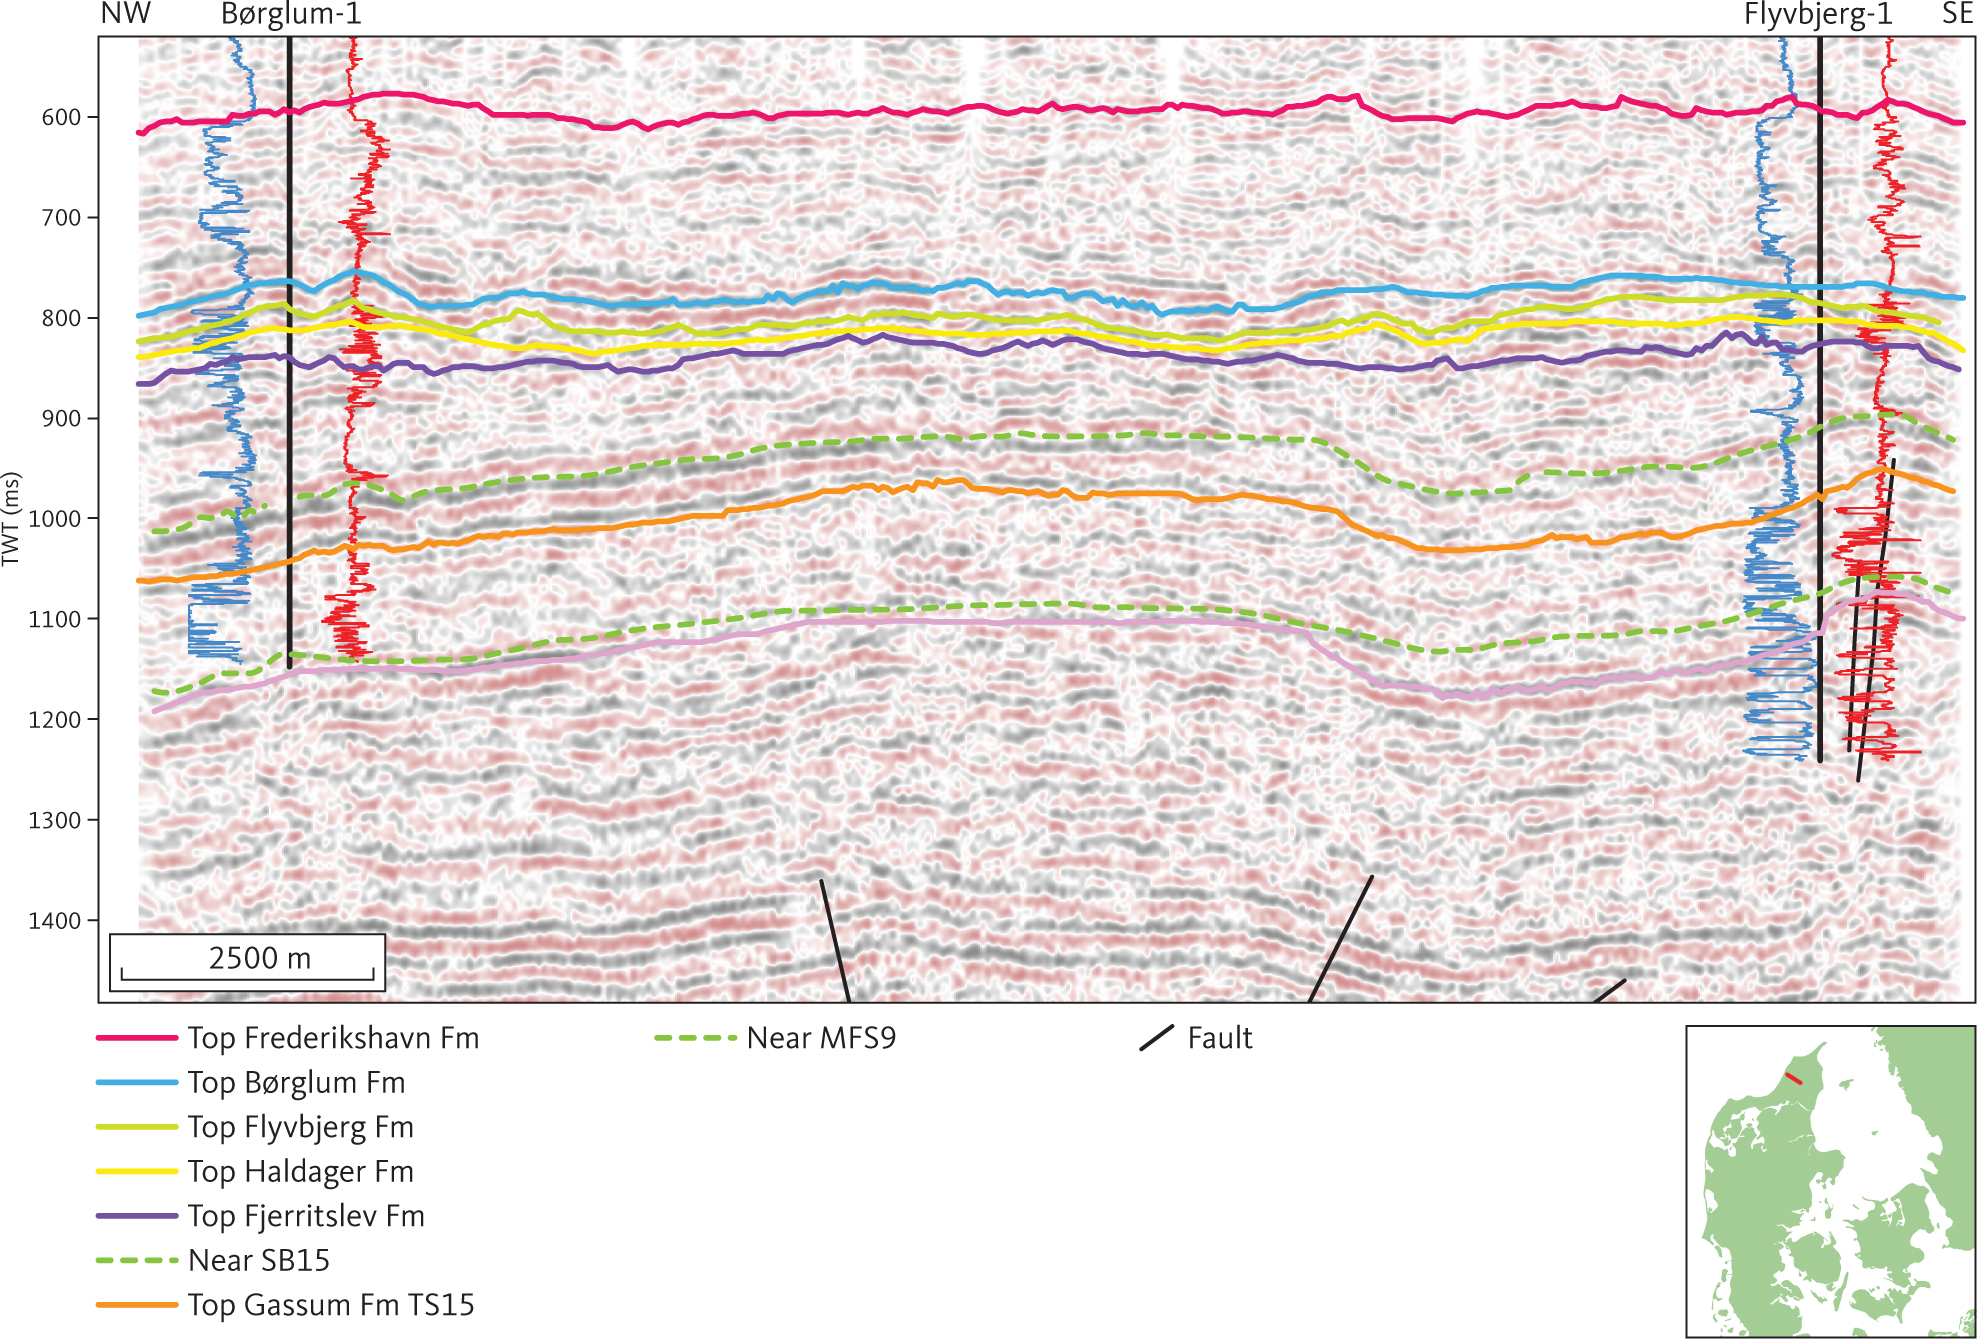
Fig. 21 Seismic section (DNJ-200) through the Børglum-1 and Flyvbjerg-1 wells, the type sections of the Børglum and Flyvbjerg Formations. This figure also illustrates the character of the Fjerritslev and Gassum Formations (units E1 and E2; see sections 3.4.1–3.4.2) on the Skagerrak–Kattegat Platform. Low angle clinoforms are evident in the lower part of the Gassum Formation, unit E2. Stippled green horizons tie to sequence stratigraphic surfaces SB15 and MFS9 of Nielsen (2003). The spontaneous potential and short space resistivity (10” and 16”) logs are shown as blue and red lines, respectively, on either side of the well paths with highest values to the right. Inserted map shows the location of the profile.
3.3.2.2 Top of unit D2
A map of the depth to the seismic horizon representing the top of unit D2 is shown in Fig. 22. The seismic horizon is reasonably well defined as a continuous to semi-continuous reflection of mainly moderate to high amplitude. The horizon is generally parallel to the top of the unit. Onlap of internal reflections of unit D1 onto the top of unit D2 is seen locally in connection with local lows in the vicinity of salt structures (Fig. 18). These deeps are apparently directly controlled by salt flow, but a direct coupling to basement tectonics is not observed. However, it is still assumed that the reflection configuration in these deeps is associated with the onset of the rift phase that terminated with the formation of a major unconformity.
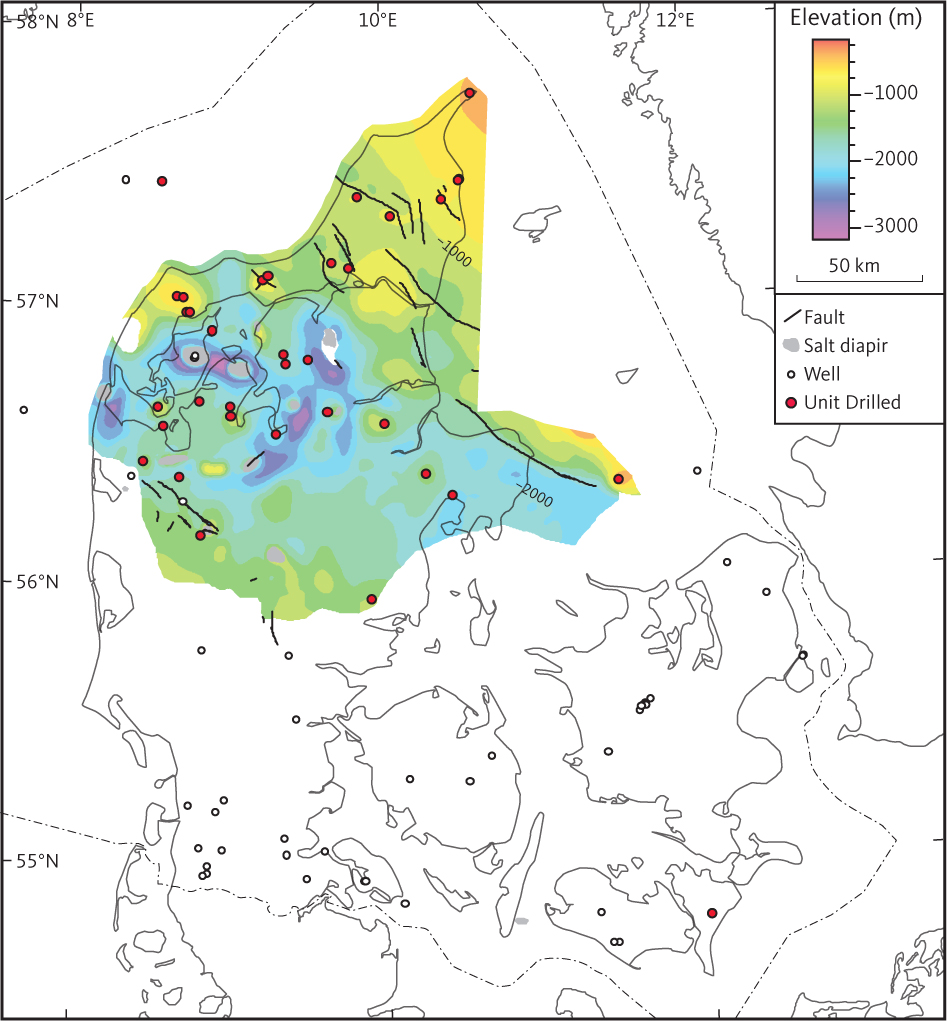
Fig. 22 Depth to the top of seismic unit D2 (Børglum and Flyvbjerg Formations).
3.3.2.3 D2 - a seismic horizon
The D2-a seismic horizon is more or less equivalent to the top of the Flyvbjerg Formation in a few boreholes in northern Jylland. At Vedsted-1 and Sæby-1, the D2-a seismic horizon is picked as one of several fairly continuous reflections of moderate amplitude within unit D2. Most characteristic is the D2-a seismic horizon around Sæby-1, where it is the uppermost reflection of a series of moderate to high amplitude reflections connected with sandstones of the Flyvbjerg and Haldager Sand Formations recorded in the Sæby-1 well. Identification of the D2-a seismic horizon is only realistic in data of good quality, and it has consequently not been mapped.
3.3.2.4 Seismic character of unit D2
Unit D2 is characterised by a few mostly parallel or sub-parallel reflections of low to moderate amplitude and fair continuity (Fig. 20). At the location of the type wells, Børglum-1 and Flyvbjerg-1, the unit is just discernible on the seismic sections passing through the borehole location (Fig. 21).
3.3.2.5 Isochore of seismic unit D2
The mapped thickness of the unit is up to about 100–200 m in the northern part of the study area, while it is about 50 m (just discernible in the seismic data) in the southern part of the area (Fig. 23). Thicknesses of more than 200 m are seen within rim-synclines associated with salt structures in the salt dome province in NW Jylland (Boldreel 1985).
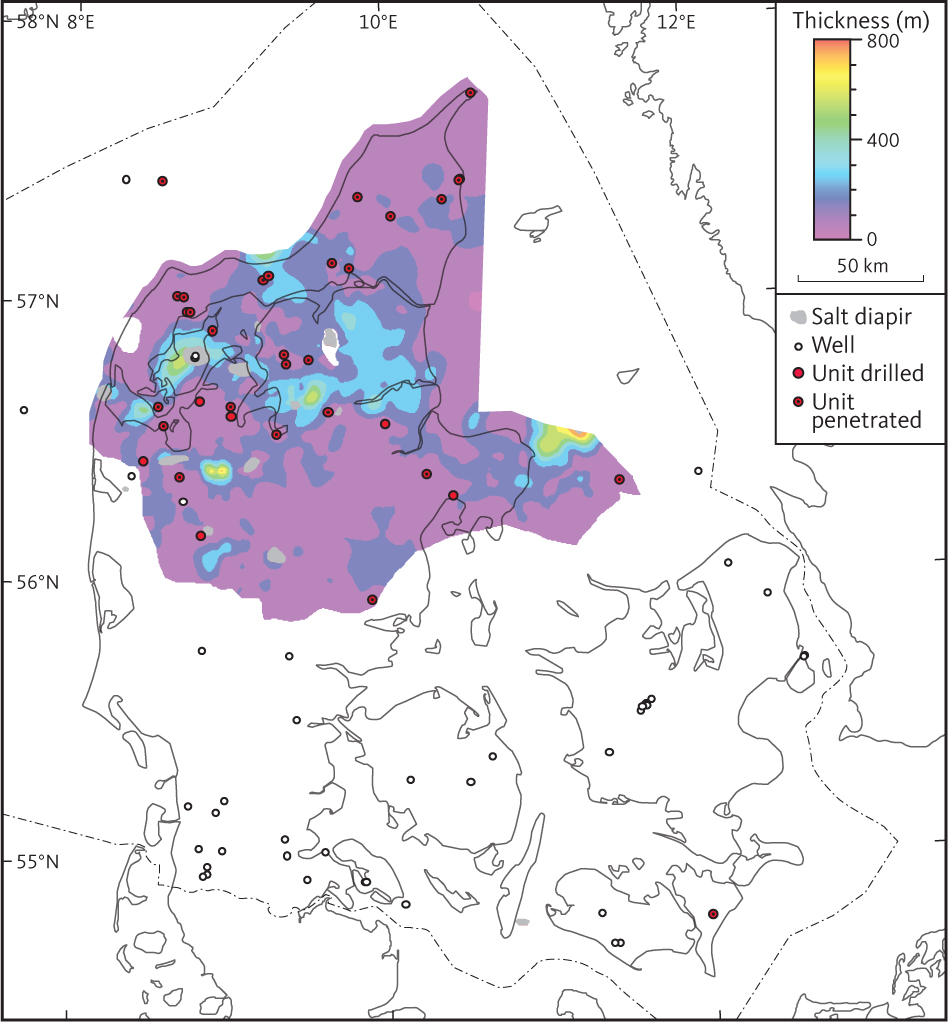
Fig. 23 Isochore map of seismic unit D2 (Børglum and Flyvbjerg Formations).
3.3.3 Seismic unit D3 – Haldager Sand Formation
3.3.3.1 Background and borehole data
Unit D3 corresponds to the Haldager Sand Formation, which consists of sandstones with subordinate siltstones and claystones, and locally with coal beds (Michelsen 1978; Michelsen et al. 2003; Nielsen 2003). The formation is present in the northern part of the Danish Basin where the drilled thickness in boreholes is generally less than 50 m. Maximum thicknesses of the formation of 155 m and 173 m are observed in the type well Haldager-1 and in the Terne-1 borehole, respectively (Nielsen & Japsen 1991). In central Jylland, the formation is irregularly distributed being present in some wells and missing in others, which reflects development of salt structures (Zechstein salt) that locally influenced accommodation space at the time of deposition or caused later erosion or penetration of the formation. Identification of the Haldager Sand Formation is based on lithological and palaeontological data and petrophysical log interpretations. Overall, the petrophysical log patterns through the formation reflect sandstones interbedded with siltstones and claystones, best seen on gamma-ray and spontaneous potential logs (Fig. 11; Michelsen 1978).
3.3.3.2 Top of unit D3
A map of the depth to the seismic horizon representing the top of unit D3 is shown in Fig. 24. The top of the unit is mostly identified in a succession of poorly resolved reflections of fairly low amplitude and moderate continuity. The horizon is constrained in boreholes, which are mostly less than 25 km apart. The base of unit D2 is therefore considered reasonably well constrained.
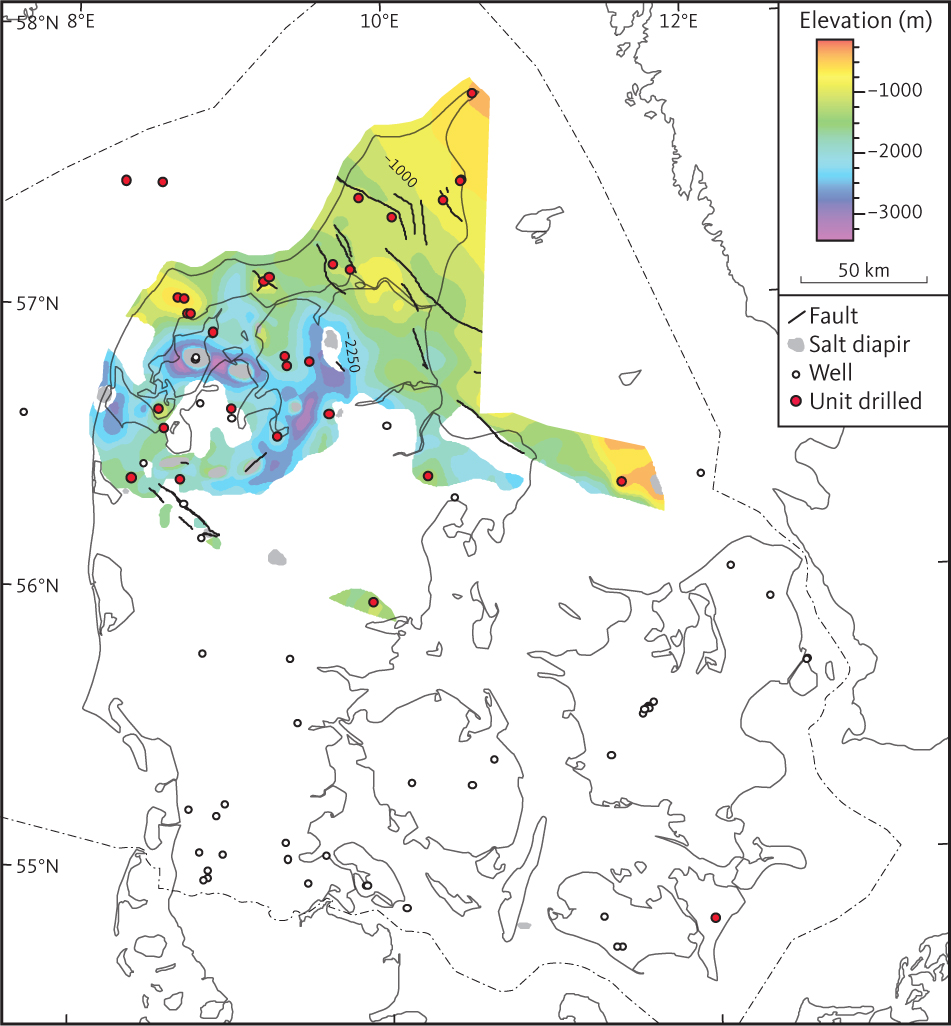
Fig. 24 Depth to the top of seismic unit D3 (Haldager Sand Formation).
3.3.3.3 Isochore of unit D3
Unit D3 is generally fairly thin (c. 50 m), just discernible within the seismic resolution, and the thickness appears to be fairly constant across major regional fault trends (Fig. 25). The thickness is up to about 100–200 m in the Fjerritslev Trough and around some salt diapirs. A few isolated occurrences of the Haldager Sand Formation in the southern part of the Danish Basin are inferred from the seismic interpretation and are presumably related to syn-depositional salt withdrawal forming rim-synclines. One of these occurrences is confirmed by the Horsens-1 well, penetrating 4 m of Haldager Sandstone Formation. Unit D3 is absent above most diapirs, and local depth minima are seen in relation to the salt pillows.
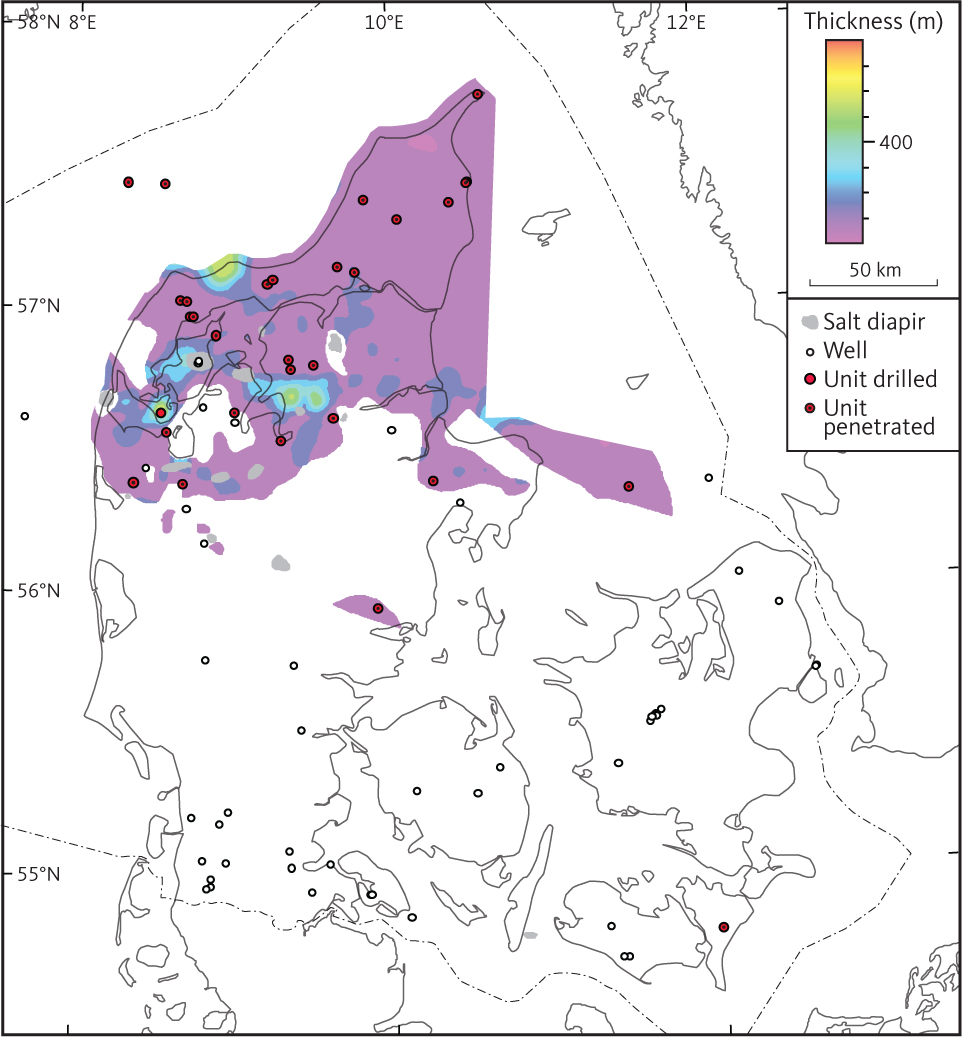
Fig. 25 Isochore map of Unit D3 (Haldager Sand Formation).
3.4 Unit E – Fjerritslev and Gassum Formations
Seismic unit E is subdivided into two subunits, E1 and E2, approximately corresponding to the Fjerritslev and Gassum Formations, respectively. In the northern and eastern part of the study area, the upper part of the sandy Gassum Formation forms an overall backstepping pattern (Nielsen 2003). Throughout the study area, the Gassum Formation gives way to the offshore mudstones of the Fjerritslev Formation, and the lower part of the Fjerritslev Formation is seen as mudstone wedges intercalated with the youngest part of the Gassum Formation sandstones (Bertelsen 1978; Nielsen & Japsen 1991; Michelsen et al. 2003; Nielsen 2003). Therefore, three different seismic horizons, base E1’, base E1’’ and base E1’’’ are interpreted to represent the boundary between Gassum and Fjerritslev Formations in different parts of the study area. Similarly, the boundary between the Vinding Formation and the Gassum Formation seems to be somewhat diachronous (Bertelsen 1978; Michelsen et al. 2003; Nielsen 2003), and two different seismic horizons are therefore interpreted to approximately correspond to the base of Gassum Formation in different parts of the area, base E2 and base E2’ (Fig. 26).
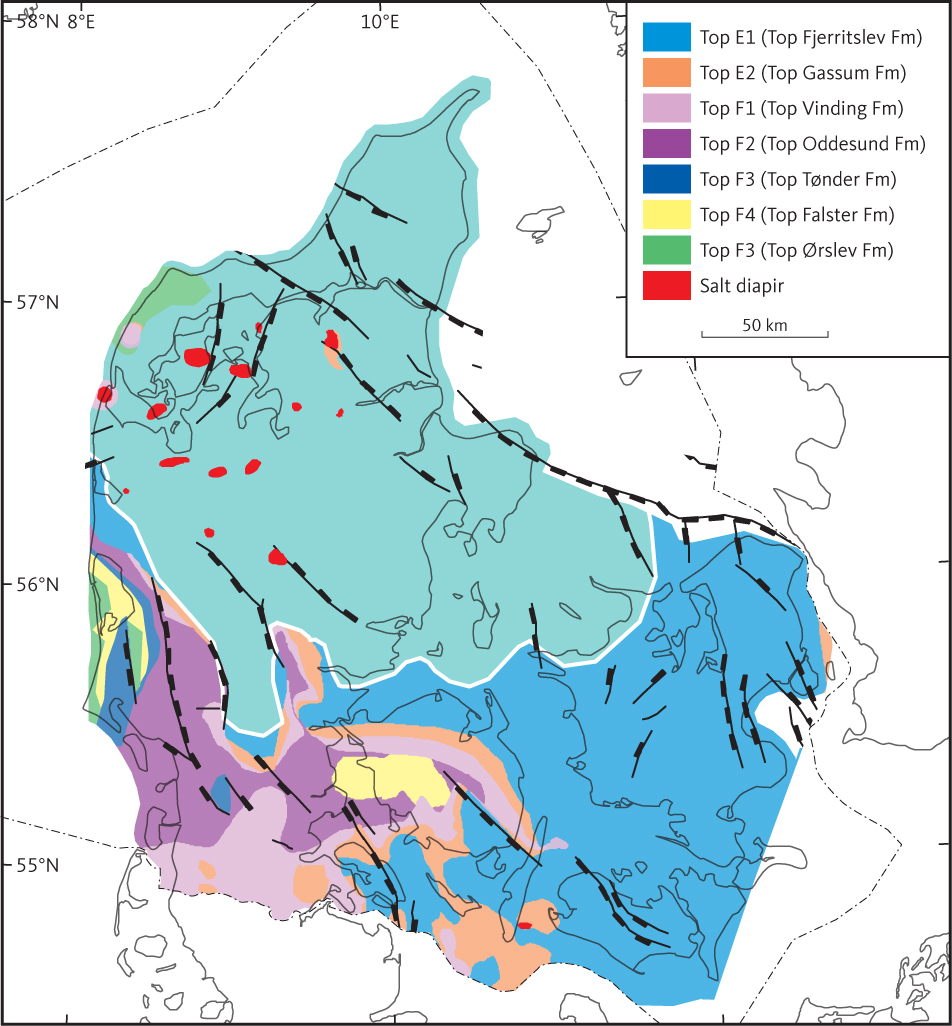
Fig. 26 Subcrop below Haldager Sand Formation and the Middle Cimmerian Unconformity. The white line indicates where the Middle Cimmerian Unconformity is truncated and overtaken by the Late Cimmerian Unconformity.
3.4.1 Seismic Unit E1 – Fjerritslev Formation
3.4.1.1 Background and borehole data
Unit E1 corresponds approximately to the Fjerritslev Formation and is present throughout most of the Skagerrak–Kattegat Platform, the Sorgenfrei–Tornquist Zone and the Danish Basin. It is also present in the Brande Trough, the northern continuation of the Glücksburg Graben and the eastern part of the North German Basin (Fig. 6; Michelsen 1978; Nielsen & Japsen 1991; Michelsen et al. 2003; Nielsen 2003). The base of the Fjerritslev Formation is diachronous (e.g. Michelsen et al. 2003), and the identification of the Fjerritslev Formation in wells is accordingly based on lithological and palaeontological data and petrophysical logs. At the type locality, the Fjerritslev-2 borehole, the formation is about 900 m thick and comprises marine offshore claystones, mudstones and calcareous claystones with siltstones, while fine-grained sandstones form a minor constituent (Michelsen 1978; Michelsen et al. 2003). Overall, the petrophysical logs through the Fjerritslev Formation are characterised by patterns indicative of fairly homogeneous claystones (as depicted by SP and GR logs; Fig. 27; see Michelsen (1989) for a detailed description of the log signatures of the various members of the formation).
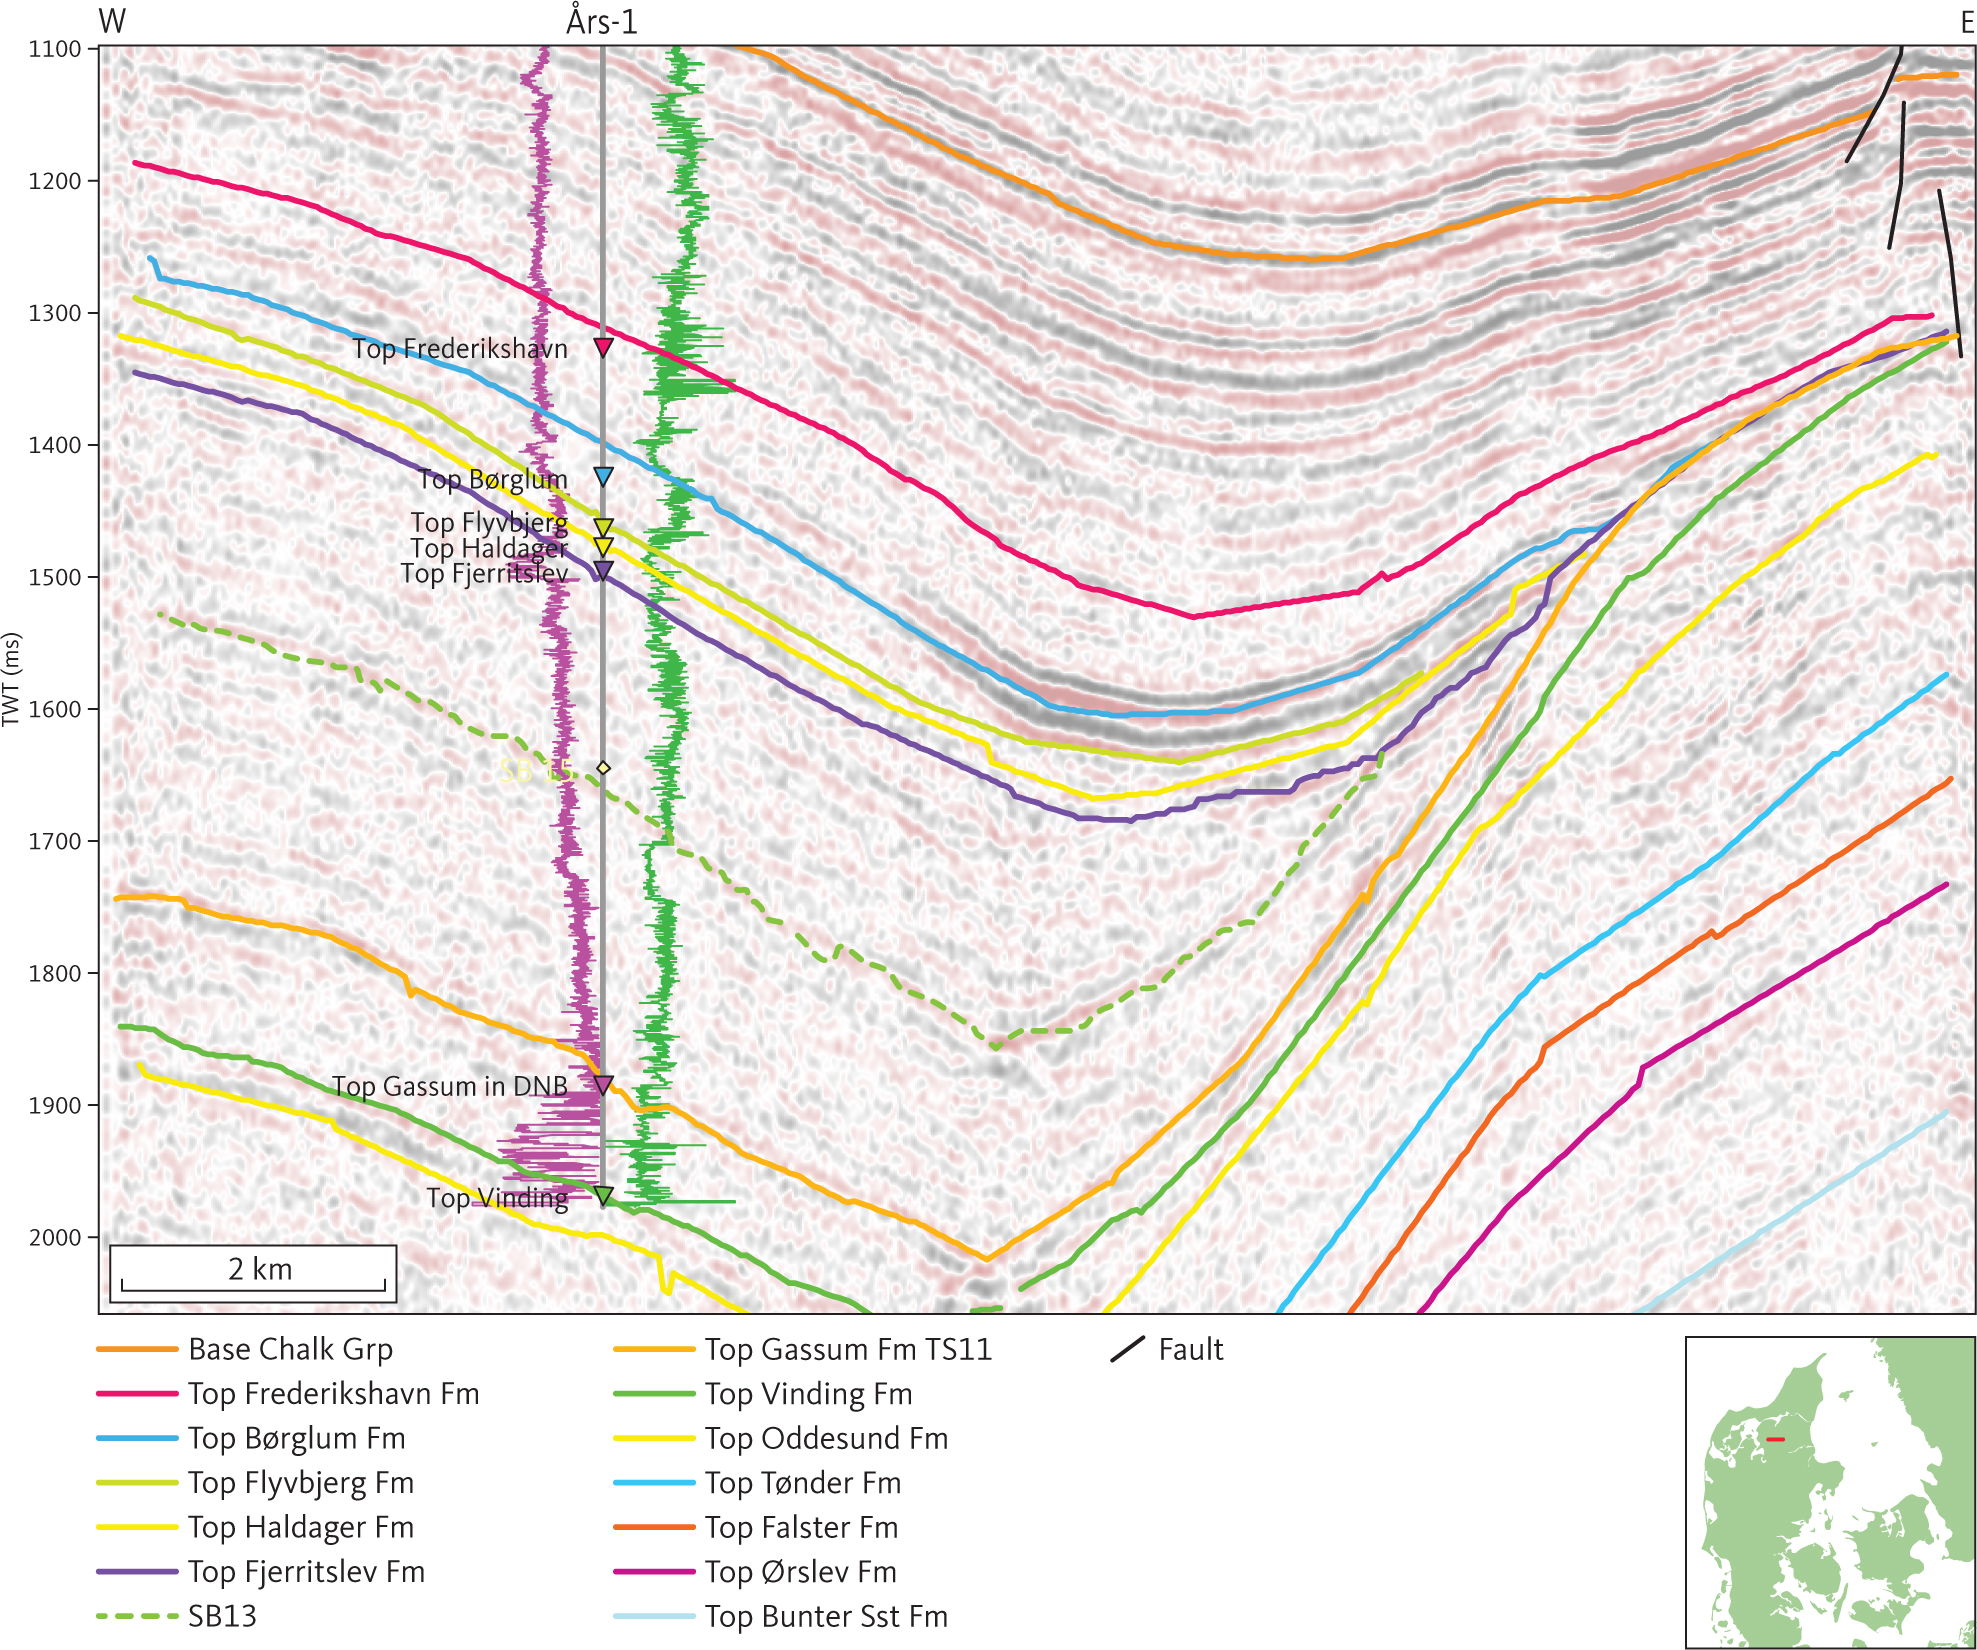
Fig. 27 Seismic section (D82_3) at Års-1 illustrating pinch out of the Fjerritslev Formation (unit E1; see Section 3.4.1) towards the east due to syn-depositional salt movements related to structure at the right part of the section. The seismic surface internal in unit E1 is tied to MFS14 Nielsen (2003) and shown as a stippled green line. The gamma-ray and sonic logs are shown as purple and green lines, respectively, on either side of the Års-1 well path, with highest values closest to the well trace. Inserted map shows the location of the profile.
3.4.1.2 Unconformity between units D and E
In the central part of the study area, where unit D is present, the base of unit D/top of unit E corresponds to an unconformity (Figs 19, 26). In the Sorgenfrei–Tornquist Zone, however, where deposition continued across the Early–Middle Jurassic boundary, the boundary is a conformity of Aalenian age (Nielsen 2003). Moving southwards, across the Danish Basin, Ringkøbing–Fyn High and into the northernmost part of the North German Basin, the hiatus between unit E and unit D expands. Furthest to the south in the study area, units D are absent and the unconformity at the base of unit D merges with the unconformity at the base of unit C. The result being an angular unconformity cutting into underlying units, F1–F5.
Overall, the erosional top of unit E dips toward the south-west (Fig. 24), and local depth maxima are located in rim-synclines around diapirs in the salt dome province.
3.4.1.3 Seismic character of unit E1
At the Vedsted-1 borehole, about 25 km from the type locality of the Fjerritslev Formation, unit E1 is mostly characterised by continuous horizons of high to moderate amplitude reflections, which subdivide the unit into packages with complex reflection patterns and/or clinoforms (Fig. 28). Seismic horizons correlating with sequence boundaries identified by Nielsen (2003) and with the top of the Fjerritslev F-I and F-II members are seen internally in unit E1. Rapid deepening of rim synclines in the vicinity of salt structures is indicated by internal onlap surfaces tying approximately to sequence boundaries SB15 and SB13 of Nielsen (2003; Figs 20, 29). The uncomformity cutting F1–F5 is seen in Fig. 30.
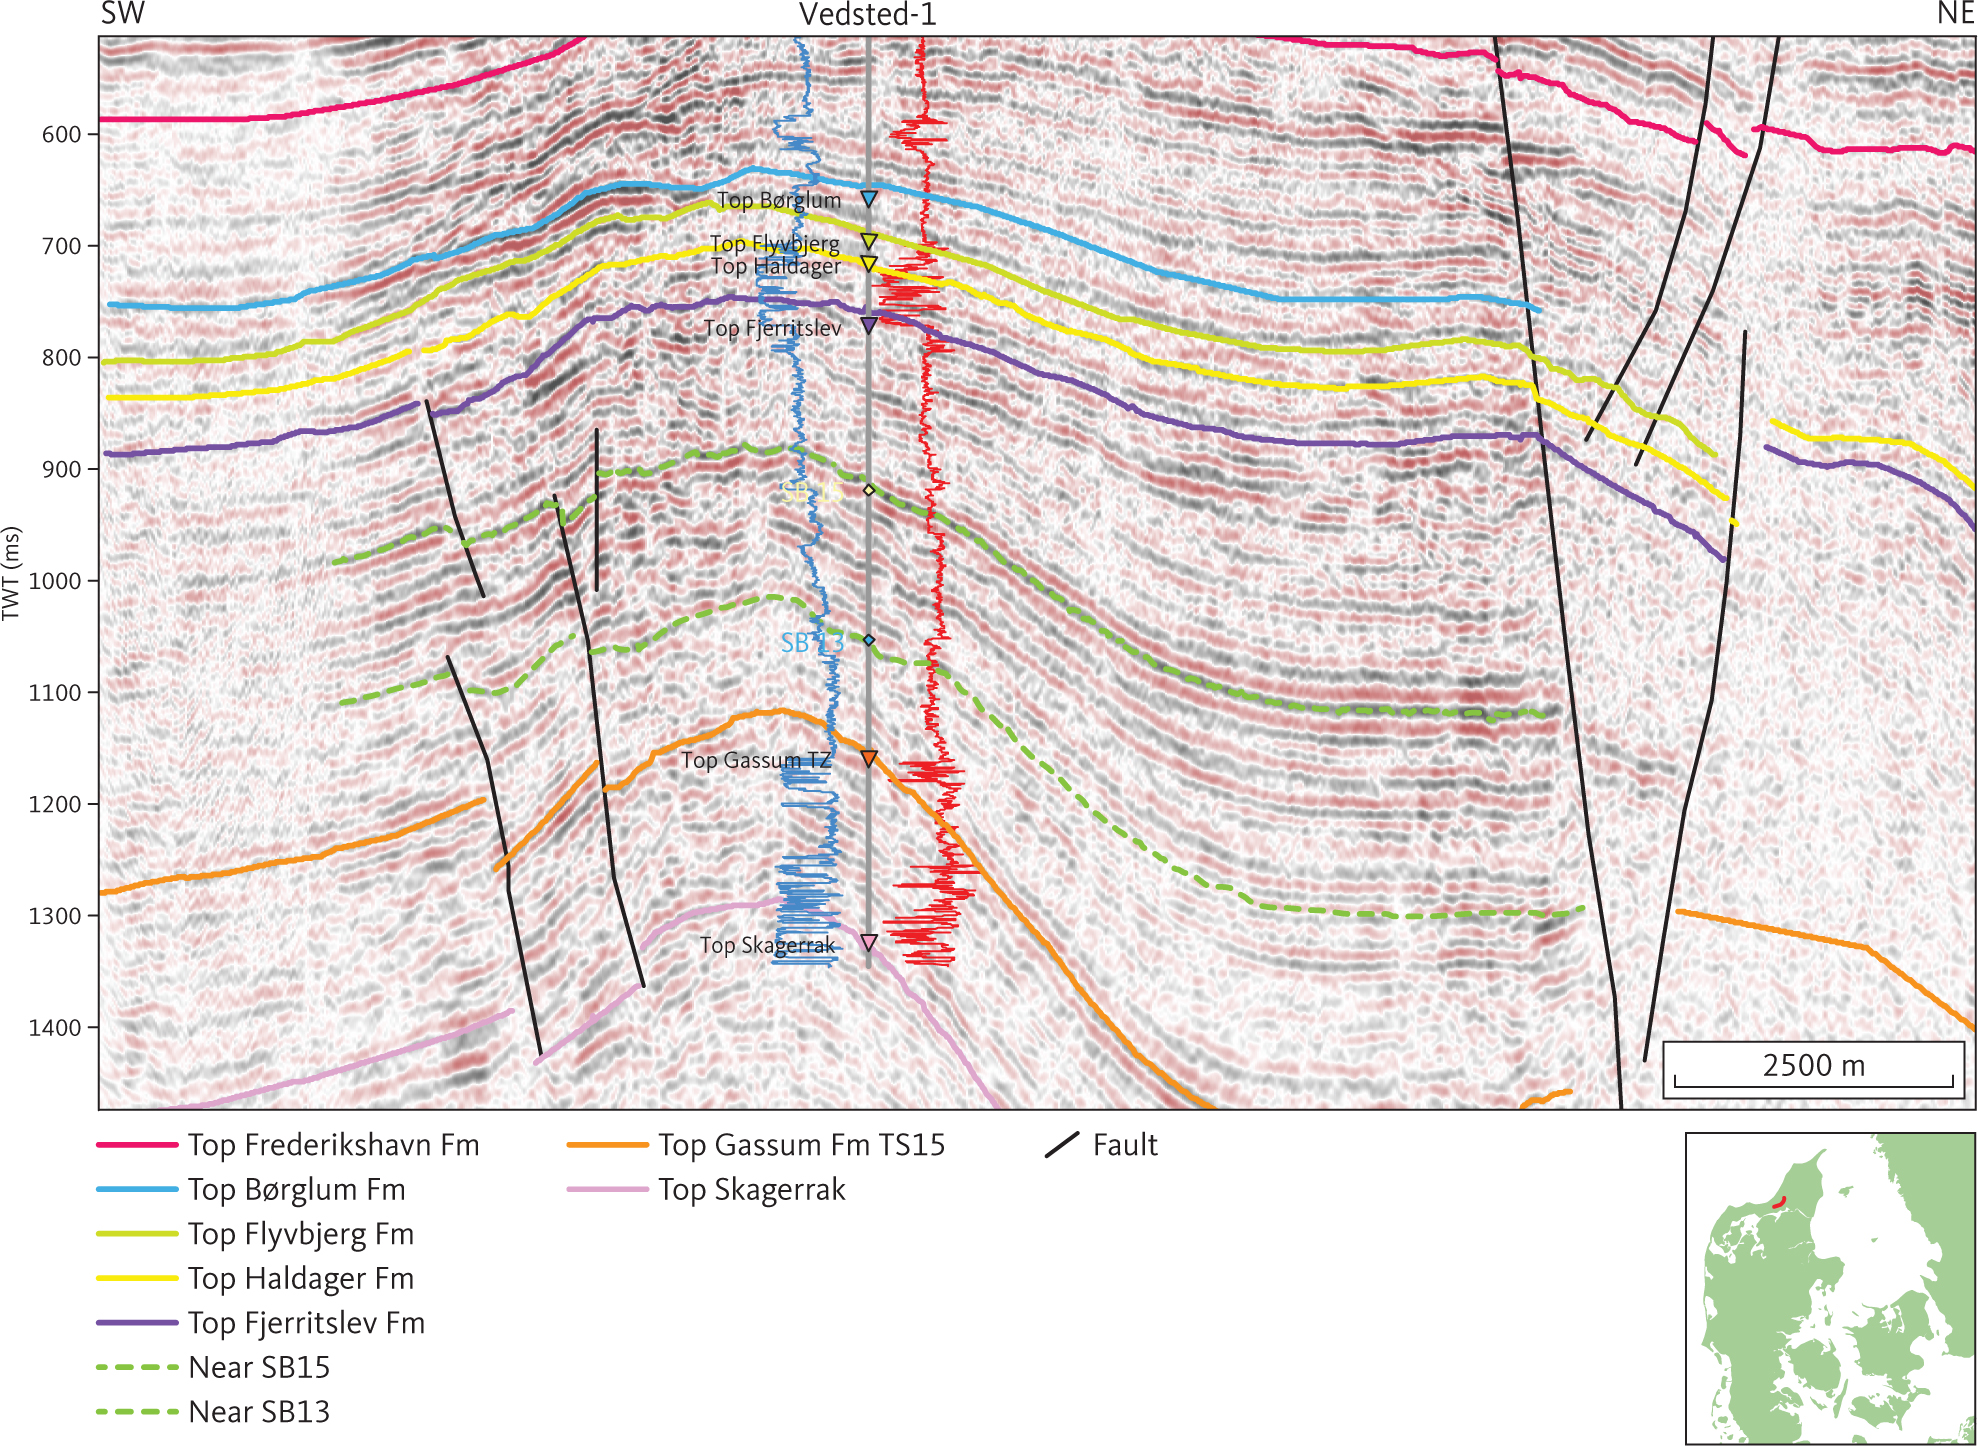
Fig. 28 Seismic section (08VAT-03) at the Vedsted-1 well illustrating the character of the Fjerritslev Formation (unit E1; see Section 3.4.1) in the Sorgenfrei–Tornquist Zone. Horizons within unit E1 are tied to sequence stratigraphic surfaces SB13 and SB15 of Nielsen (2003) and are shown as stippled lines. Note packages internal in unit E1 characterised by complex reflection pattern and clinoforms. The spontaneous potential and short space resistivity (16”) logs are shown as blue and red lines, respectively, on either side of the Vedsted-1 well path with highest values to the right. Inserted map shows the location of the profile.
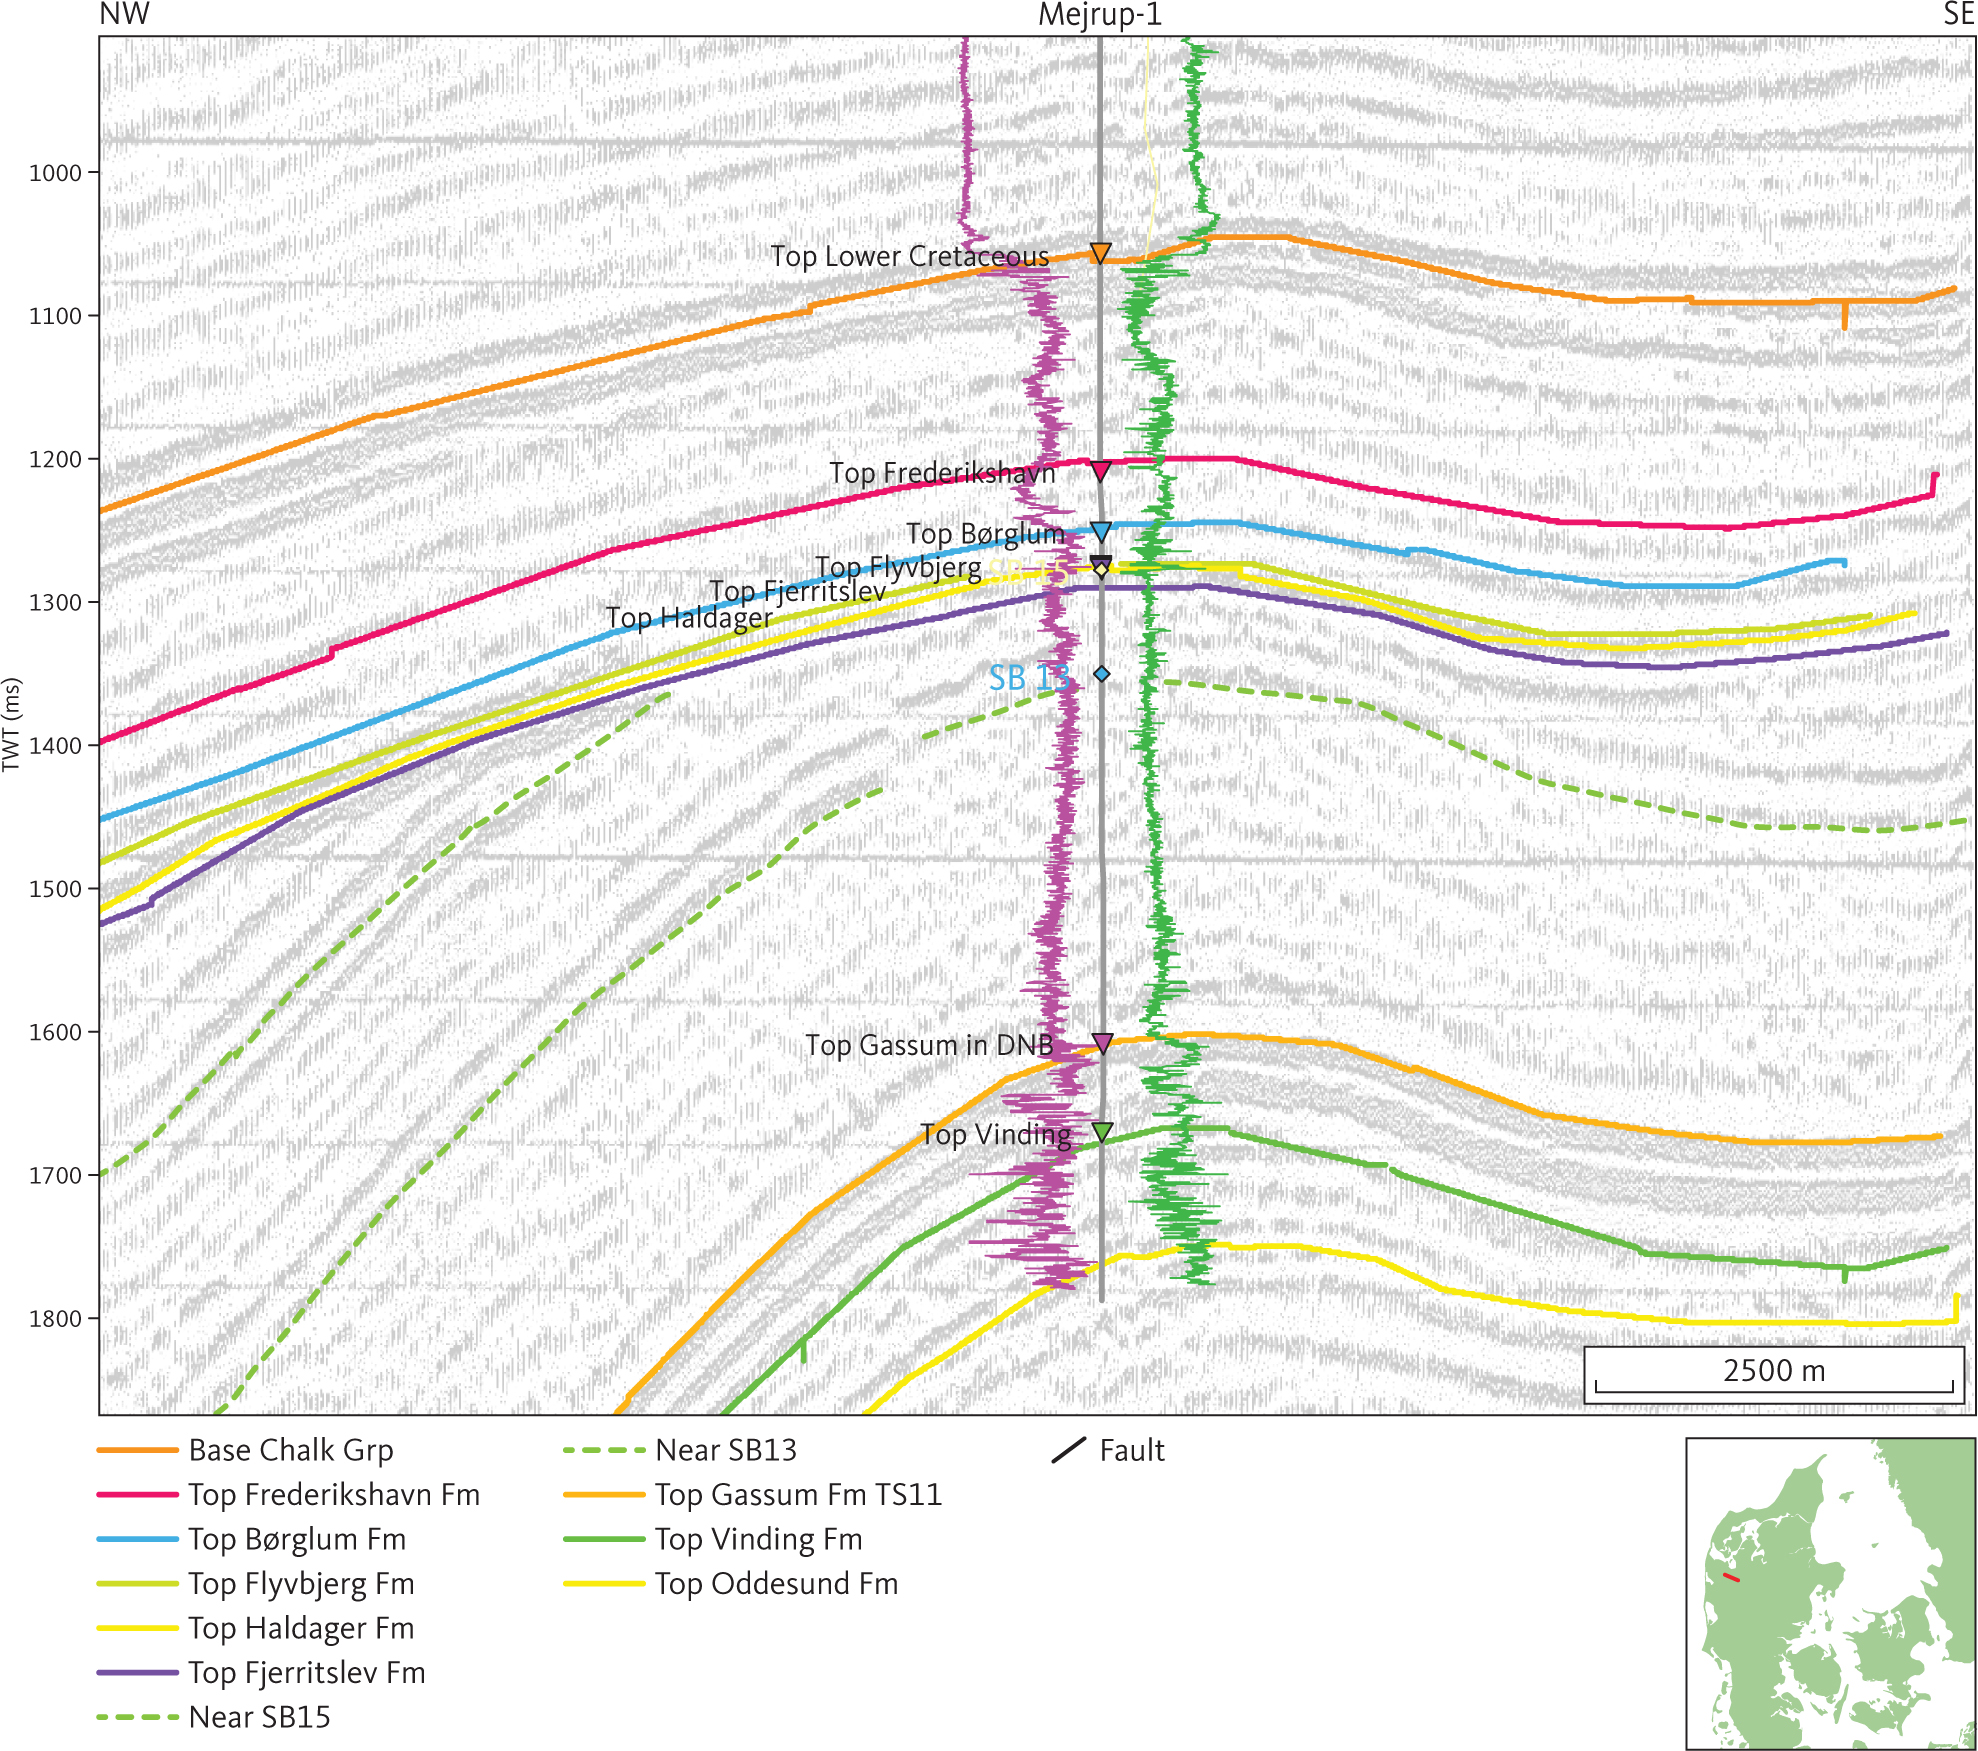
Fig. 29 Seismic section (PH85D015) through Mejrup-1 illustrating the character of the Middle Cimmerian Unconformity, truncating the Fjerritslev Formation (unit E1; see Section 3.4.1), in central Jylland. The seismic surfaces internally in Fjerritslev Formation correlate approximately with SB13 and SB15 of Nielsen (2003) and are shown as stippled green lines. The gamma-ray and sonic logs are shown as purple and green lines, respectively, on either side of the Mejrup-1well path, with highest values closest to the well trace. DNB: Danish Norwegian Basin. Inserted map shows the location of the profile.
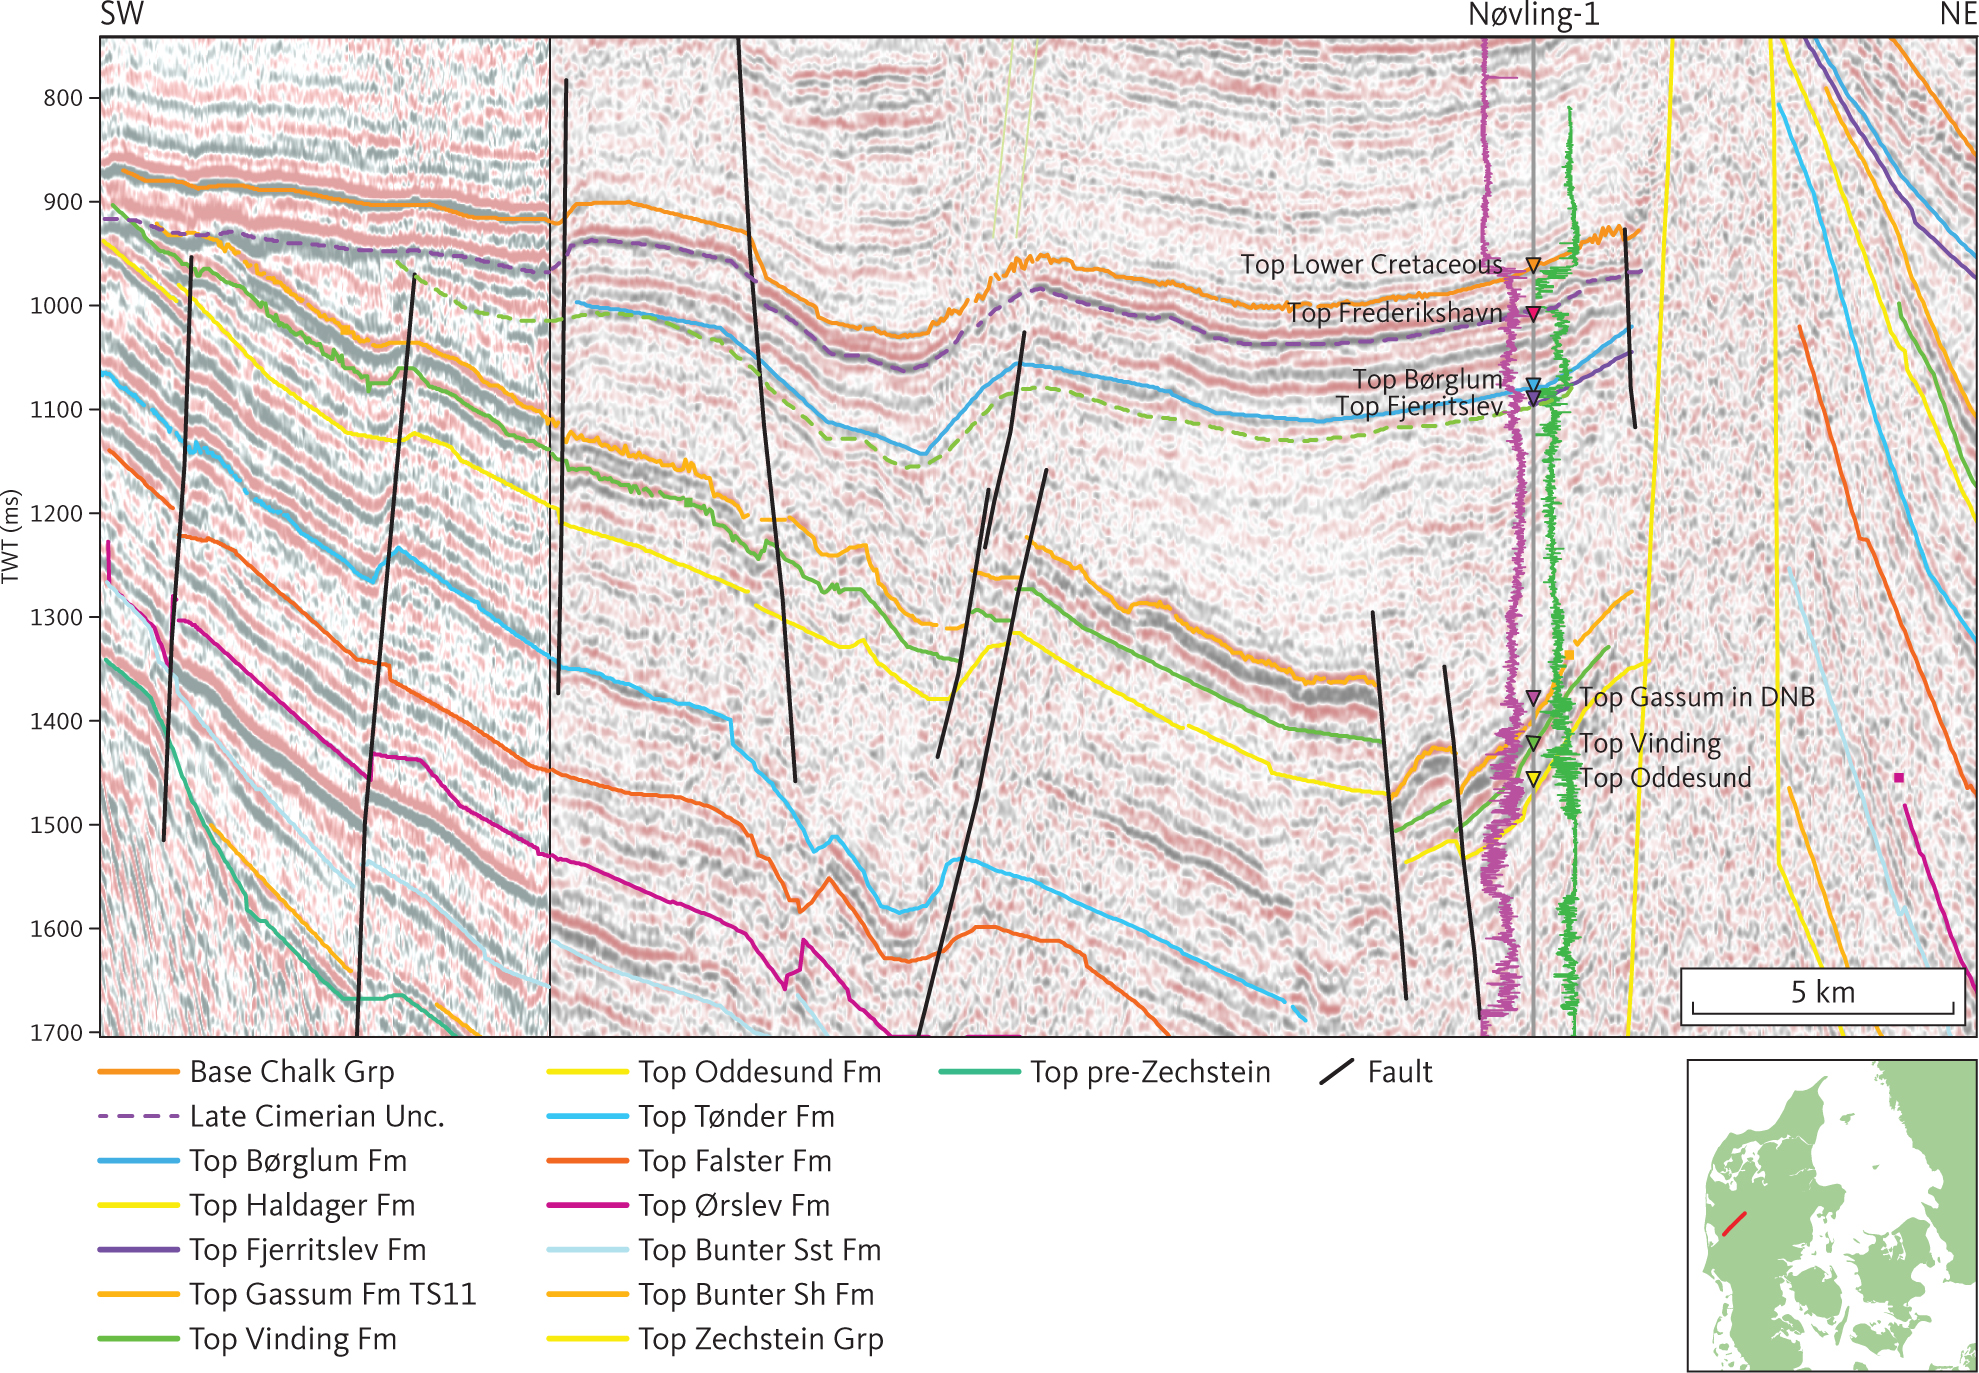
Fig. 30 Composite seismic section (DCJ-2 and DNJ-15) illustrating the Late Cimmerian Unconformity truncating the Middle Cimmerian Unconformity north of the Ringkøbing–Fyn High. Note that the unit E1 (Fjerritslev Formation; see Section 3.4.1) pinches out toward the high, while unit E2 (Gassum Formation; see Section 3.4.2) is of constant thickness until it is truncated. This demonstrates that the Triassic extended far onto, possibly across, the high prior to initial erosion during formation of the Middle Cimmerian Unconformity (e.g. Nielsen 2003). The gamma-ray and sonic logs are shown as purple and green lines, respectively, on either side of the Nøvling-1 well path, with highest values closest to the well trace. DNB: Danish Norwegian Basin. Inserted map shows the location of the profile.
3.4.1.4 Isochore of unit E1
In unit E1, the greatest thicknesses (more than 1000 m) are found in the Fjerritslev Trough, in the Himmerland Graben and close to some of the salt diapirs in the northern part of the Danish Basin (Fig. 31). On the Skagerrak Platform and where it is found in the North German Basin, the formation is fairly thin (250 m). Significant changes in the thickness of unit E1 are seen in relation to salt mobilisation related to movements along regional faults (e.g. Fig. 29).
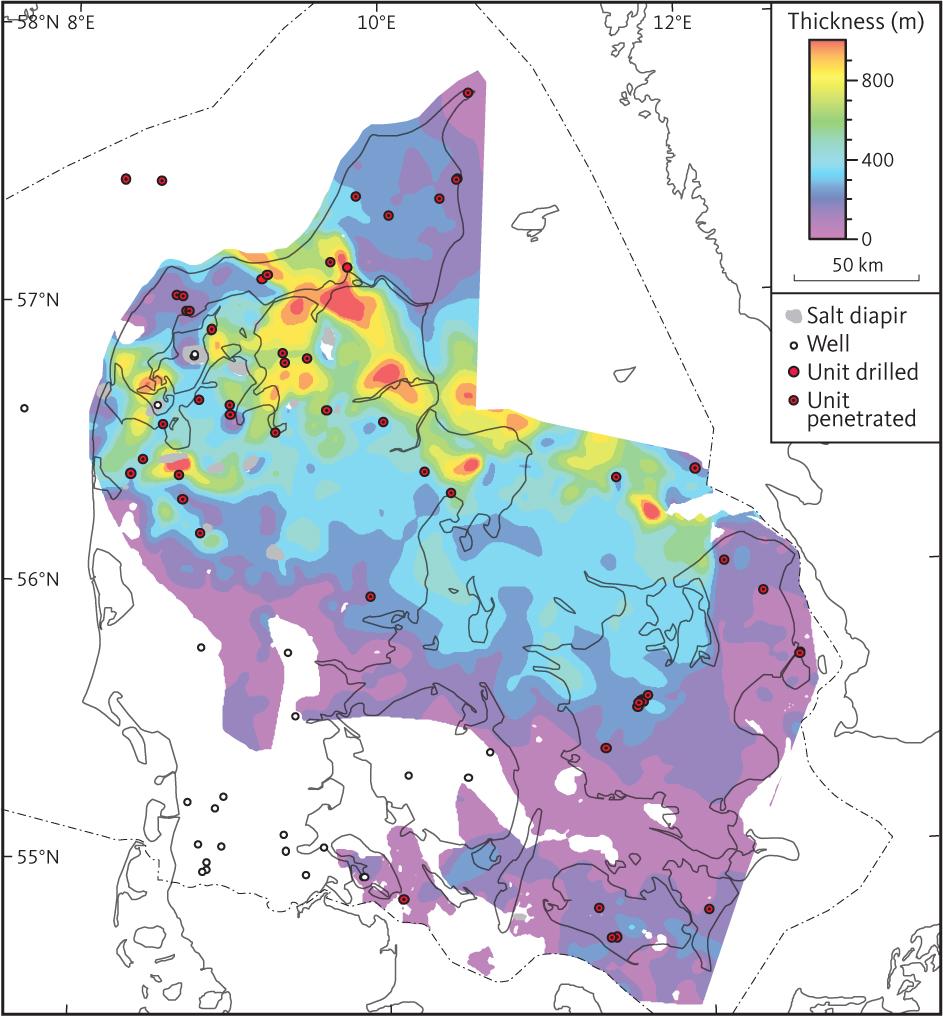
Fig. 31 Isochore map of unit E1 (Fjerritslev Formation).
3.4.2 Seismic Unit E2 – Gassum Formation
3.4.2.1 Background and borehole data
Seismic unit E2 corresponds approximately to the Gassum Formation and is recorded throughout most of the study area (Fig. 6). The greatest thickness of the formation is seen in the Hans-1 borehole (366 m) in the Sorgenfrei–Tornquist Zone (Nielsen & Japsen 1991). In general, the formation is about 100–200 m thick. It comprises Rhaetian – Lower Sinemurian shallow marine, coastal and fluvial sandstones interbedded with marginal marine muddy units and lacustrine mudstones (Larsen 1966; Bertelsen 1978; Michelsen et al. 2003; Nielsen 2003). The unit is diachronous, being Rhaetian (most likely including the uppermost Norian and lowermost Hettangian) in large parts of the southern and central parts of the Danish Basin, Rhaetian–Hettangian – Lower Sinemurian in the Sorgenfrei–Tornquist Zone, and Hettangian – Lower Sinemurian on the Skagerrak–Kattegat Platform (Bertelsen 1978; Lindström et al. 2023; Michelsen et al. 2003; Nielsen 2003). In the Øresund Basin, deposition of sand continued further in the Early Jurassic until the marine flooding in the latest Pliensbachian (TS15 of Nielsen 2003; Erlström et al. 2018). At the type locality of the Gassum Formation, the Gassum-1 borehole, the log suite is old and incomplete. However, at the reference locality, the Hyllebjerg-1 borehole (Michelsen et al. 2003), the formation is about 170 m thick and characterised by a pronounced blocky pattern in the gamma-ray, spontaneous potential and induction logs (Fig. 32).
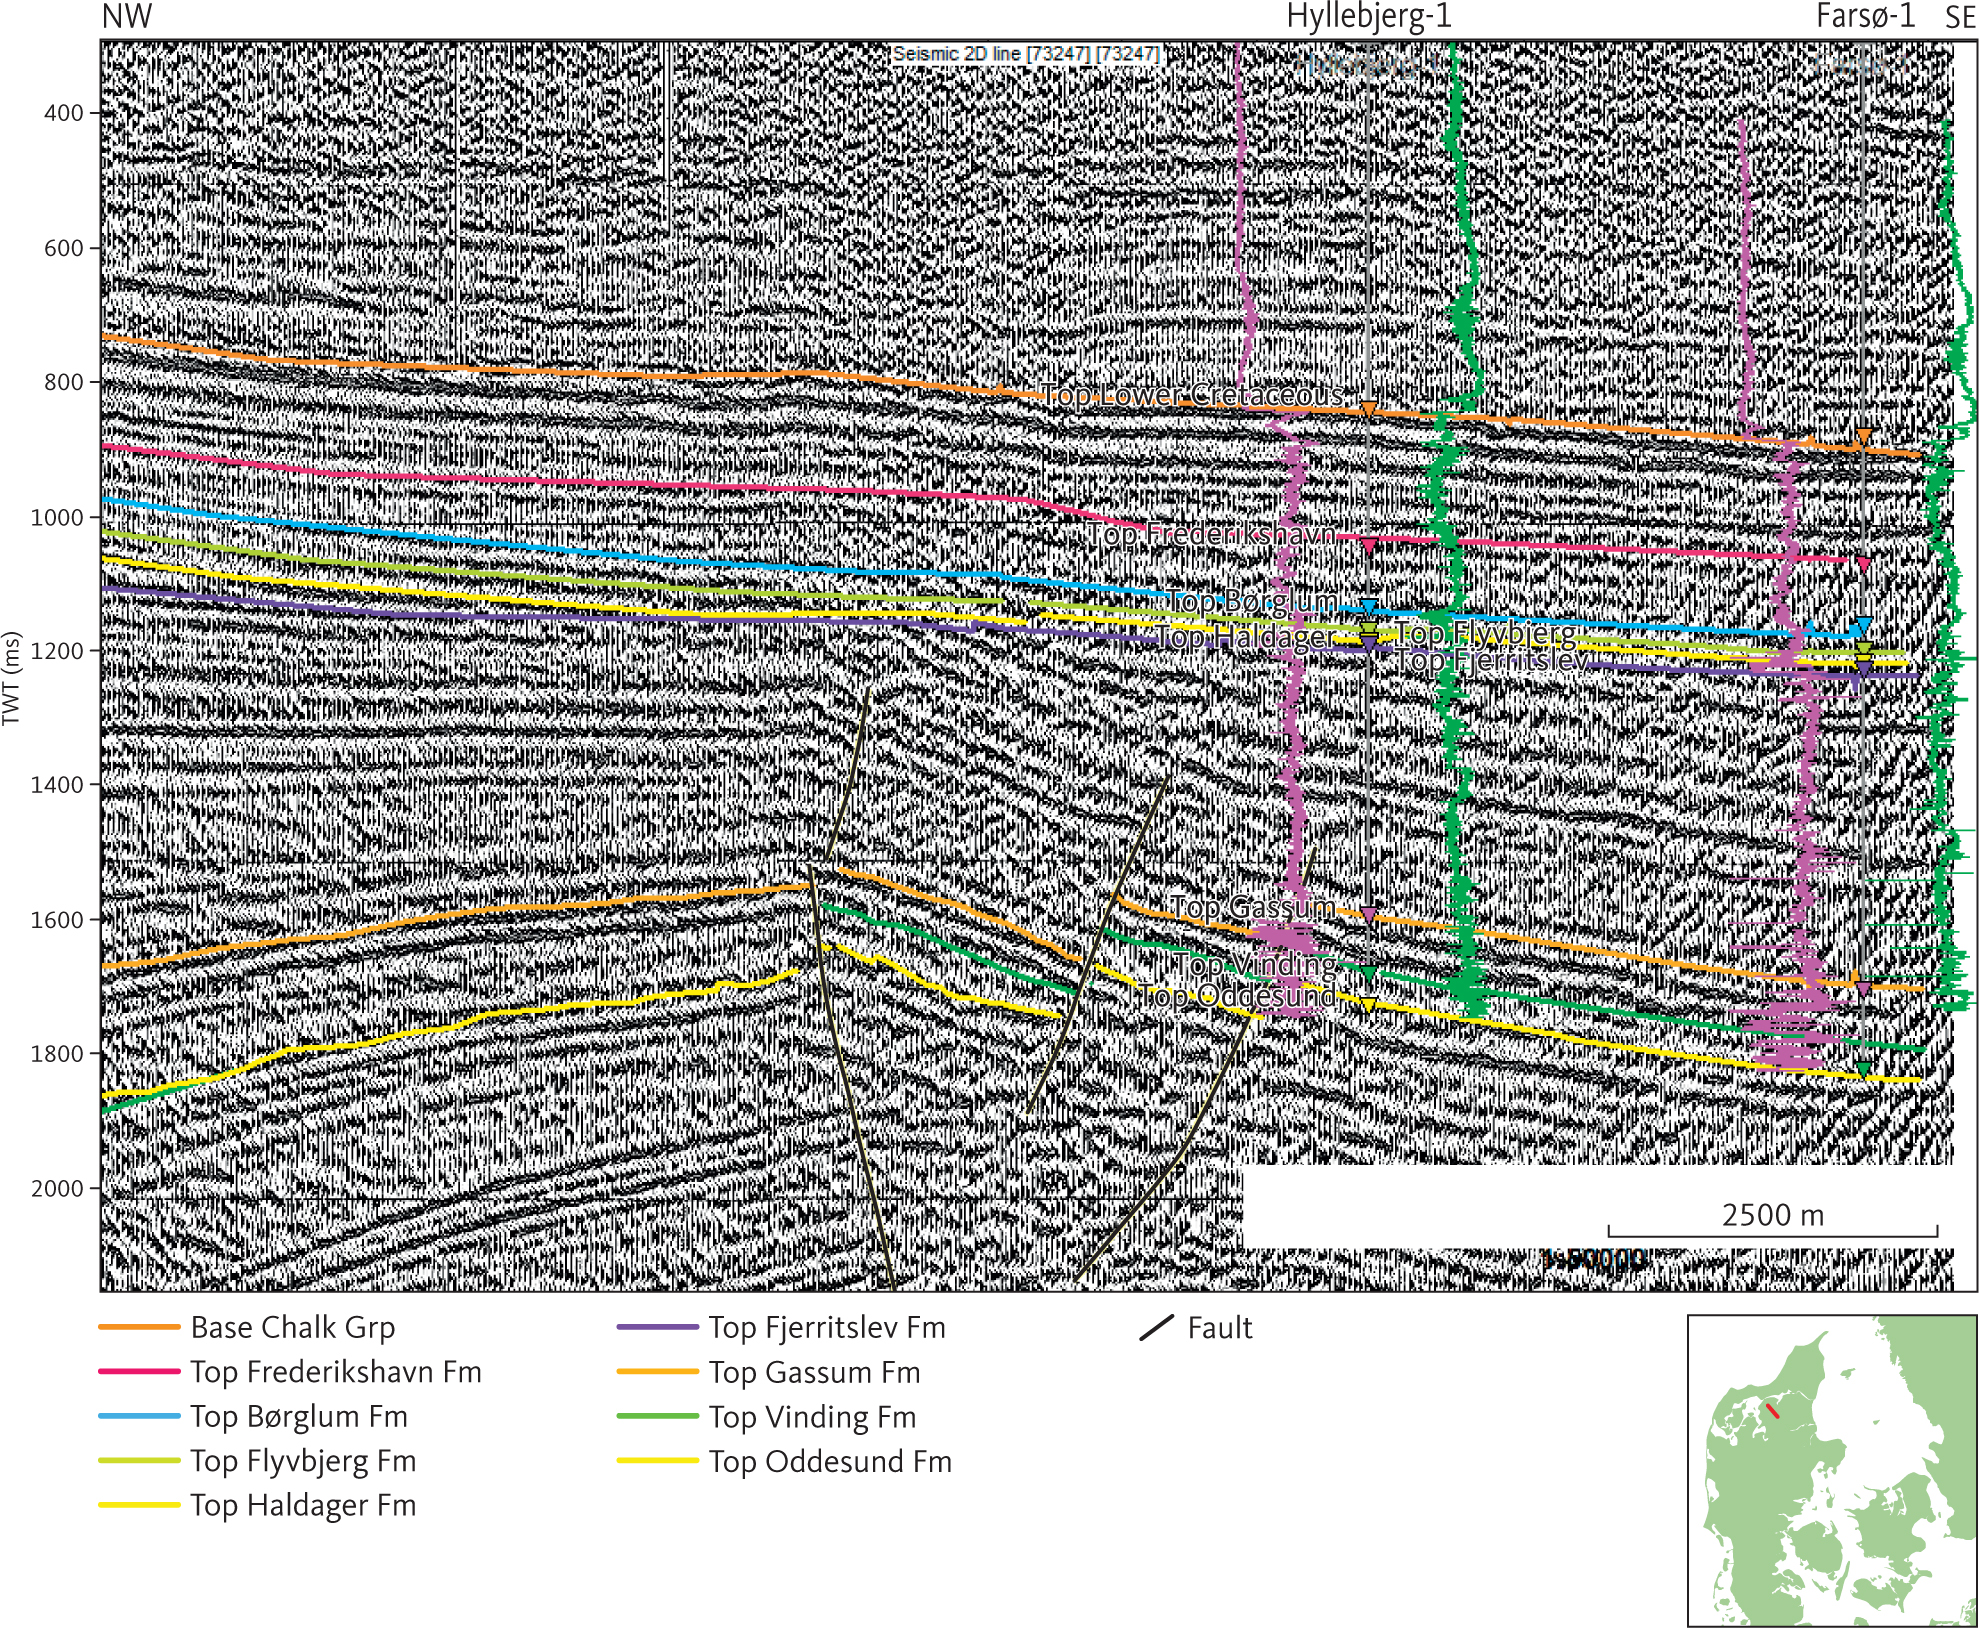
Fig. 32 Seismic section (73287) through Hyllebjerg-1, the reference section of the Gassum Formation corresponding to seismic unit E2 (see Section 3.4.2) and Farsø-1. Note characteristic, strong, continuous reflections at the top of unit E2. The gamma-ray and sonic logs are shown as purple and green lines respectively on either side of the two well paths, with highest values closest to the well traces. Inserted map shows the location of the profile.
3.4.2.2 The top of unit E2
The top of unit E2 is time-transgressive. Therefore, the map representing the top of E2 (Fig. 33) is a composite surface composed by merging horizons tying with three different transgressive surfaces recognised in wells (Nielsen 2003). In the Skagerrak–Kattegat Platform and Sorgenfrei–Tornquist Zone, the seismic horizon representing the top of unit E2 ties approximately with the transgressive surface, TS11 of Nielsen (2003). In the North German Basin and in most of the Danish Basin it ties approximately with TS9, and in the Øresund Basin, the top of unit E2 ties approximately with TS15. The horizons representing the top of seismic unit E2 are all seen as a continuous reflection horizon of moderate to high amplitude, which in wells correlates with a lithological boundary between dominantly muddy sediments of the Fjerritslev Formation above and fairly clean sandstone beds of the Gassum Formation below. Overall, the merged horizon at the top of unit E2 dips into the Danish Basin, both from the north and from the south (Fig. 33). Local depth maxima are seen on the flanks of most diapirs in the salt dome province of northern Jylland. However, the rim-synclines are typically found only along part of the circumference of the structures (Boldreel 1985).
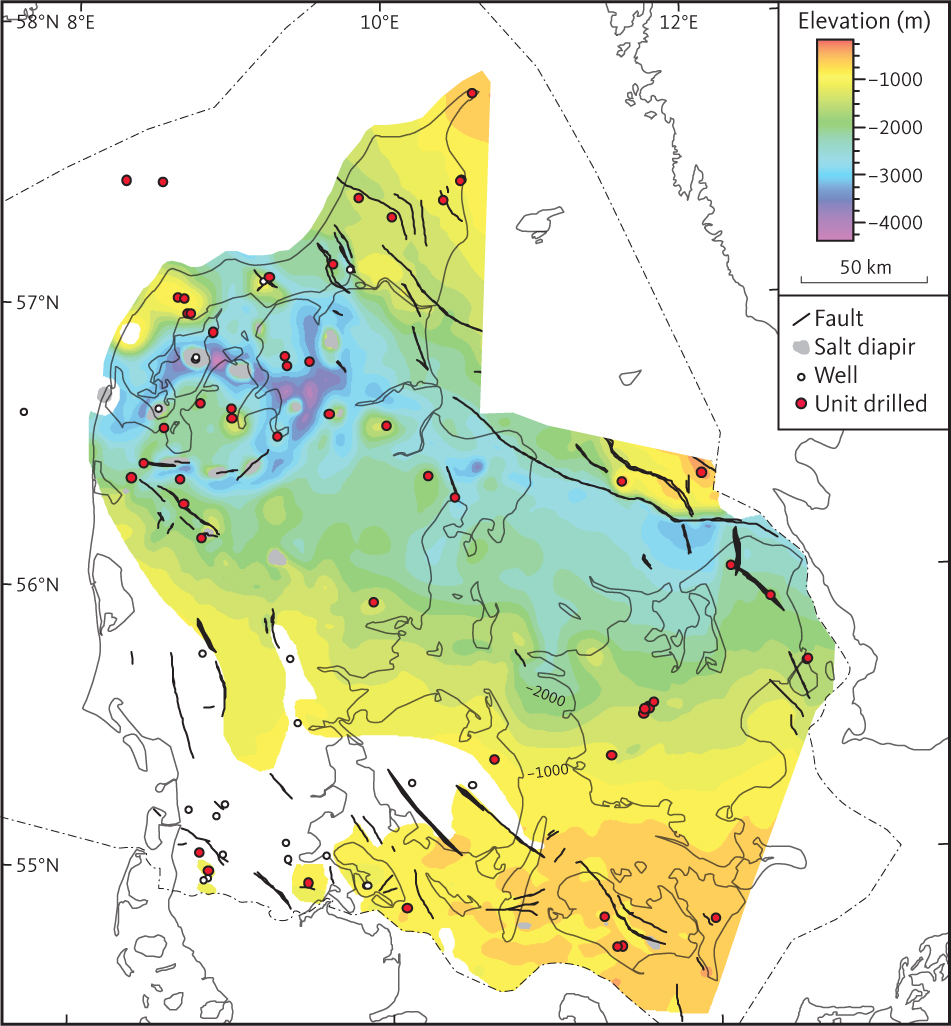
Fig. 33 Depth to top of unit E2 (Gassum Formation).
3.4.2.3 Seismic character of unit E2
In the vicinity of the reference section (the Hyllebjerg-1 borehole), unit E2 is about 170 m thick and characterised by pronounced parallel horizons of high amplitude reflections on older low-resolution seismic data (Fig. 32). However, on newer seismic data, low angle clinoforms are more common within the unit (Figs 21, 34).
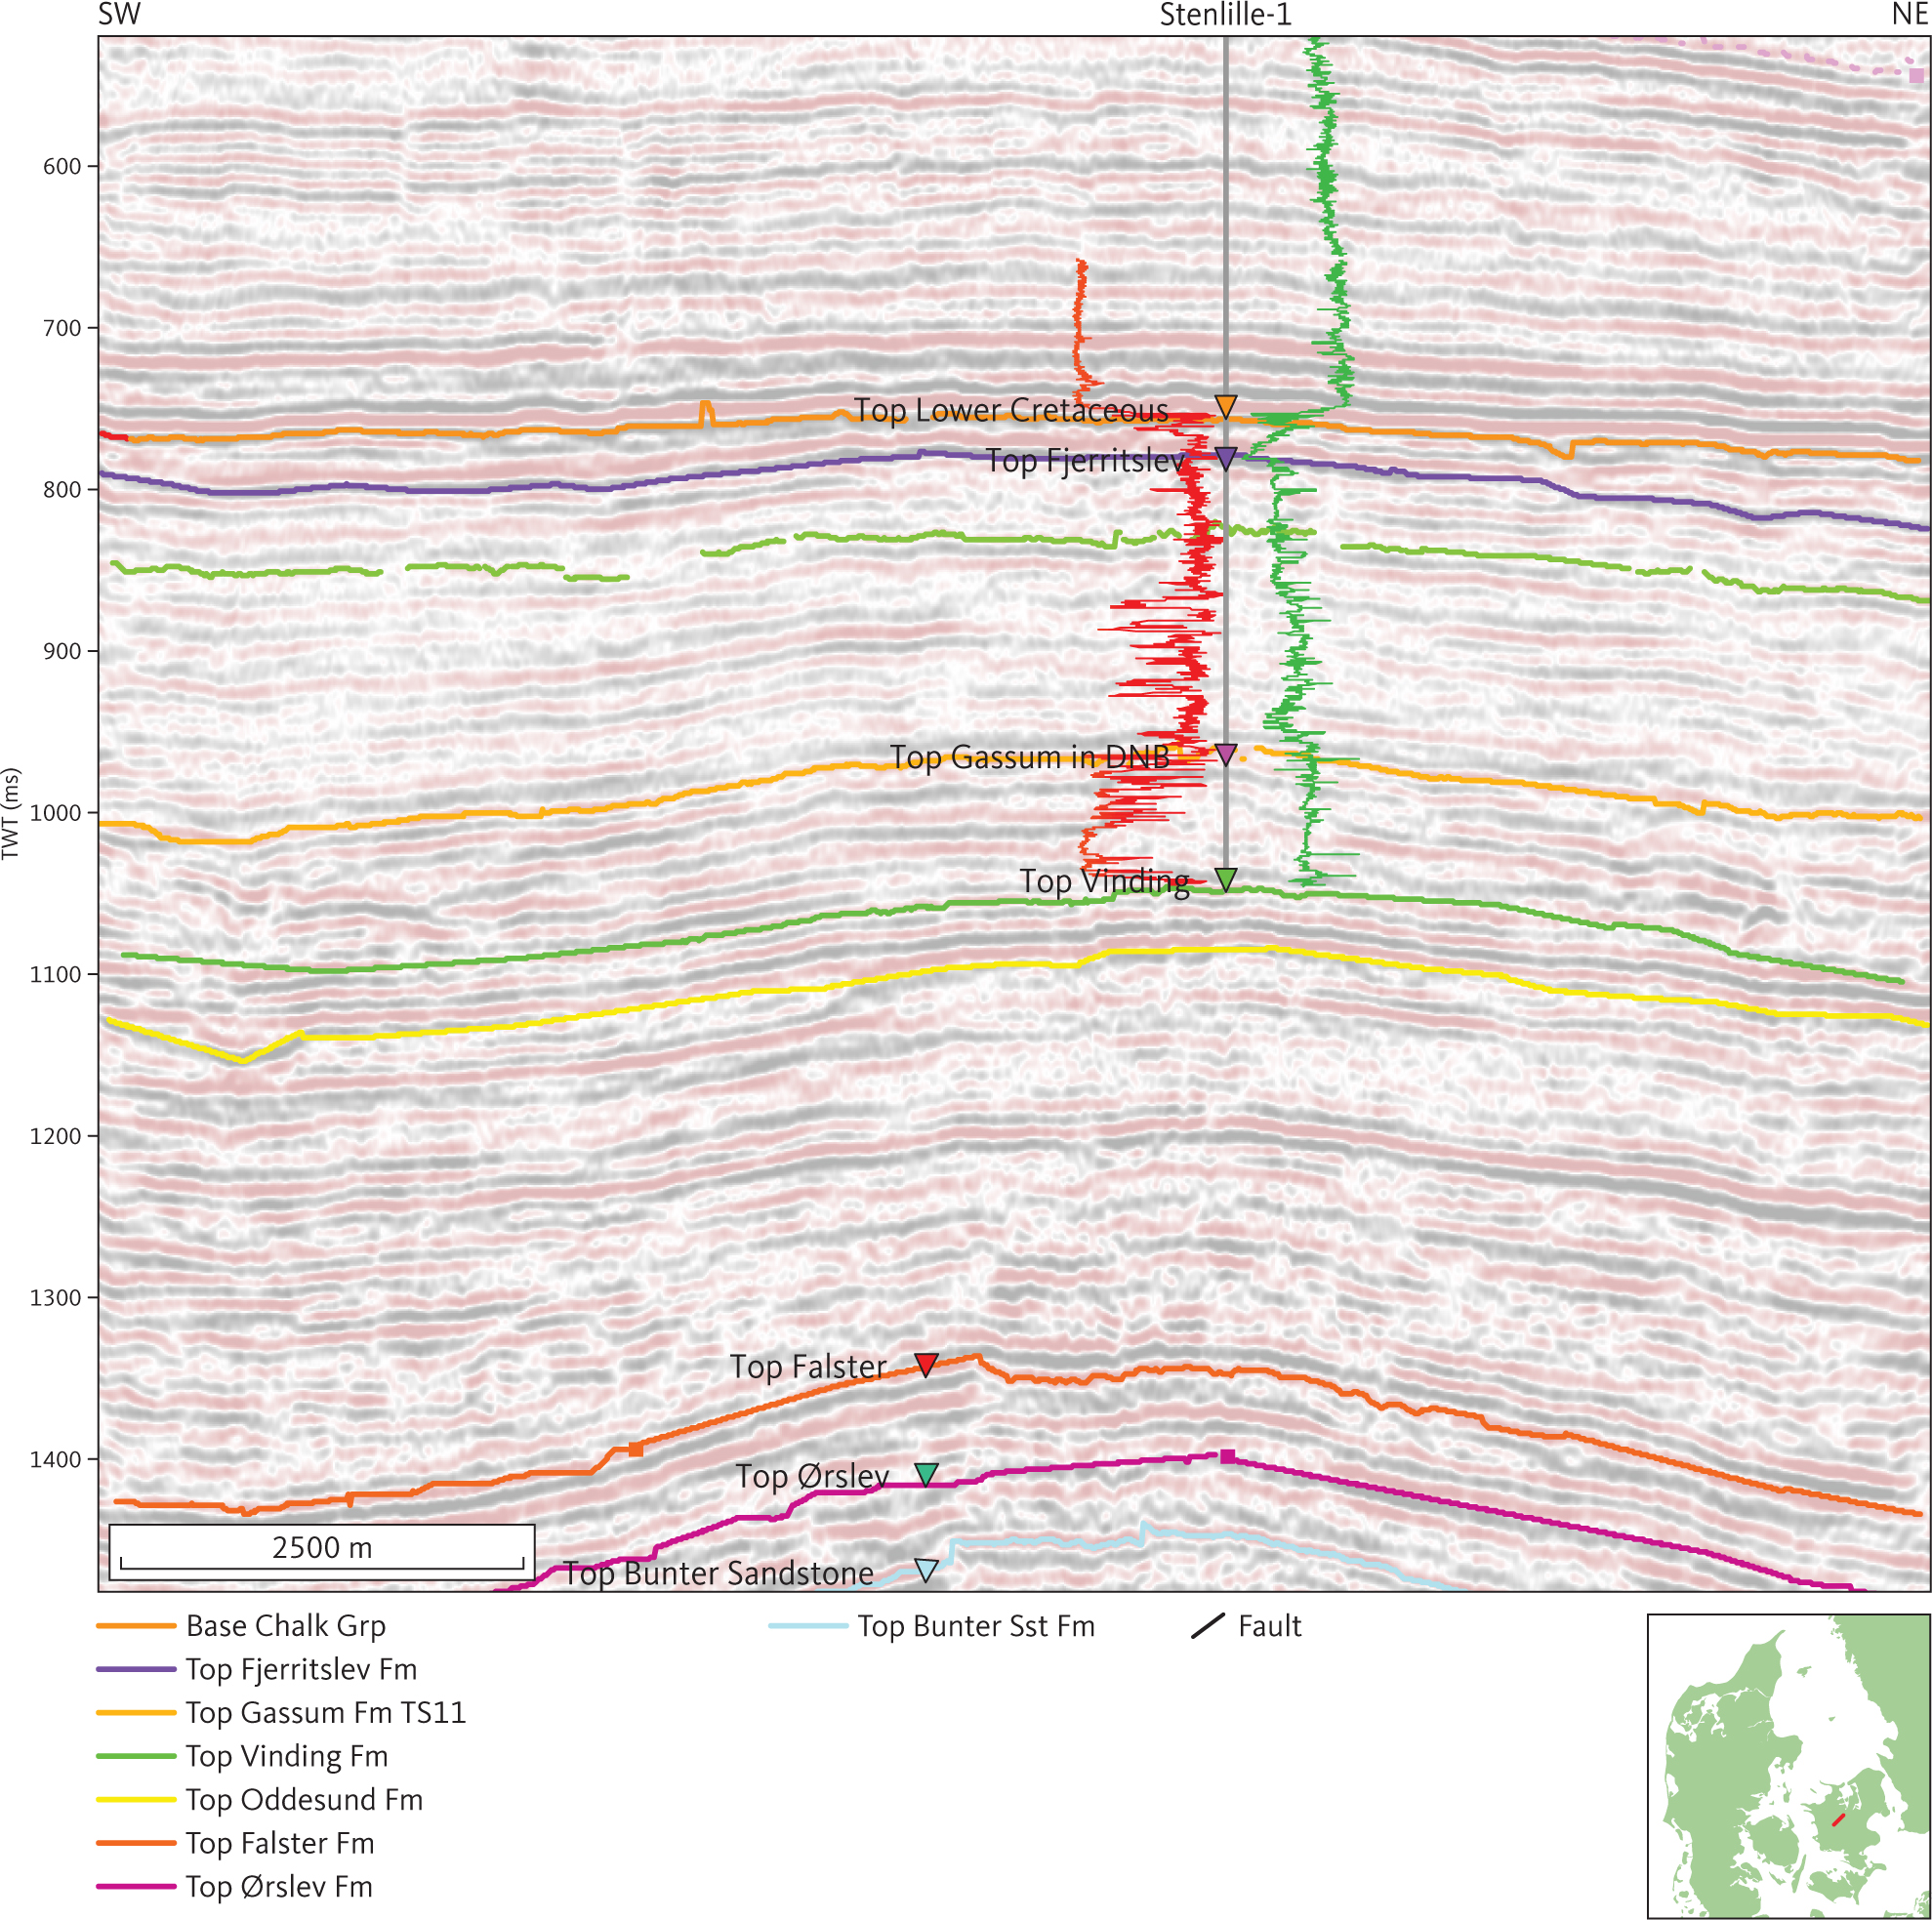
Fig. 34 Seismic section (DN94-D01) at Stenlille-1. Unit E2 (the Gassum Formation) is in this area characterised by reflections of higher amplitude than those from unit E1 (Fjerritslev Formation; see Section 3.4.1), low angle clinoforms and internal unconformities. The gamma-ray and sonic logs are shown as red and green lines, respectively, on either side of the Stenlille-1 well path, with highest values closest to the well trace. DNB: Danish Norwegian Basin. Inserted map shows the location of the profile.
3.4.2.4 Isochore of unit E2
Overall, the thickness of unit E2 is less than 250 m, and the greatest thicknesses (c. 300–500 m) are found in the Fjerritslev Trough (Sorgenfrei–Tornquist zone), the Øresund Basin and in the northern continuation of the Storebælt Trough (Fig. 35).
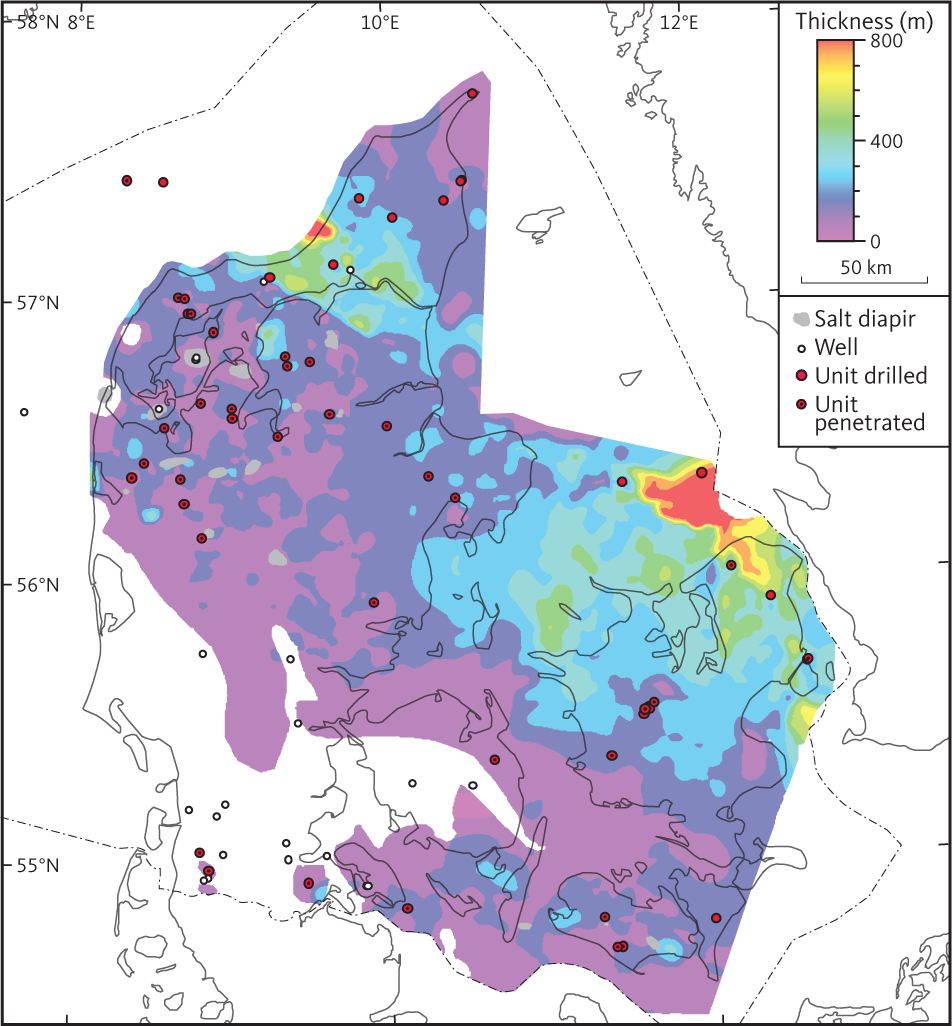
Fig. 35 Isochore of unit E2 (Gassum Formation).
3.5 Seismic unit F – Triassic units
Within the study area, seismic unit F is approximately equivalent to the Triassic succession. In the North German Basin and southern part of the Danish Basin, unit F is subdivided into units F1 through F7, which are tied to the lithostratigraphy of Sorgenfrei & Buch (1964), Bertelsen (1978), Bertelsen (1980) and Michelsen & Clausen (2002). In the eastern part of the study area, within the Øresund Basin, only some of the subunits are recognised and mapped and thereby tied to lithostratigraphic units described by Erlström & Sivhed (2012). The relationship between lithostratigraphy and seismic units is illustrated in Fig. 36. Unit F on the Skagerrak–Kattegat Platform, the north-western part of the Sorgenfrei–Tornquist Zone and the northern part of the Danish Basin is named unit FN which is different from unit F in the North German Basin and southern part of the Danish Basin. It is here designated unit FN and is not subdivided into subunits. In the following sections, unit FN and units F1–F7 are described.
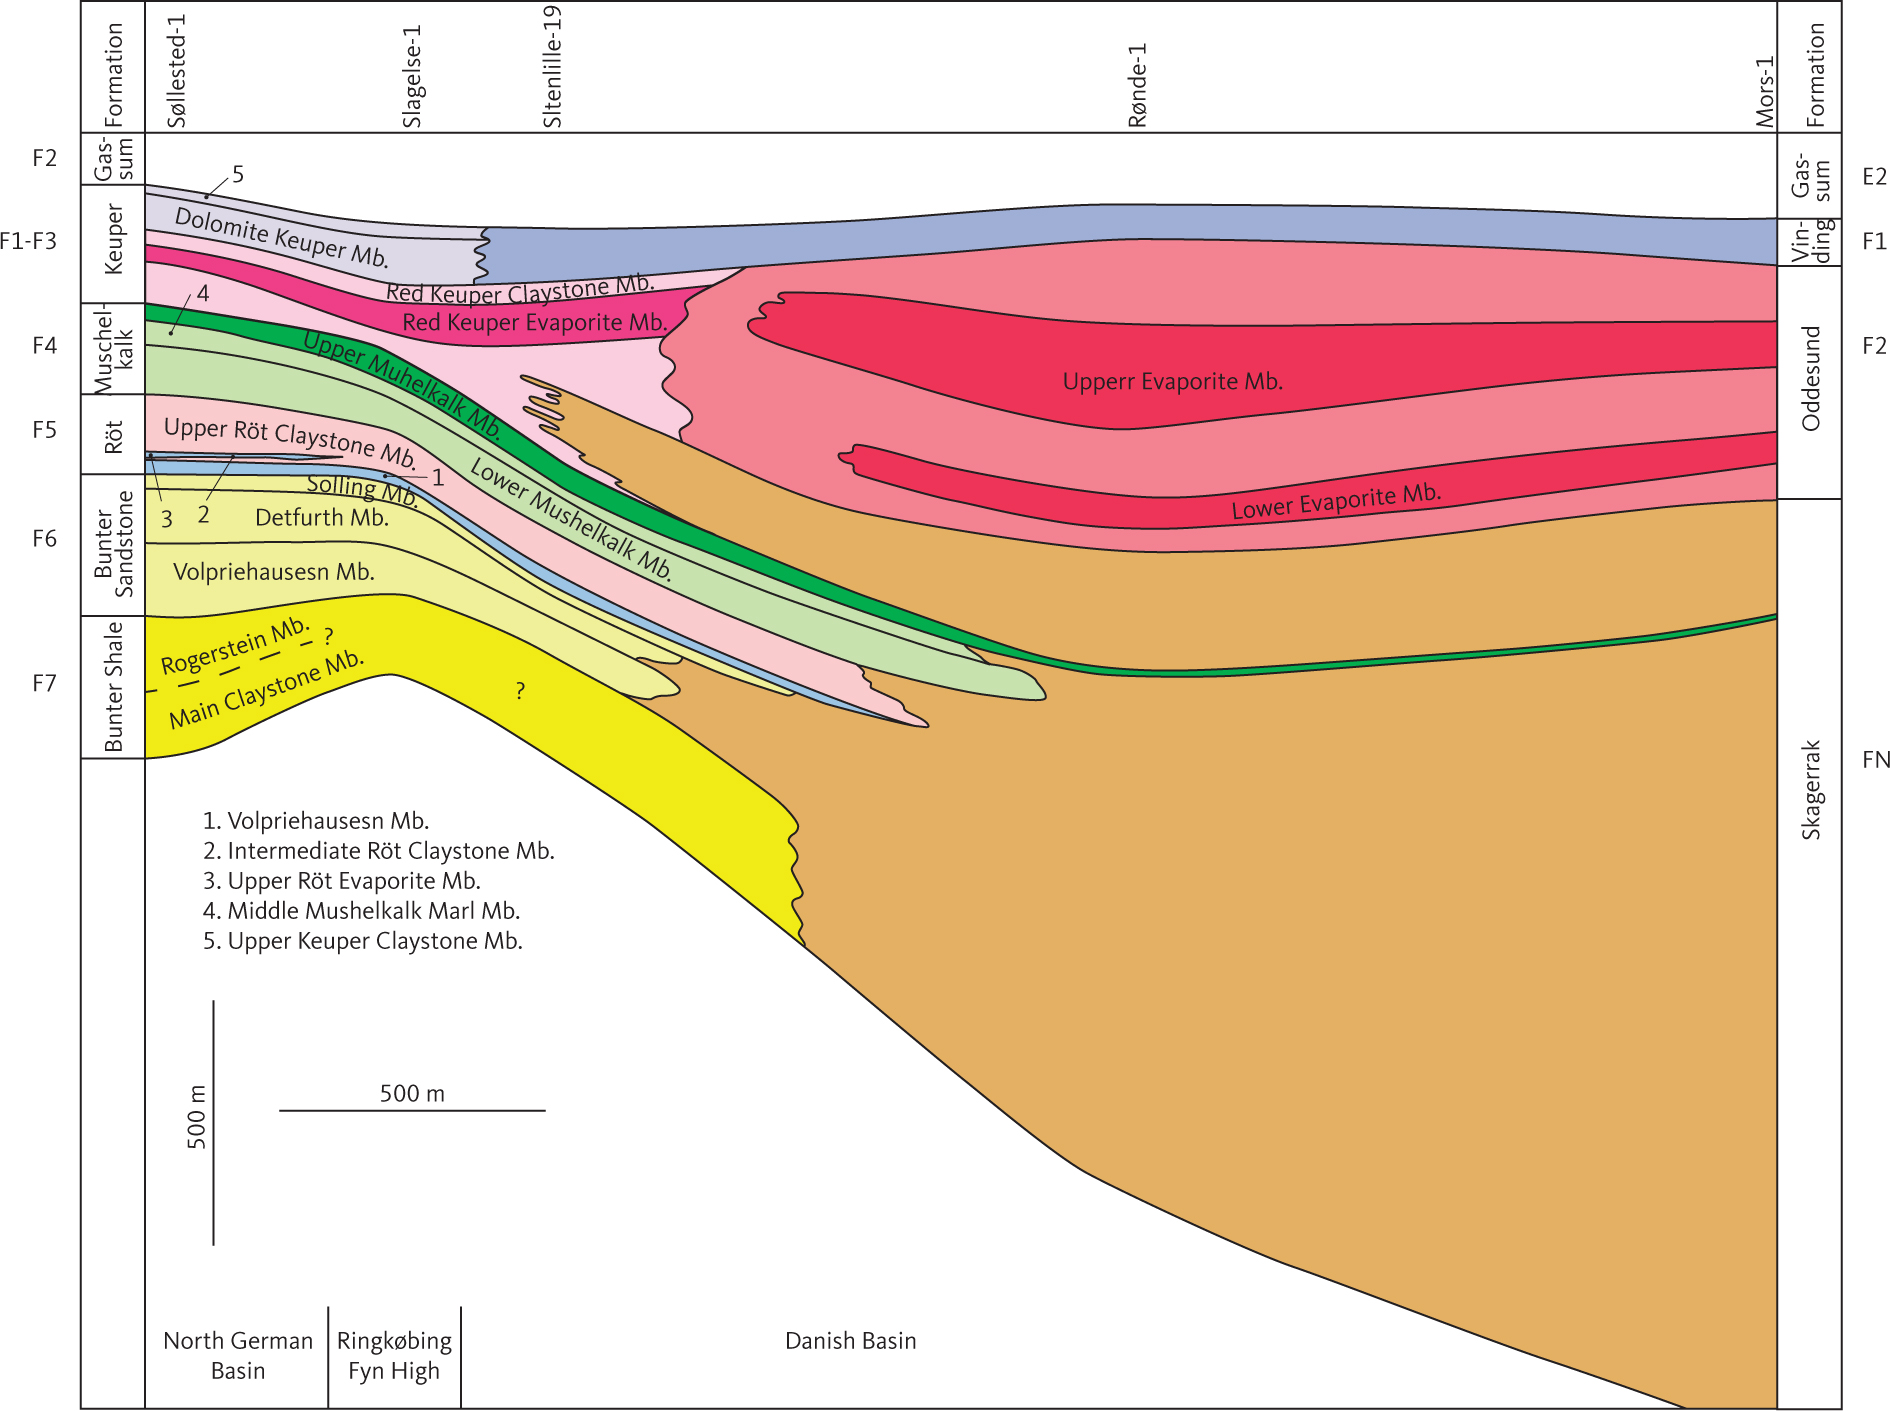
Fig. 36 Schematic profile S–N showing the relation between the Triassic lithostratigraphic units of Michelsen & Clausen (2002) and the corresponding seismic units, F1–F7 and FN, used in this study.
3.5.1 Seismic unit FN – Skagerrak Formation
3.5.1.1 Background and borehole data
Seismic unit FN is approximately equivalent to the Skagerrak Formation (Bertelsen 1980) that is found in most deep boreholes on the Skagerrak–Kattegat Platform and in the north-western part of the Sorgenfrei–Tornquist Zone (Fig. 6; Nielsen & Japsen 1991). In addition, the lower part of the Triassic succession in some of the northernmost wells south of the Sorgenfrei–Tornquist Zone includes characteristics both of the Skagerrak Formation and of the Germano-type Facies Province. Overall, the Skagerrak Formation is characterised as a redbed succession. Alternating claystone-dominated and arkosic intervals in the uppermost part of the Skagerrak Formation are observed in a few boreholes in the northernmost part of the basin (e.g. Vedsted-1, Flyvbjerg-1) and may be related to minor flooding episodes during deposition in Late Triassic time (Bertelsen 1980). Overall, the formation is identified in boreholes by lithology and petrophysical logs (Fig. 37). Log patterns are somewhat variable depending on local setting. The alternating claystone-dominated and arkosic intervals are characterised by blocky SP logs and a high correlation between spontaneous potential and resistivity logs, comparable to patterns observed in the Gassum Formation (Fig. 21). Elsewhere, the SP and GR logs through the Skagerrak Formation are consistent with it being interpreted as fairly homogeneous sandy succession.
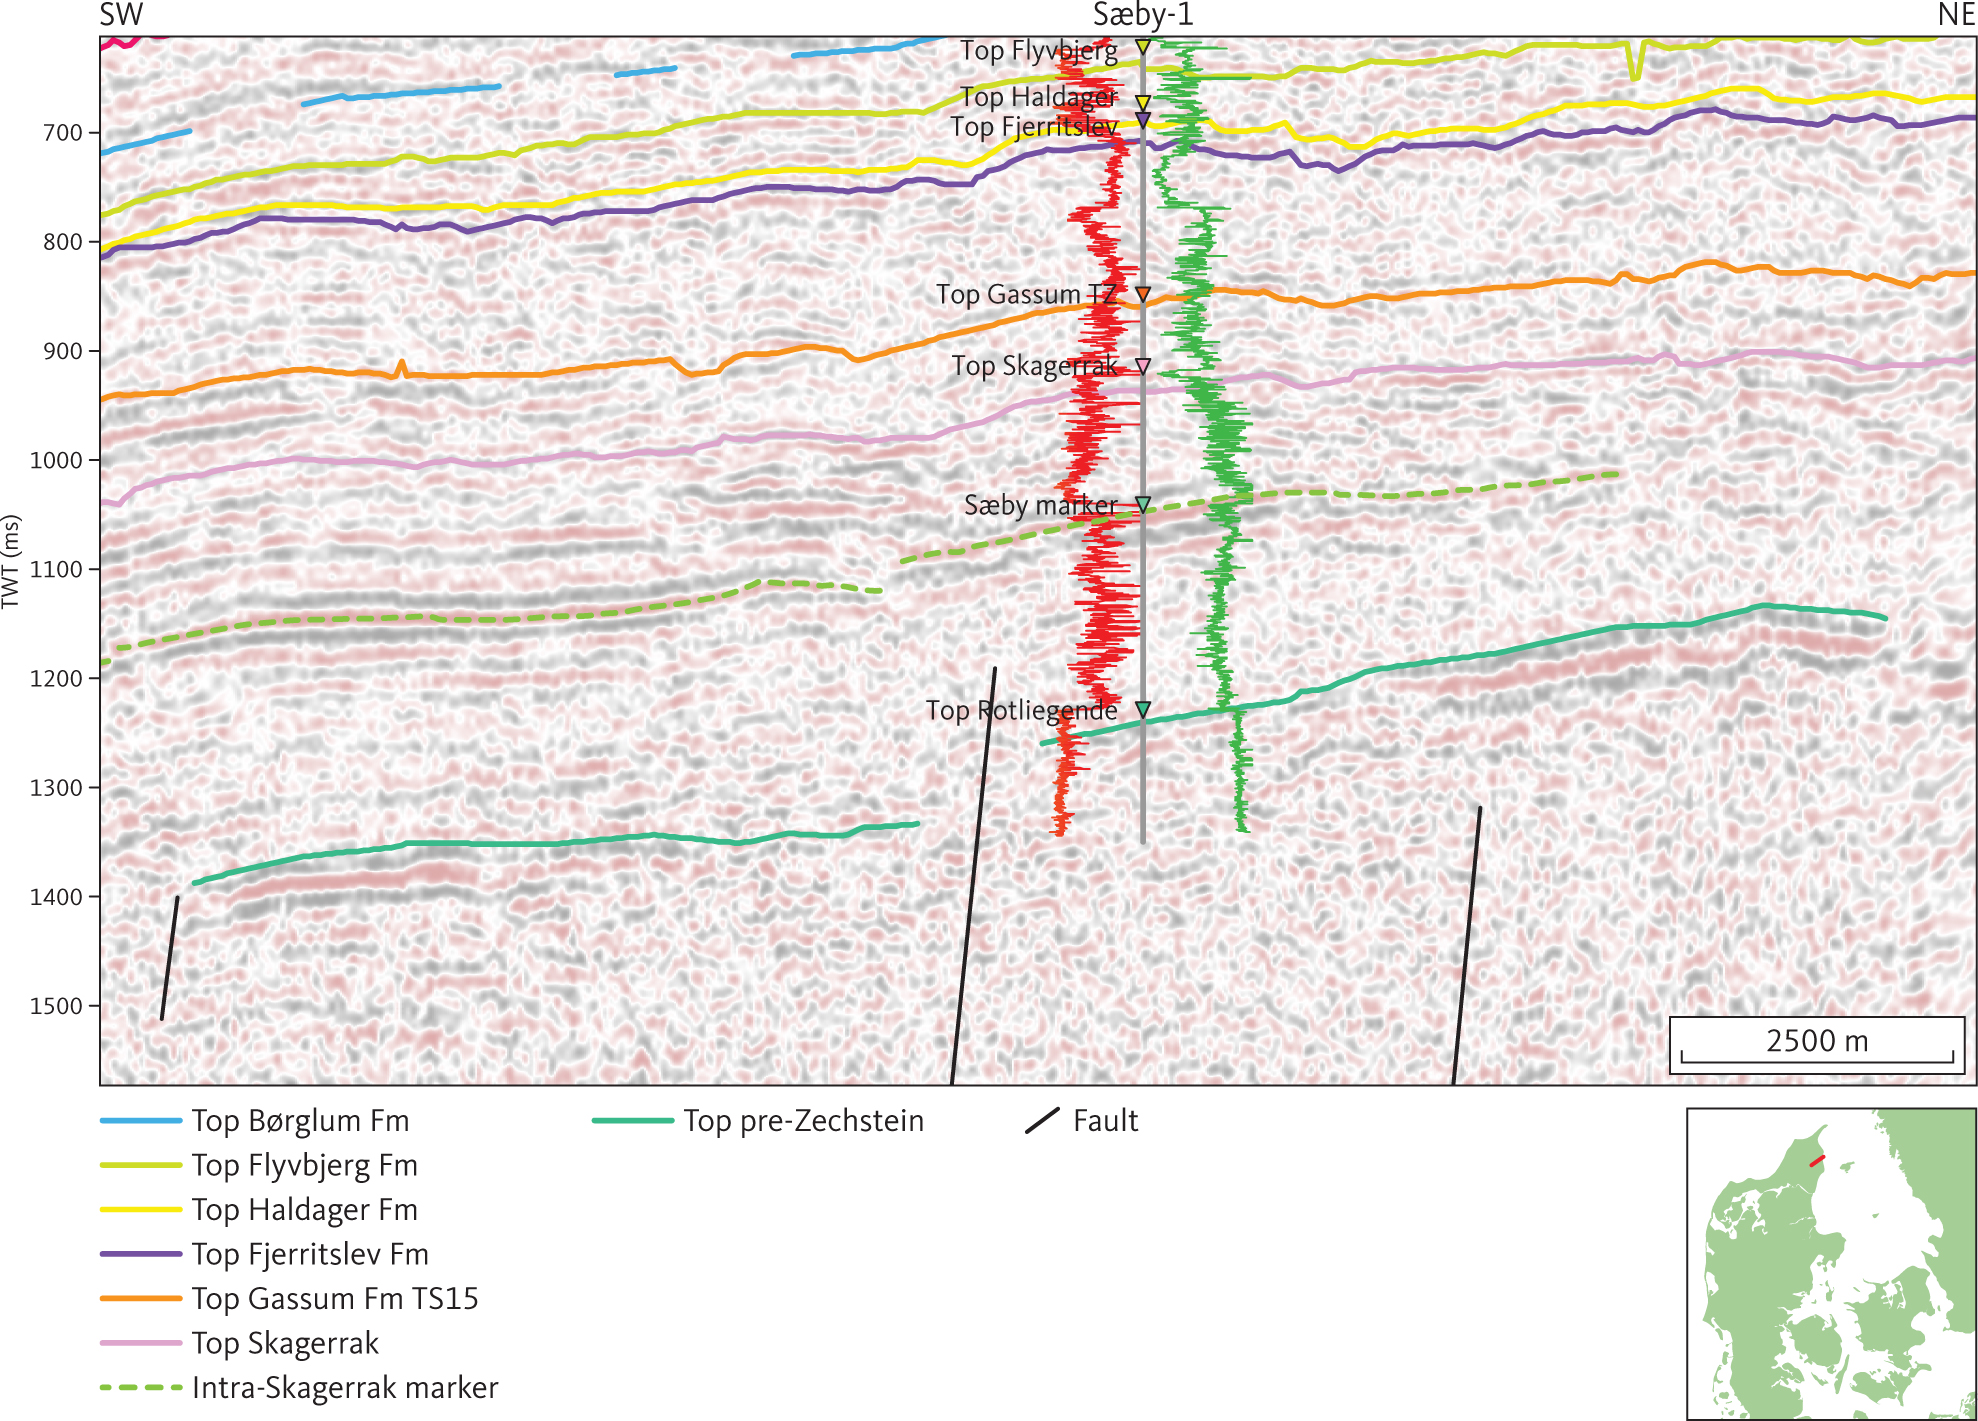
Fig. 37 Seismic section (DNJ-28) illustrating the character of the Skagerrak Formation around the Sæby-1 well. The marker subdividing seismic unit FN (Skagerrak Formation; see Section 3.5.1) in the vicinity of the Sæby-1 well is shown as a stippled green horizon. The gamma-ray and sonic logs are shown as red and green lines, respectively, on either side of the Sæby-1 well path, with highest values closest to the well trace. Inserted map shows the location of the profile.
3.5.1.2 Top of unit FN
The top of unit FN and base of unit E2 are picked at or just below a distinct, fairly continuous moderate amplitude seismic reflection that has the character of an incision surface (Fig. 21). In the vicinity of the Flyvbjerg-1 well, the top of unit FN correlates with the SB5 sequence boundary, a fluvial incision surface of middle Rhaetian age (see fig. 19 in Nielsen (2003)). A near-top Triassic map in the study area has been created by combining the top of unit FN and the top of unit F1 (Fig. 38). Overall, the top of unit FN is found at a depth of c. 1000–2000 m. The map of the depth to the top of unit FN is used as an approximation of the depth to the top of the Triassic on the Skagerrak–Kattegat Platform and in the Sorgenfrei–Tornquist Zone (Fig. 38).
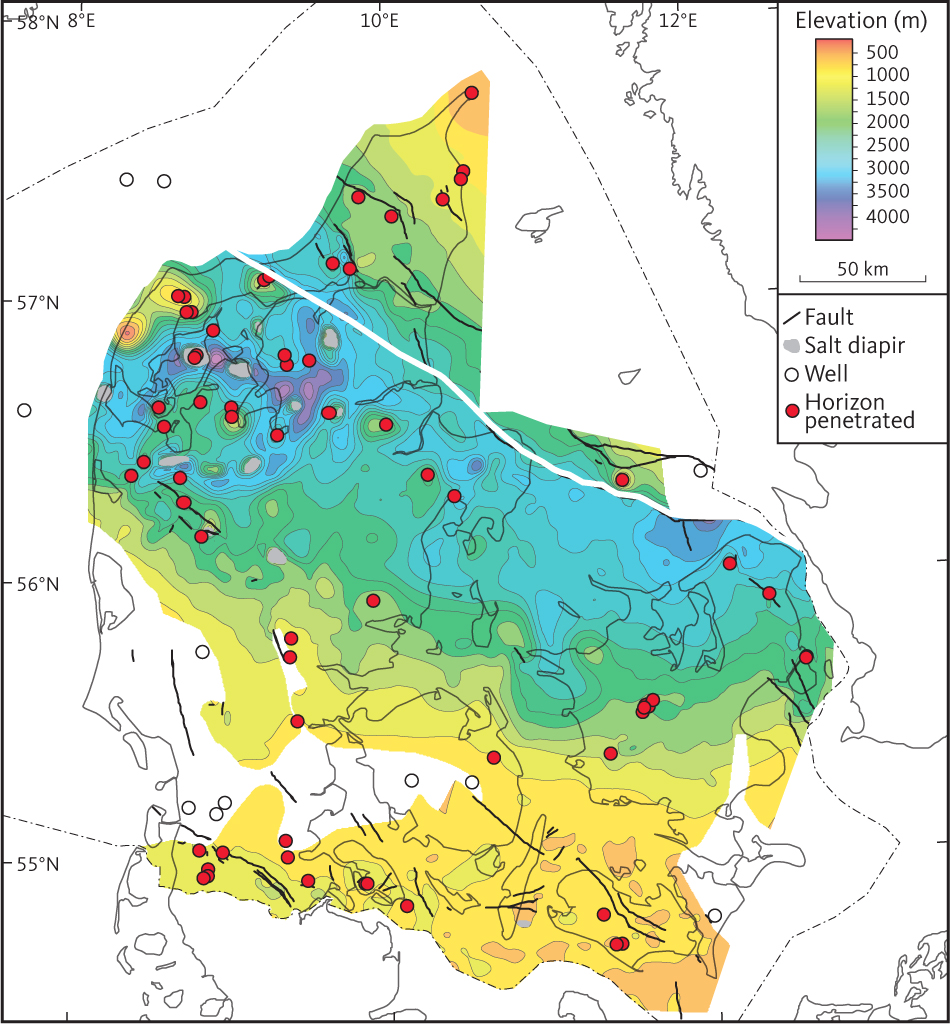
Fig. 38 Depth to near top Triassic. The map is composed by merging top unit FN (Skagerrak Formation) located to the north of the white line on the figure and top unit F1 (Vinding Formation) located to the south of the white line.
3.5.1.3 Seismic character of the unit FN
A distinct marker horizon correlating with a lithological change in the Sæby-1 well subdivides FN into a lower and an upper part (Fig. 37). Overall, the upper part of unit FN is characterised by sub-parallel horizons of fairly continuous reflections of variable amplitude (Figs 37, 39). Parts of the succession characterised by clinoforms or complex reflection patterns are also seen in the upper part of the unit. The seismic character of the lower part of unit FN is generally chaotic with some continuous reflection segments. Continuous reflections within unit FN become more common from north to south within the Fjerritslev Trough, and the internal horizons of unit FN are picked throughout the central and southern part of the Danish Basin. Geometrically, unit FN on the Skagerrak–Kattegat Platform is a wedge, pinching out towards the ENE (Figs 38, 39).
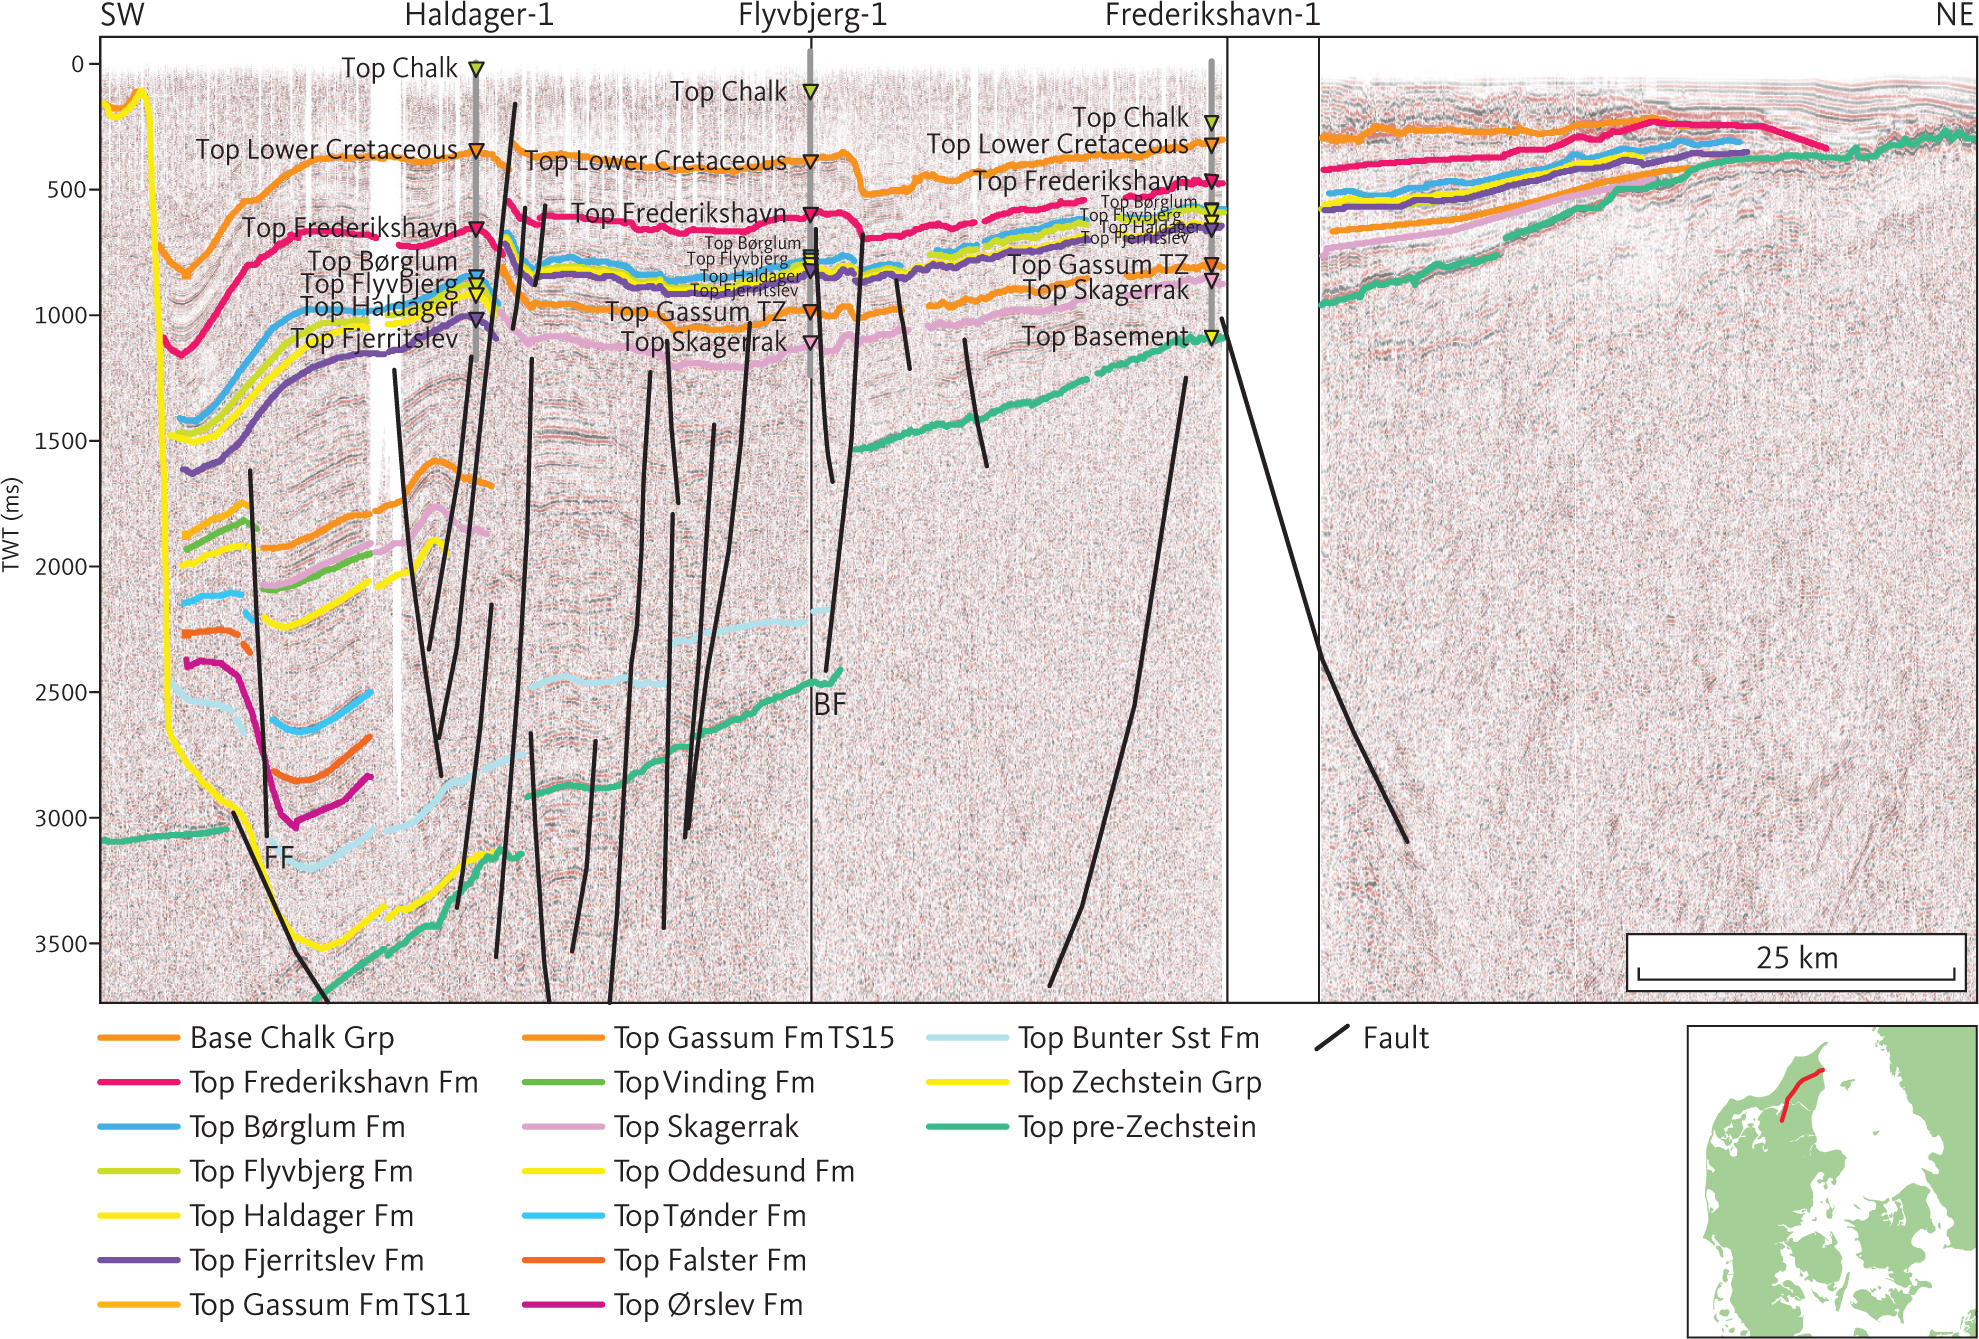
Fig. 39 Composite seismic section (DNJ-300 and DCS-80) through Haldager-1, Flyvbjerg-1 and Frederikshavn-1 illustrating the northward change in seismic character of seismic unit F. BF: Børglum Fault. FF: Fjerritslev Fault. Inserted map shows the location of the profile.
3.5.1.4 Base of unit FN
On the Skagerrak–Kattegat Platform, the base of unit FN is the top pre-Zechstein horizon, which in this area is a distinct unconformity truncating the Precambrian basement, the Rotliegend Group, and Lower Palaeozoic rocks (Michelsen & Nielsen 1991, 1993). It has the character of a planation surface dipping gently towards the south-west and slightly modified by Triassic and younger faulting (Figs 37, 39). It is associated with a fairly continuous reflection of moderate amplitude. Farther to the south, the base of unit FN is formed by the top of the Zechstein Group. The Børglum Fault offsets the base of the unit (Fig. 39), and within the Sorgenfrei–Tornquist Zone it is generally situated deeper than 2500 m. In the Fjerritslev Trough, it reaches a depth of c. 4000–5000m.
3.5.1.5 Isochore of unit FN
Unit FN is generally less than 1500 m thick on the Skagerrak–Kattegat Platform and about 2500 m in the Sorgenfrei–Tornquist Zone (Fig. 40). The largest mapped thickness of unit FN is about 4000–5000 m in the Fjerritslev Trough.
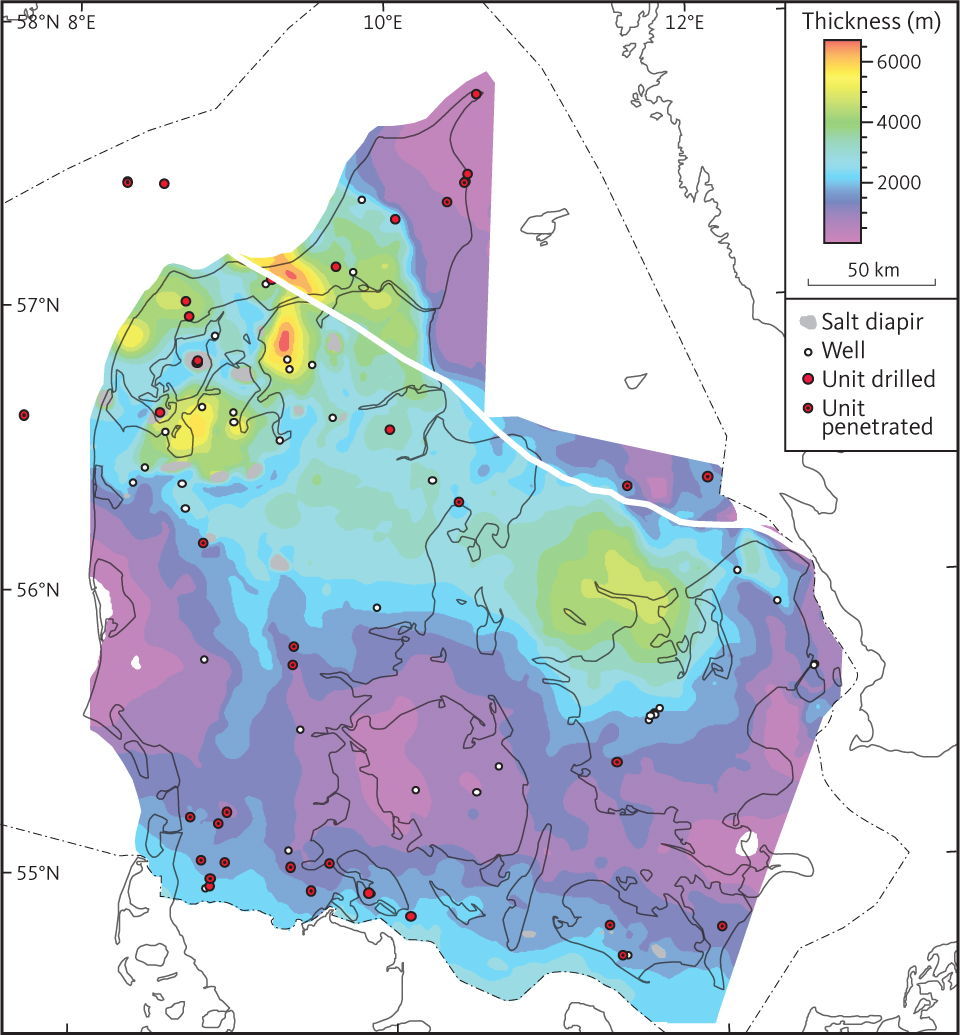
Fig. 40 Isochore of the seismic unit FN (Skagerrak Formation).
3.5.1.6 Age of unit FN
Unit FN corresponds to the Skagerrak Formation comprising continental deposits, and the age of borehole samples from the formation is not determined in any detail. The top of the Lower Triassic unit F6 is tracked tentatively into the Sorgenfrei–Tornquist Zone. The deepest part of the Skagerrak Formation in this part of the Danish Basin may thus correspond stratigraphically to the Bunter Sandstone Formation. Farther north on the Skagerrak–Kattegat Platform, the lower part of unit FN is characterised by a reflection pattern which resembles that displayed by units F2 to F5 (corresponding to Oddesund through Ørslev Formations of Bertelsen (1980)).
However, the northward continuation of seismic horizons is considered speculative, and a systematic subdivision of unit FN is not possible with the present database due to the scarcity of good seismic data in the northern part of the study area in combination with the structural complexity.
3.5.2 Seismic unit F1 – Vinding Formation
3.5.2.1 Background and borehole data
Seismic Unit F1 represents the Vinding Formation which is found in central parts of the Danish Basin, and equivalents of the Vinding Formation in the North German Basin and Øresund Basin (Figs 5, 6; Sorgenfrei & Buch 1964; Bertelsen 1978; Michelsen & Clausen 2002; Erlström et al. 2018).
The seismic horizon defining the base of seismic unit F1 is not traced into the Sorgenfrei–Tornquist Zone, and the investigation of well data from the Sorgenfrei–Tornquist Zone and Skagerrak–Kattegat Platform reveals no obvious equivalents of the Vinding Formation (Bertelsen 1978). Consistent markers representing the base of unit F1 have not been identified in wells from the Sorgenfrei–Tornquist Zone and the Skagerrak–Kattegat Platform. Unit F1 is thus terminated south of the Sorgenfrei–Tornquist Zone. However, in the Sorgenfrei–Tornquist Zone and on the Skagerrak–Kattegat Platform, sediments in the upper part of the Skagerrak Formation may be contemporaneous with the Vinding Formation (e.g. Bertelsen 1978, 1980; Nielsen 2003).
In boreholes, the Vinding Formation comprises about 40–90 m of marginal marine limestones and claystones with some silty intercalations (Bertelsen 1978). Identification of the Vinding Formation in wells is based on lithological and palaeontological data and petrophysical logs (Bertelsen 1978). The base of the formation is associated with a major negative gamma-ray peak related to the basal limestone (Bertelsen 1978). Overall, the petrophysical logs are characterised by patterns related to laminated claystones with interbedded dolomitic and anhydritic lithologies and thus quite distinct from those observed in the Skagerrak and Gassum Formations as represented in spontaneous potential, gamma-ray logs, and resistivity logs. The gamma-ray and spontaneous potential readings display moderate to fairly high values and small to moderate variation in the readings of the two logs types in Kegnæs-1 and Rønde-1 wells (Figs 41, 42). Resistivity peaks are seen in relation to the carbonaceous or anhydritic intercalations.
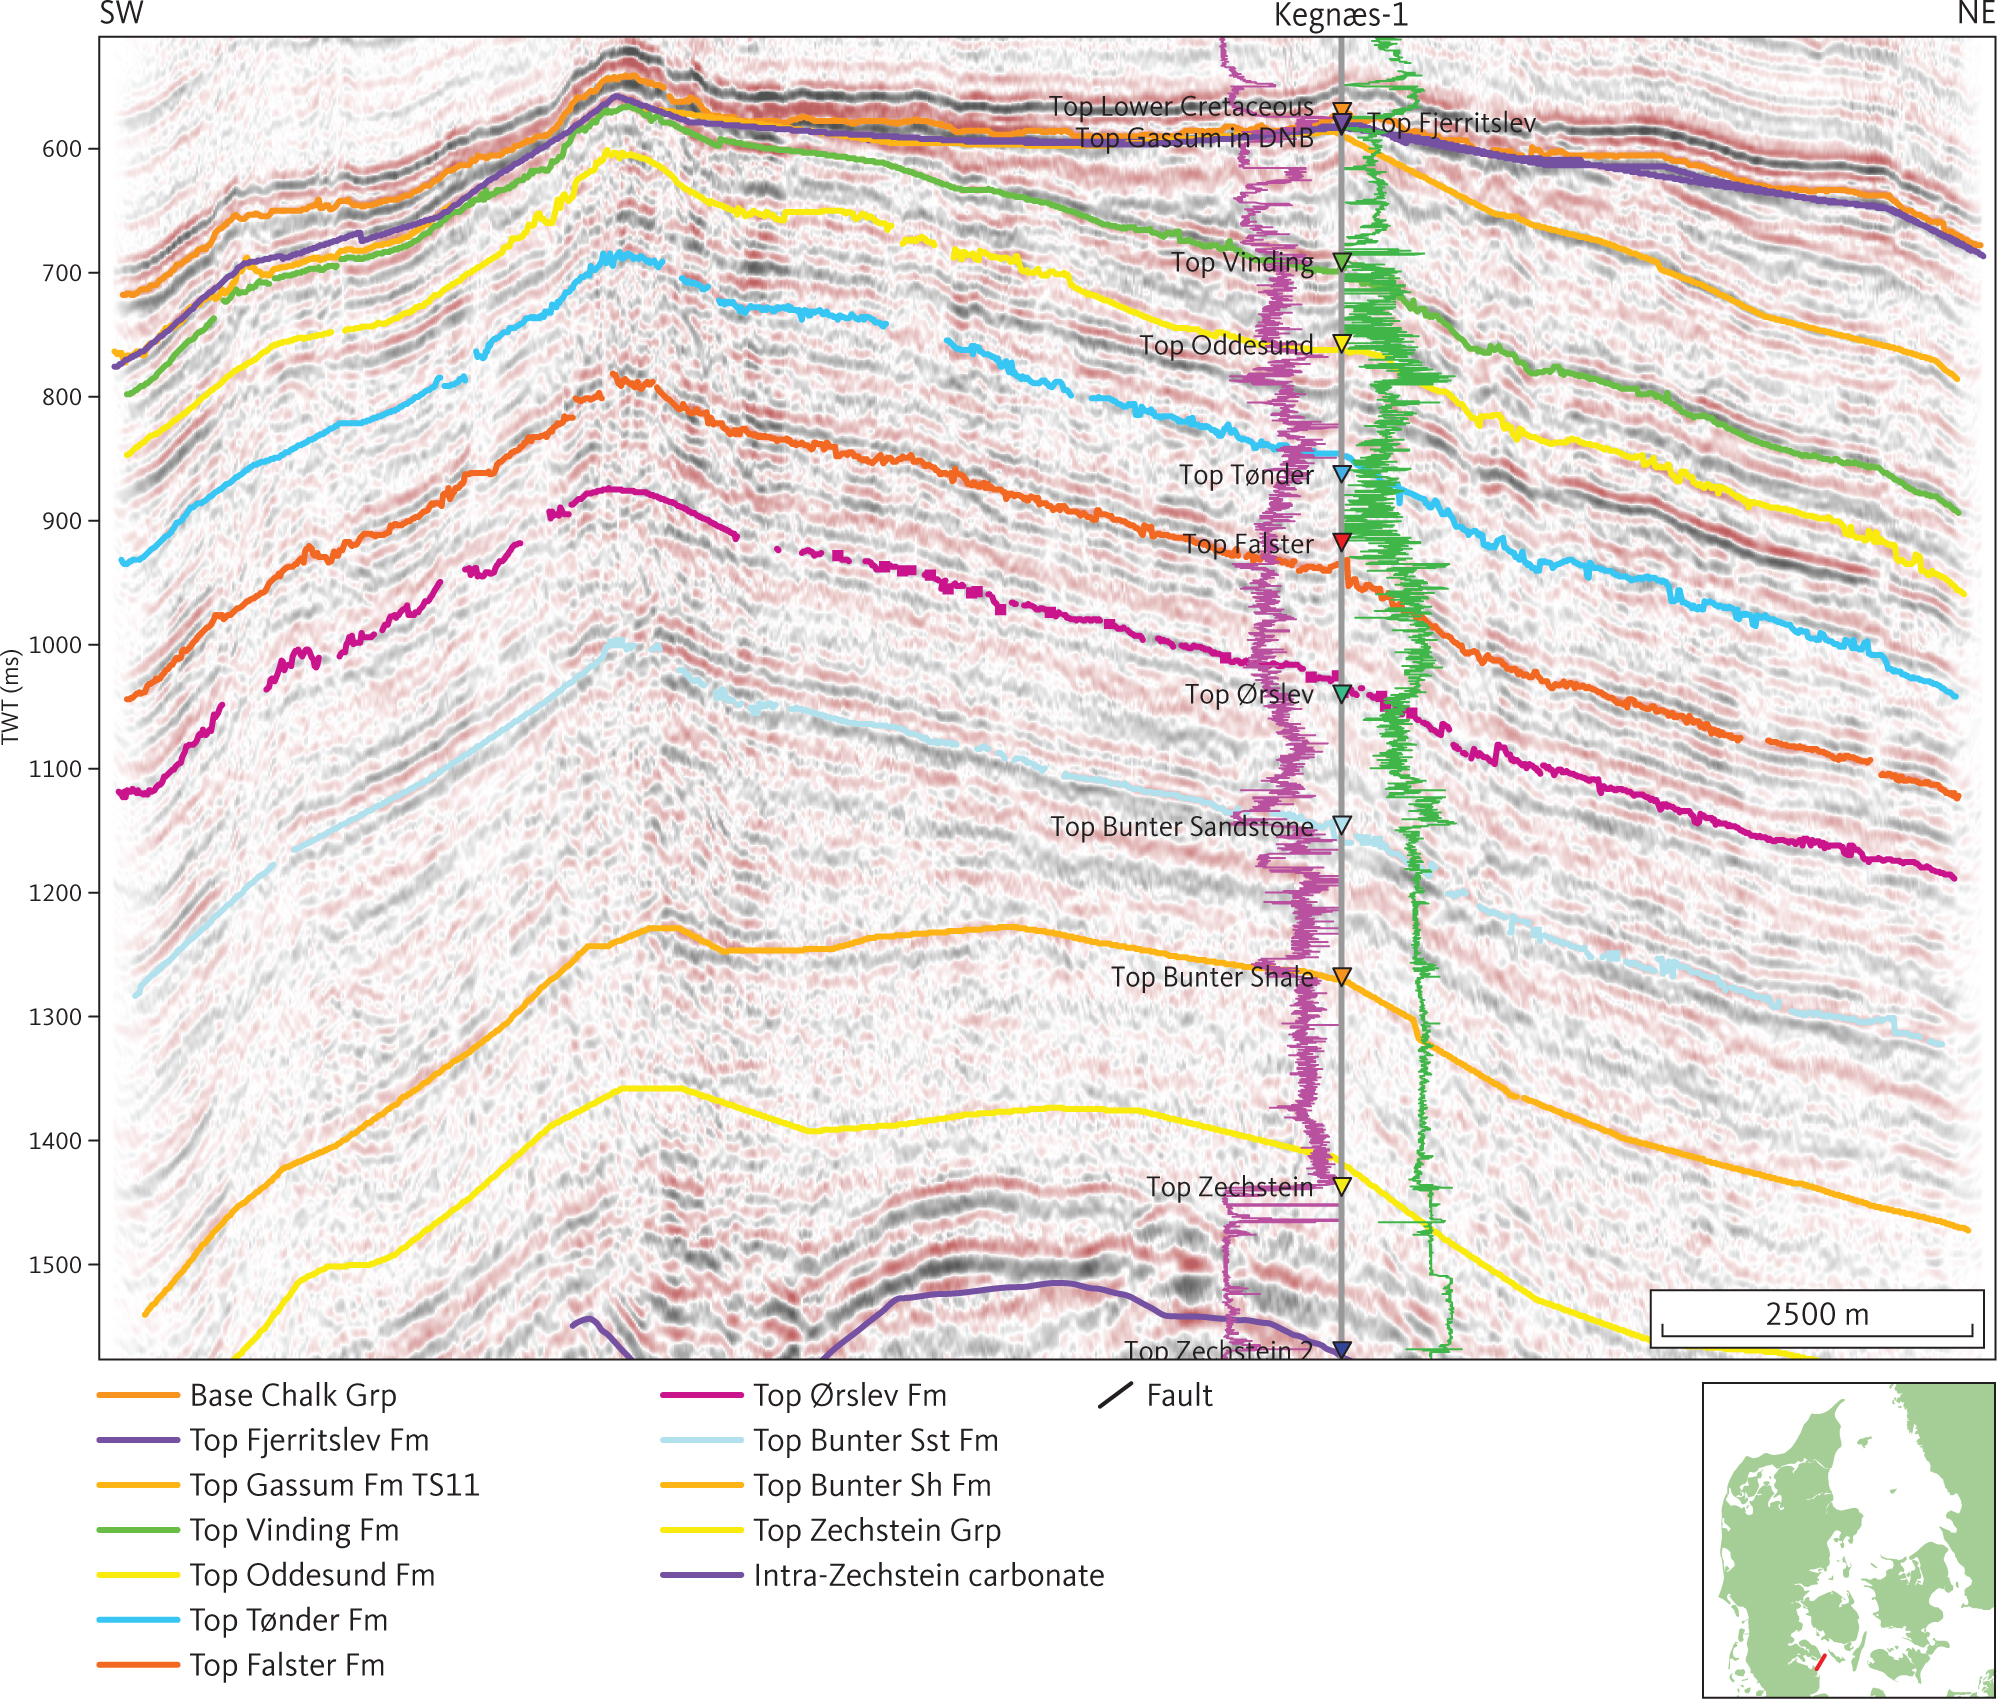
Fig. 41 Seismic section (GY84T-08) through the site of the Kegnæs-1 well illustrating erosional truncation of unit E1 and E2 (Fjerritslev and Gassum Formations; see Sections 3.4.1 and 3.4.2) by an unconformity representing a Middle and Upper Jurassic hiatus. The uplift exposing the Fjerritslev and Gassum Formations to erosion is caused by mobilisation of salt into the Kegnæs pillow. As the hiatus extends across the Upper Jurassic it is most likely associated with the Late Cimmerian tectonic event. Two packages of clinoforms in unit F5 are present. The gamma-ray and sonic logs are shown as purple and green lines, respectively, on either side of the Kegnæs-1 well path, with highest values closest to the well trace. DNB: Danish Norwegian Basin. Inserted map shows the location of the profile.
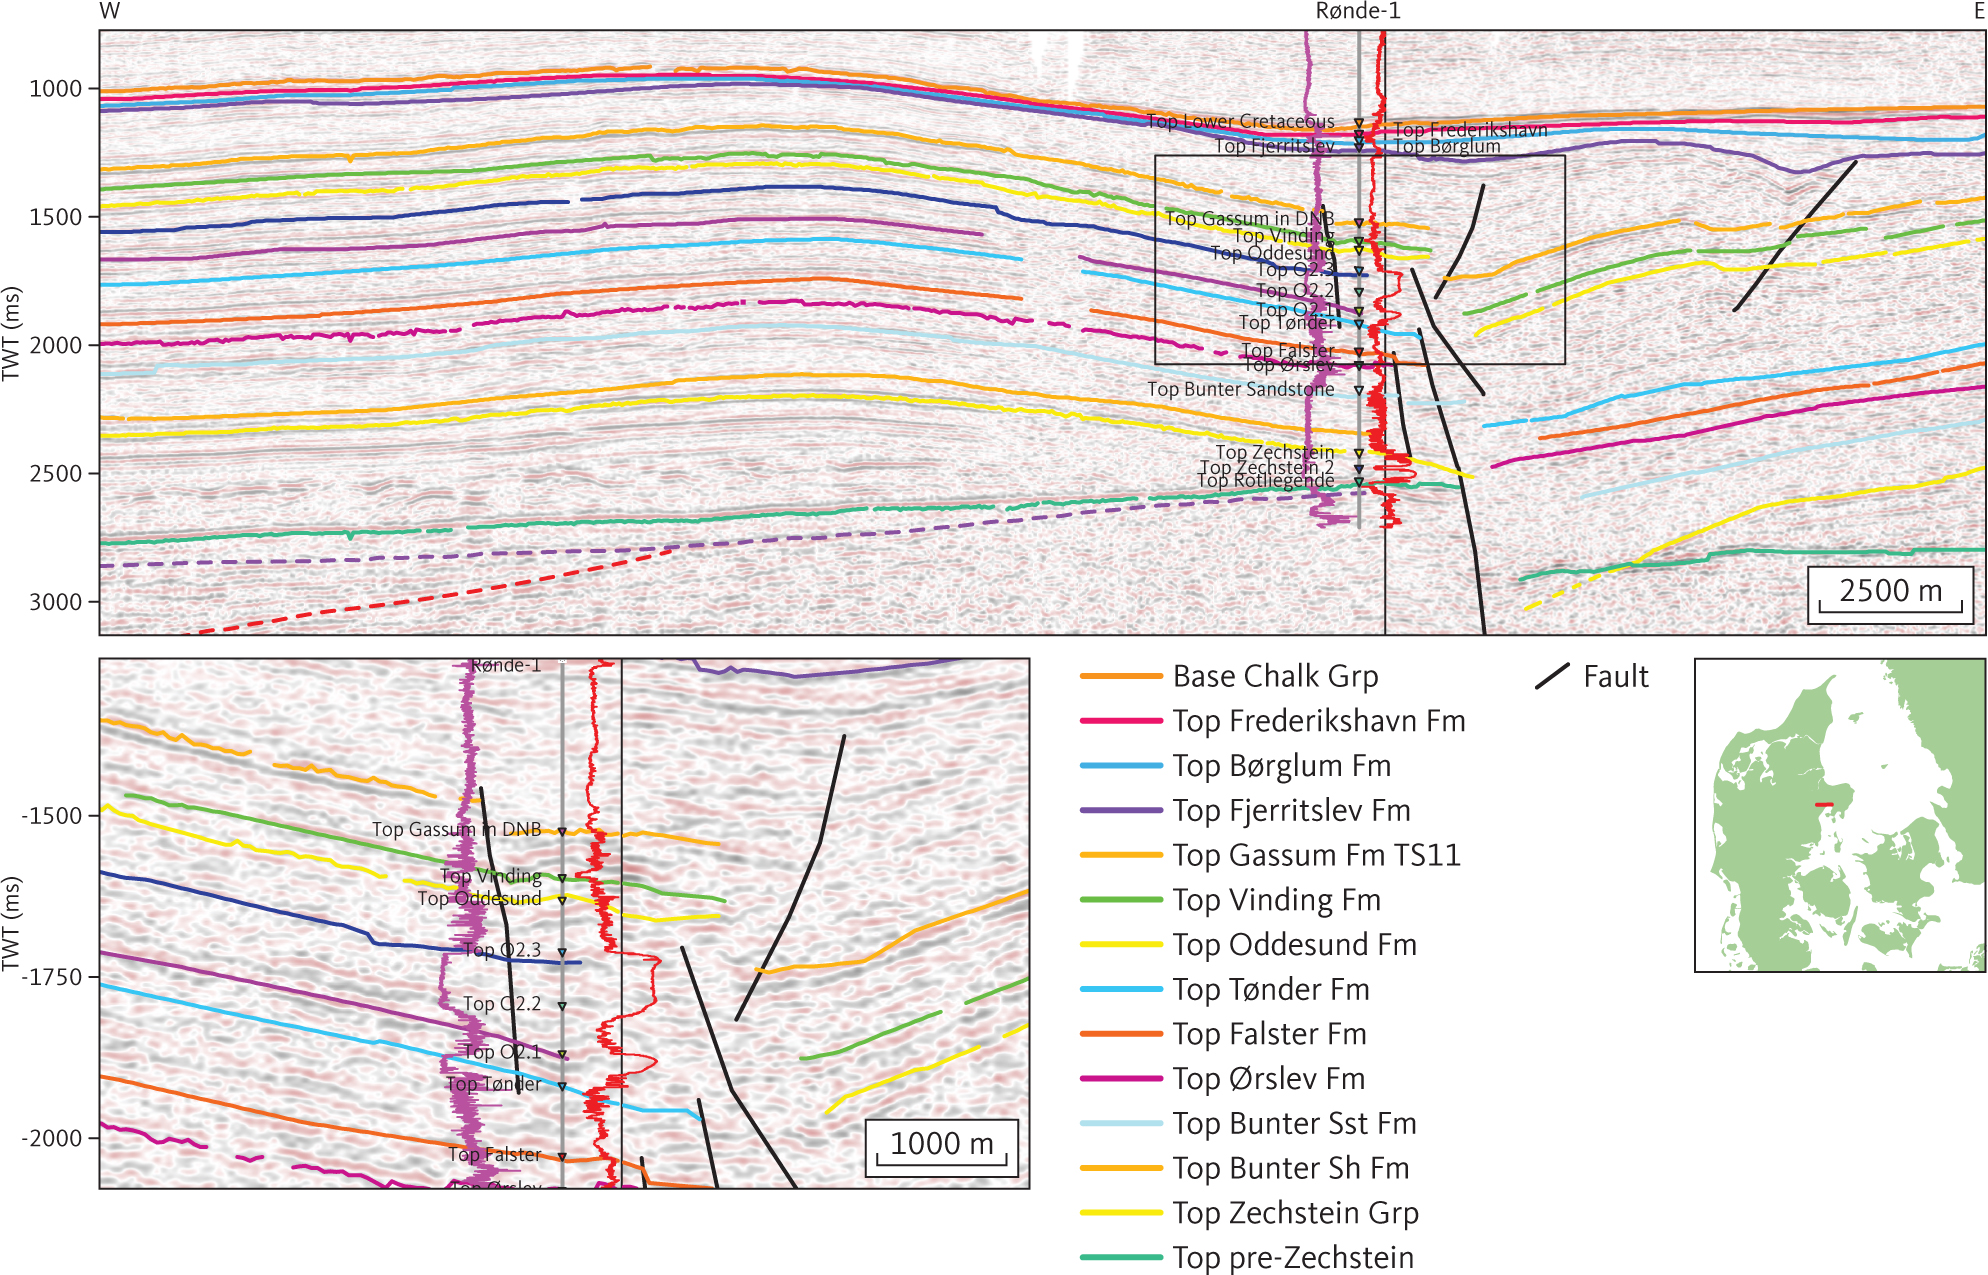
Fig. 42 Composite seismic section (DNJ-600 and -600ext) through the site of the Rønde-1 borehole illustrating basement tectonic and salt mobilisation associated with Early Jurassic tectonic activity and salt mobilisation associated with formation of the Middle Cimmerian Unconformity. The purple wavy line below unit G (see Section 3.6.4) ties with a Devonian–Carbonifeous hiatus in the Rønde-1 well. The stippled red horizon truncated by the unconformity is tentatively interpreted as the rift-onset unconformity at the base of Middle Rotliegend volcaniclastics. The gamma-ray and 7 electrode laterolog logs are shown as purple and red lines, respectively, on either side of the well path with highest values to the right. The inset figure to the left illustrates the log pattern associated with the two distinct halitic layers O2.1 and O2.3 that can be traced throughout the central part of Danish Basin in Jylland. DNB: Danish Norwegian Basin. Inserted map shows the location of the profile.
3.5.2.2 Top of unit F1
The top of unit F1 is generally picked at or just below a distinct, fairly continuous horizon, characterised by moderate to high amplitude reflections, and which correlates with the top of the Vinding Formation (Fig. 34) and corresponds approximately to the sequence boundary SB3 of Nielsen (2003). This reflects that the shoreface and associated environments represented by the Gassum Formation were first established in the southern part of the study area and translated northward as the result of marine regression (Nielsen 2003). As mentioned above, the near top Triassic map (Fig. 38) is made by combining the top of unit F1 and the top of unit FN. The actual top of the Triassic is located within unit E2 and has not been mapped in this project. Overall, the top of unit F1 is found at a depth of c. 2000–3000 m in the central part of the Danish Basin and at shallower depths towards the south-western margin of the basin (Fig. 38). In the southern part of Jylland, including most of the Ringkøbing–Fyn High and the North German Basin, the horizon is absent due to erosion associated with the Valanginian and/or Aalenian unconformities mentioned above.
3.5.2.3 Seismic character unit F1
Seismic unit F1 is generally thin. At the reference section, the Rønde-1 well, the Vinding Formation is 71 m thick, corresponding to two cycles in the seismic profiles. Internal reflections are indistinct but generally sub-parallel to the formation boundaries (Fig. 41). Around the Ringkøbing–Fyn High and above some salt structures, unit F1 is truncated by the Valanginian and Aalenian unconformities.
3.5.2.4 Isochore of unit F1
Overall, unit F1 is fairly uniform in thickness (50–100 m; Fig. 43). The greatest thickness of the seismic unit is mapped in the Odsherred and Øresund basins. Minor local depocentres are seen in connection with some salt structures.
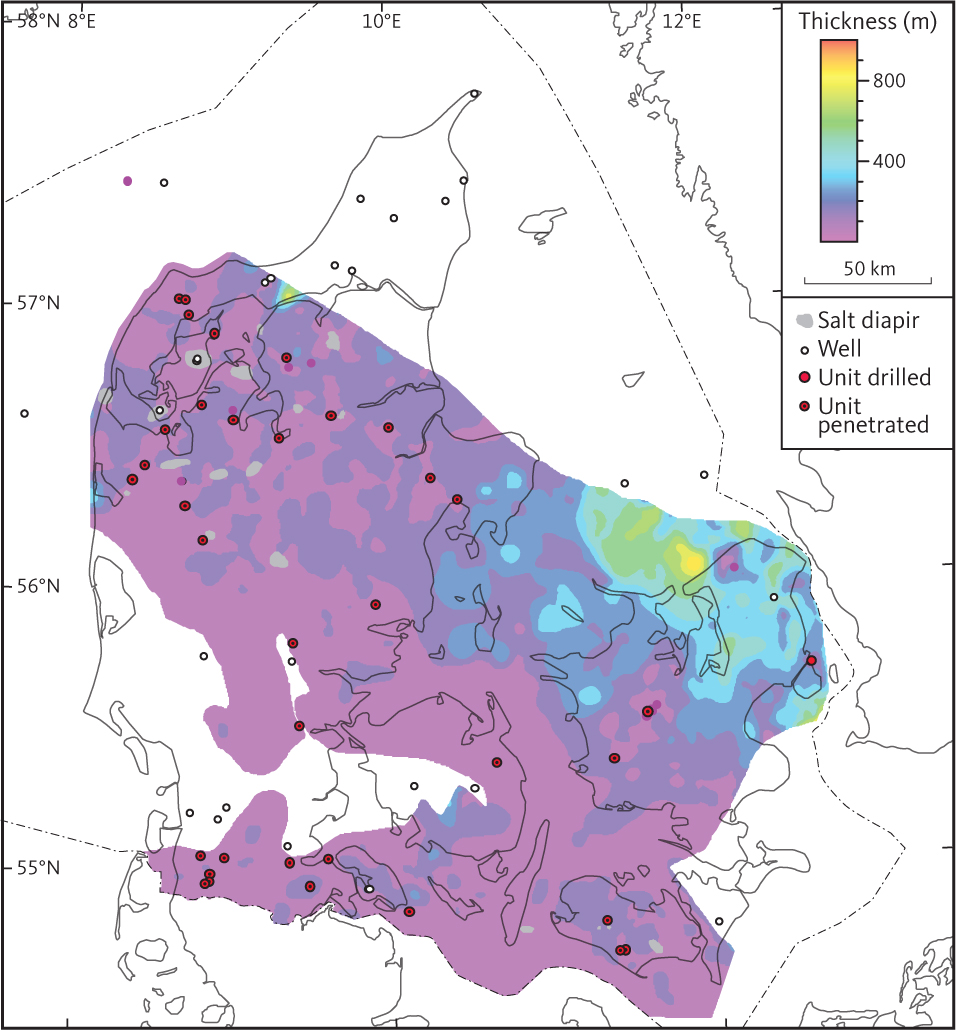
Fig. 43 Isochore of the seismic unit F1 (Vinding Formation).
3.5.3 Seismic unit F2 – Oddesund Formation
3.5.3.1 Background and well data
The seismic unit F2 is mapped throughout most of the Danish and North German Basins (Figs 5, 6), where it corresponds to the Oddesund Formation and its equivalents in the North German Basin (Bertelsen 1978; Nielsen & Japsen 1991). It is absent on the Ringkøbing–Fyn High, presumably due to erosion during formation of the Valanginian and Aalenian unconformities. The seismic unit is not recognised in the Øresund Basin, the Sorgenfrei–Tornquist Zone and on the Skagerrak–Kattegat Platform. However, contemporaneous continental deposits are present in these areas (Bertelsen 1978; Erlström et al. 2018). In wells, the thickness of equivalent units varies from 63 m to 732 m in the Ørslev-1 and Nøvling-1 well, respectively, and in the Oddesund-1 well 1456 m of the formation was drilled without reaching the base of the formation.
In most of the Danish Basin, the Oddesund Formation consists of anhydritic claystones and siltstones with intercalation of evaporitic layers and is considered to represent a sabkha environment (Bertelsen 1978). Identification of the formation in well sections is based on lithological and palaeontological data and petrophysical logs. Bertelsen (1978) subdivided the formation into three members in the Mors-1 well (O1–O3 of Bertelsen 1978). The uppermost member (O3) consists of calcareous claystones and siltstones with some dolomitic limestone intercalations (Bertelsen 1978). Overall, the O3 member is characterised by moderate gamma-ray values (c. 70–80 GAPI) with short period fluctuations within thin intervals (5–10 m) of approximately 10 GAPI. In Mors-1, the gamma-ray values decrease in the lower part of O3 Member.
The O2 member is subdivided into three beds, comprising evaporitic beds (O2,1 and O2,3) at the top and bottom of the member (Bertelsen 1978). These units are characterised by high, fairly constant resistivities (c. 100 Ohmm). These evaporitic beds correlate with pronounced seismic reflections. The intervening O2,2 unit is mainly composed of claystones and siltstones with downward increase in calcareous and anhydritic intercalations. The lower member, O1, consists mostly of claystone and in the Mors-1 well is characterised by downward-increasing gamma-ray values but with thin intervals showing fluctuations.
3.5.3.2 Top of unit F2
The top of unit F2 in the Danish Basin is generally of moderate amplitude and parallel to internal reflections in the upper part of the unit (Fig. 41). It can be tied from well to well throughout the southern part of the Danish Basin. In the North German Basin, the top of unit F2 is a reflection of similar character and structural expression (Figs 41, 44). Similarly, to the top of unit E2, the top of unit F2 deepens towards the north-east and around salt diapirs (Fig. 45). Shallow depths are found above the Møn High and above salt pillows in the basin areas.
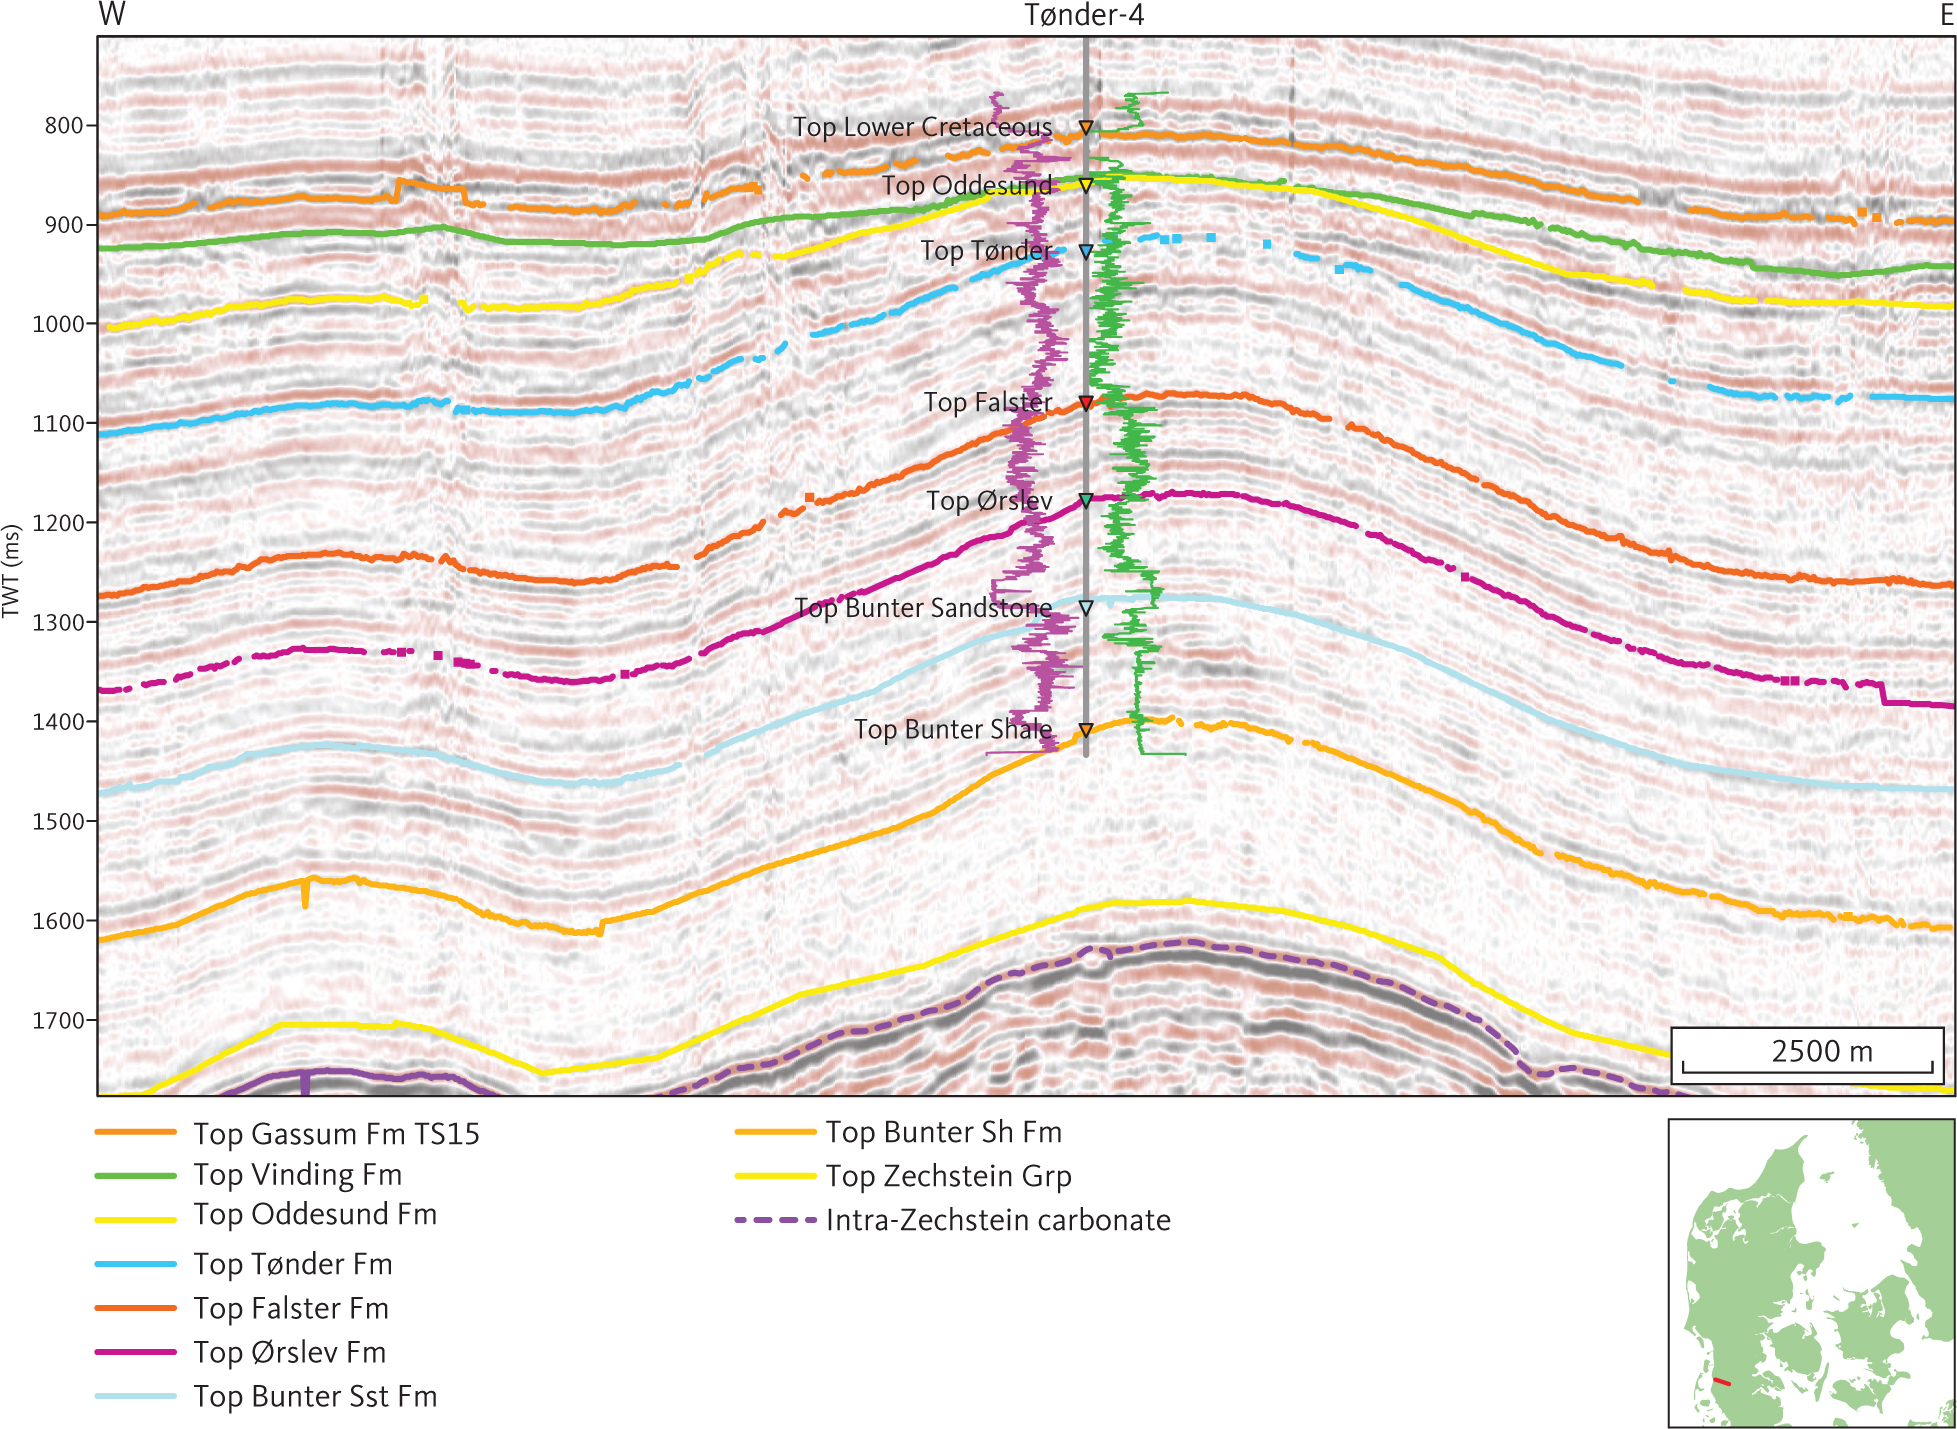
Fig. 44 Seismic section (D8118) at the site of Tønder-4 well. The gamma-ray and sonic logs are shown as purple and green lines, respectively, on either side of the Tønder-4 well path, with highest values closest to the well trace. Stippled purple horizon is about 40 ms within seismic unit G (see Section 3.6) and is the reflection from the top of a carbonate horizon in the Zechstein Group (Maver 1995). Inserted map shows the location of the profile.
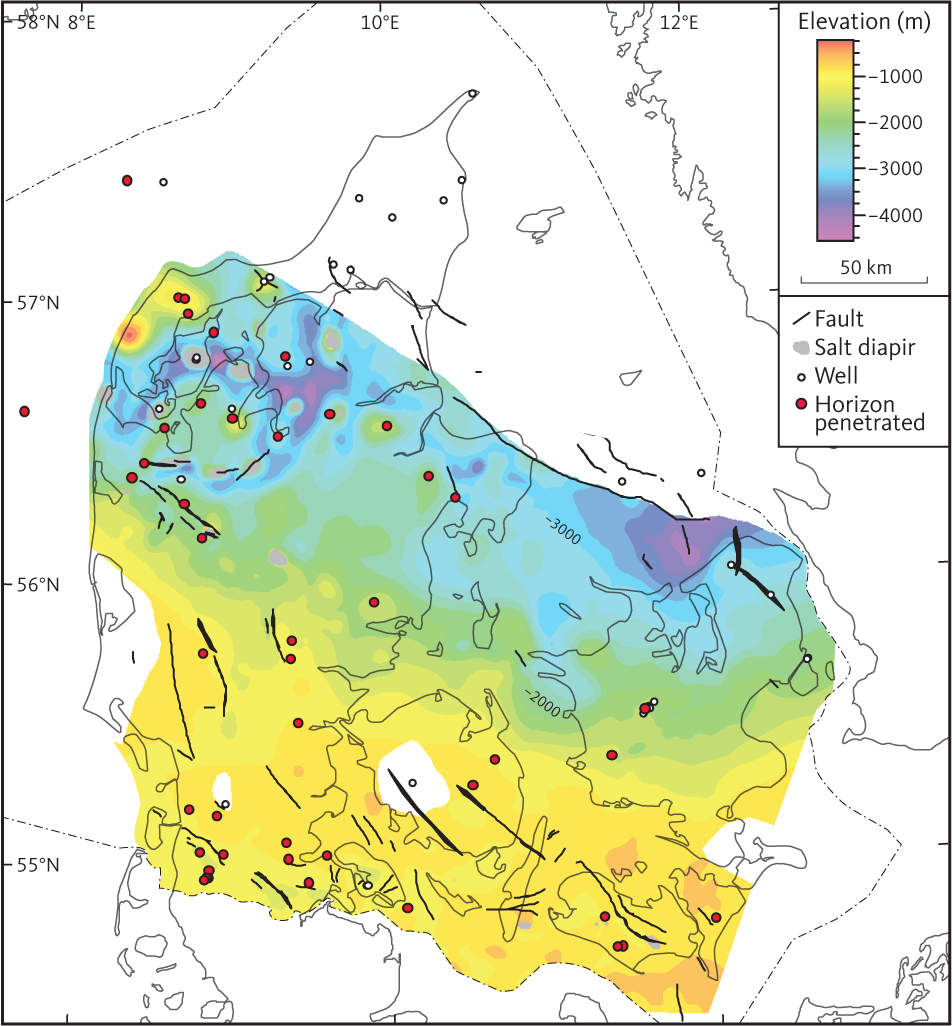
Fig. 45 Depth to the top of seismic unit F2 (Oddesund Formation).
3.5.3.3 Seismic character of unit F2
Unit F2 comprises a succession of variable thickness characterised by mostly moderate amplitude parallel or sub-parallel reflections. Distinct high amplitude reflections are generally present. When tying the seismic profiles to wells, some of these high amplitude reflections correlate with salt beds in the formation (Fig. 42). They can be traced on seismic profiles throughout most of the central part of the Danish Basin, but actual mapping of these seismic horizons has not been carried out in the present study. Near the type section in the Mors-1 well, the lower part of unit F2 laps onto the underlying seismic unit F3, corresponding to the Tønder Formation (Fig. 20). Similar large-scale depositional signatures are common throughout the salt dome province in northern Jylland and in the North German Basin (Figs 42, 46). In the south-eastern part of the study area, unit F2 onlaps unit F4 directly (Fig. 47; Clausen & Pedersen 1999). The unconformity at the base of unit F2 is associated with salt flow, which appears to have been triggered by contemporaneous basement faulting (e.g. Figs 46, 48)
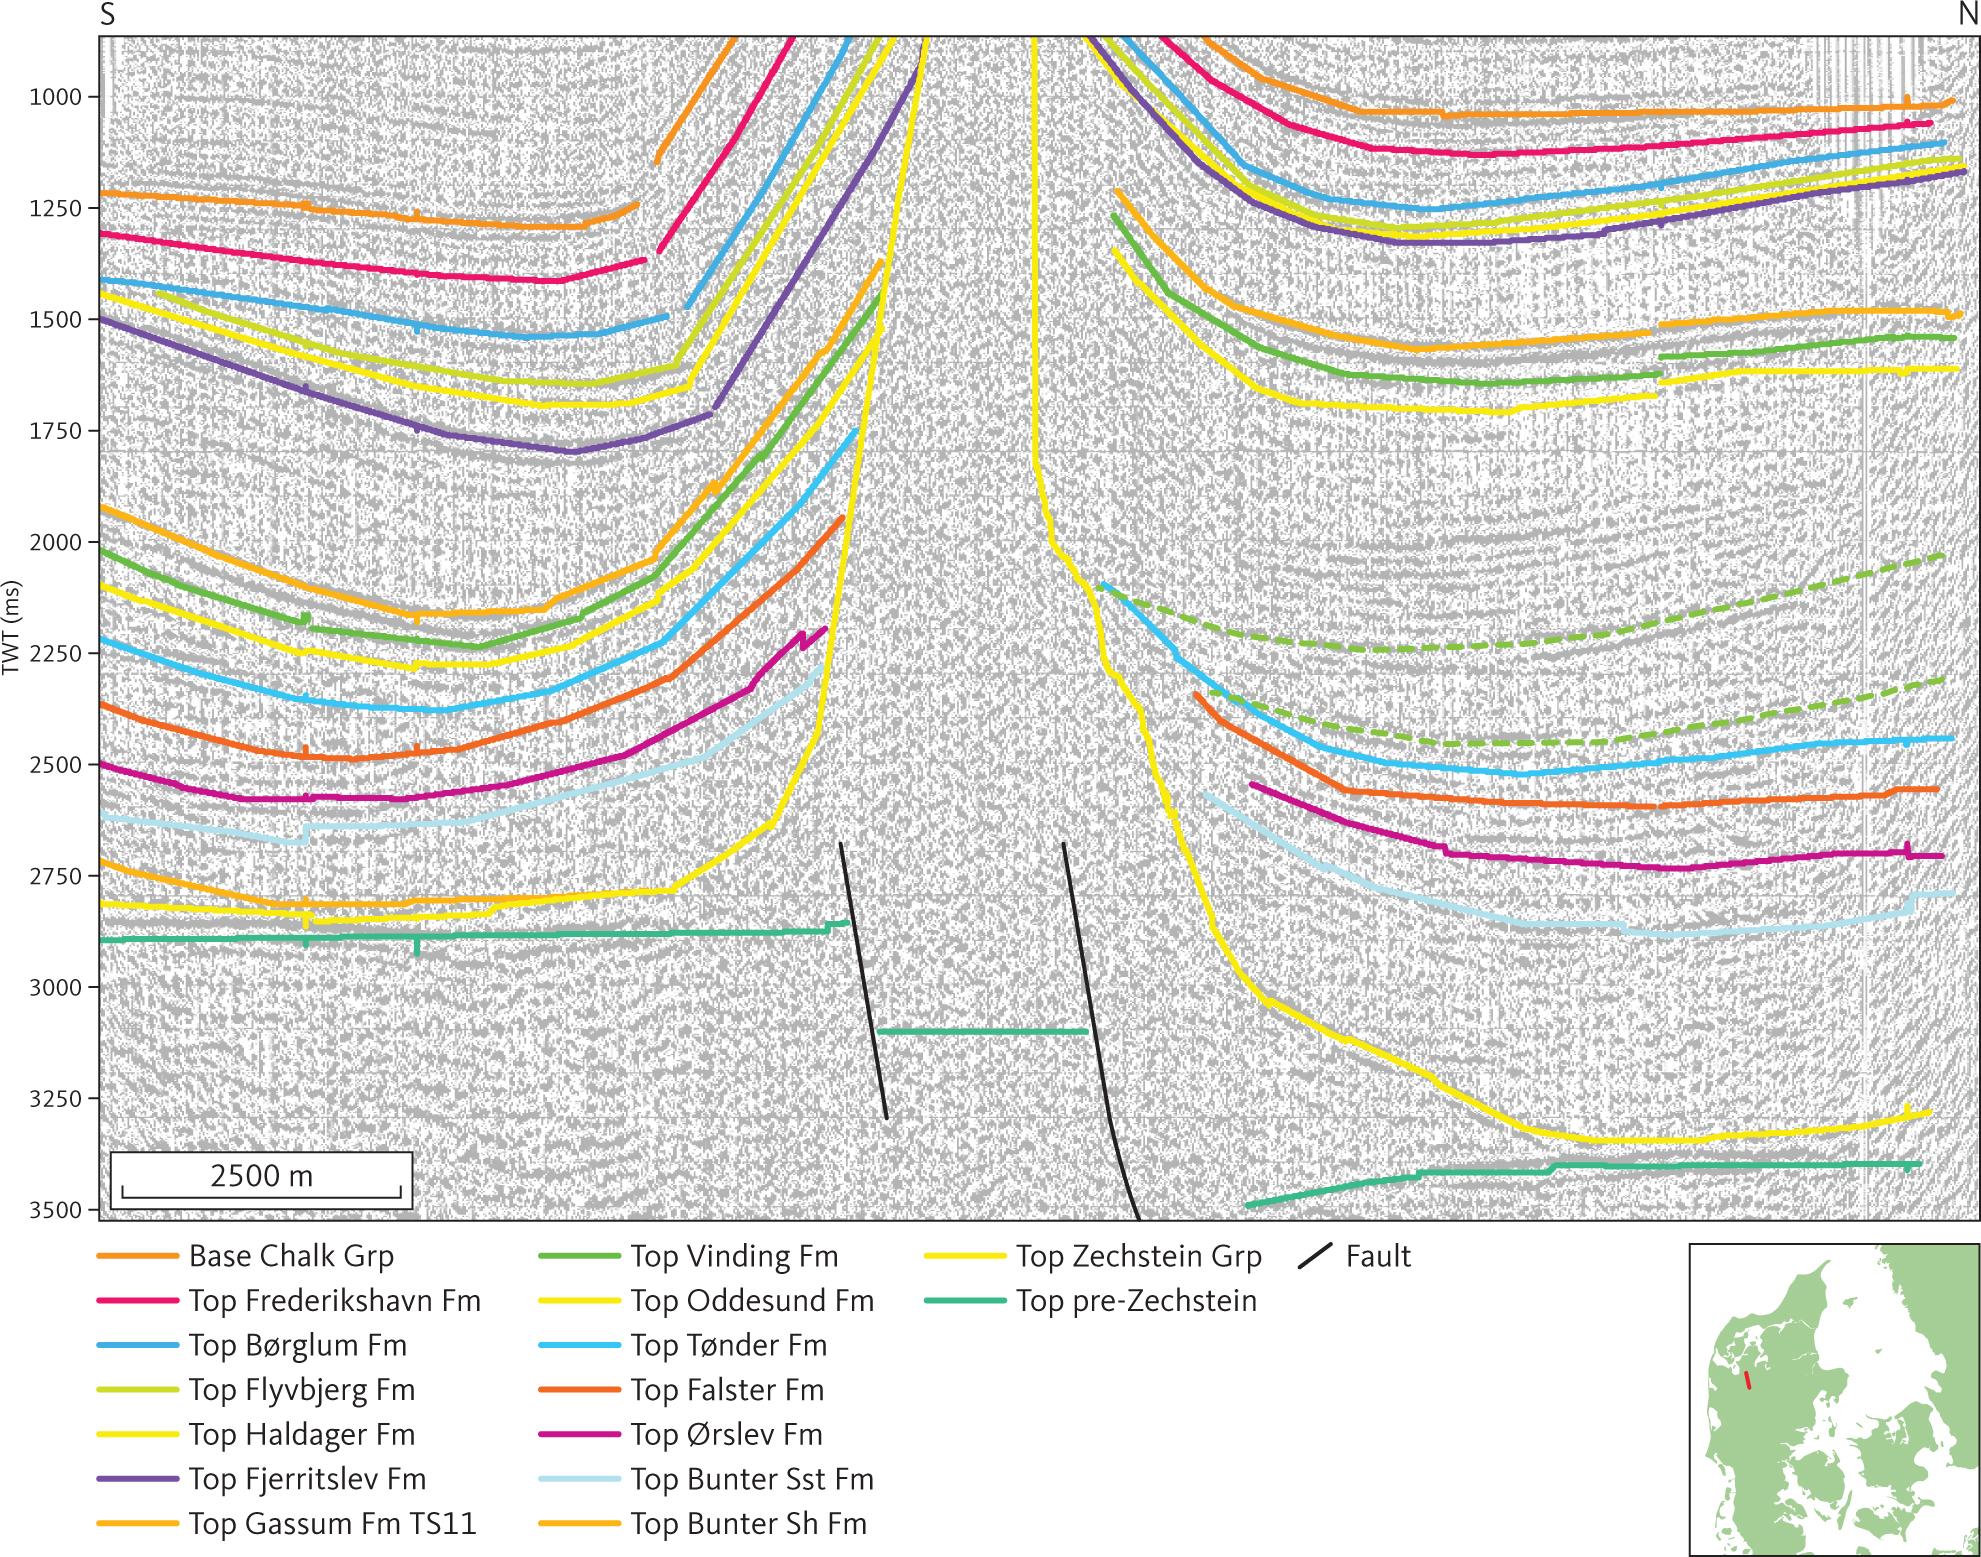
Fig. 46 Seismic section (E7904) across the Sevel salt diapir at the southern boundary fault of Rødding Graben. Note the position of the salt diapir immediately above the two basement faults and large thickness change across the diapir of both unit E1 (Fjerritslev Formation) and unit F2 (Oddesund Formation; see Section 3.5.3). Stippled horizons occur within unit F2 north of the diapir and correspond approximately with the O2.1 and O2.3 salts in the Oddesund Formation. Inserted map shows the location of the profile.
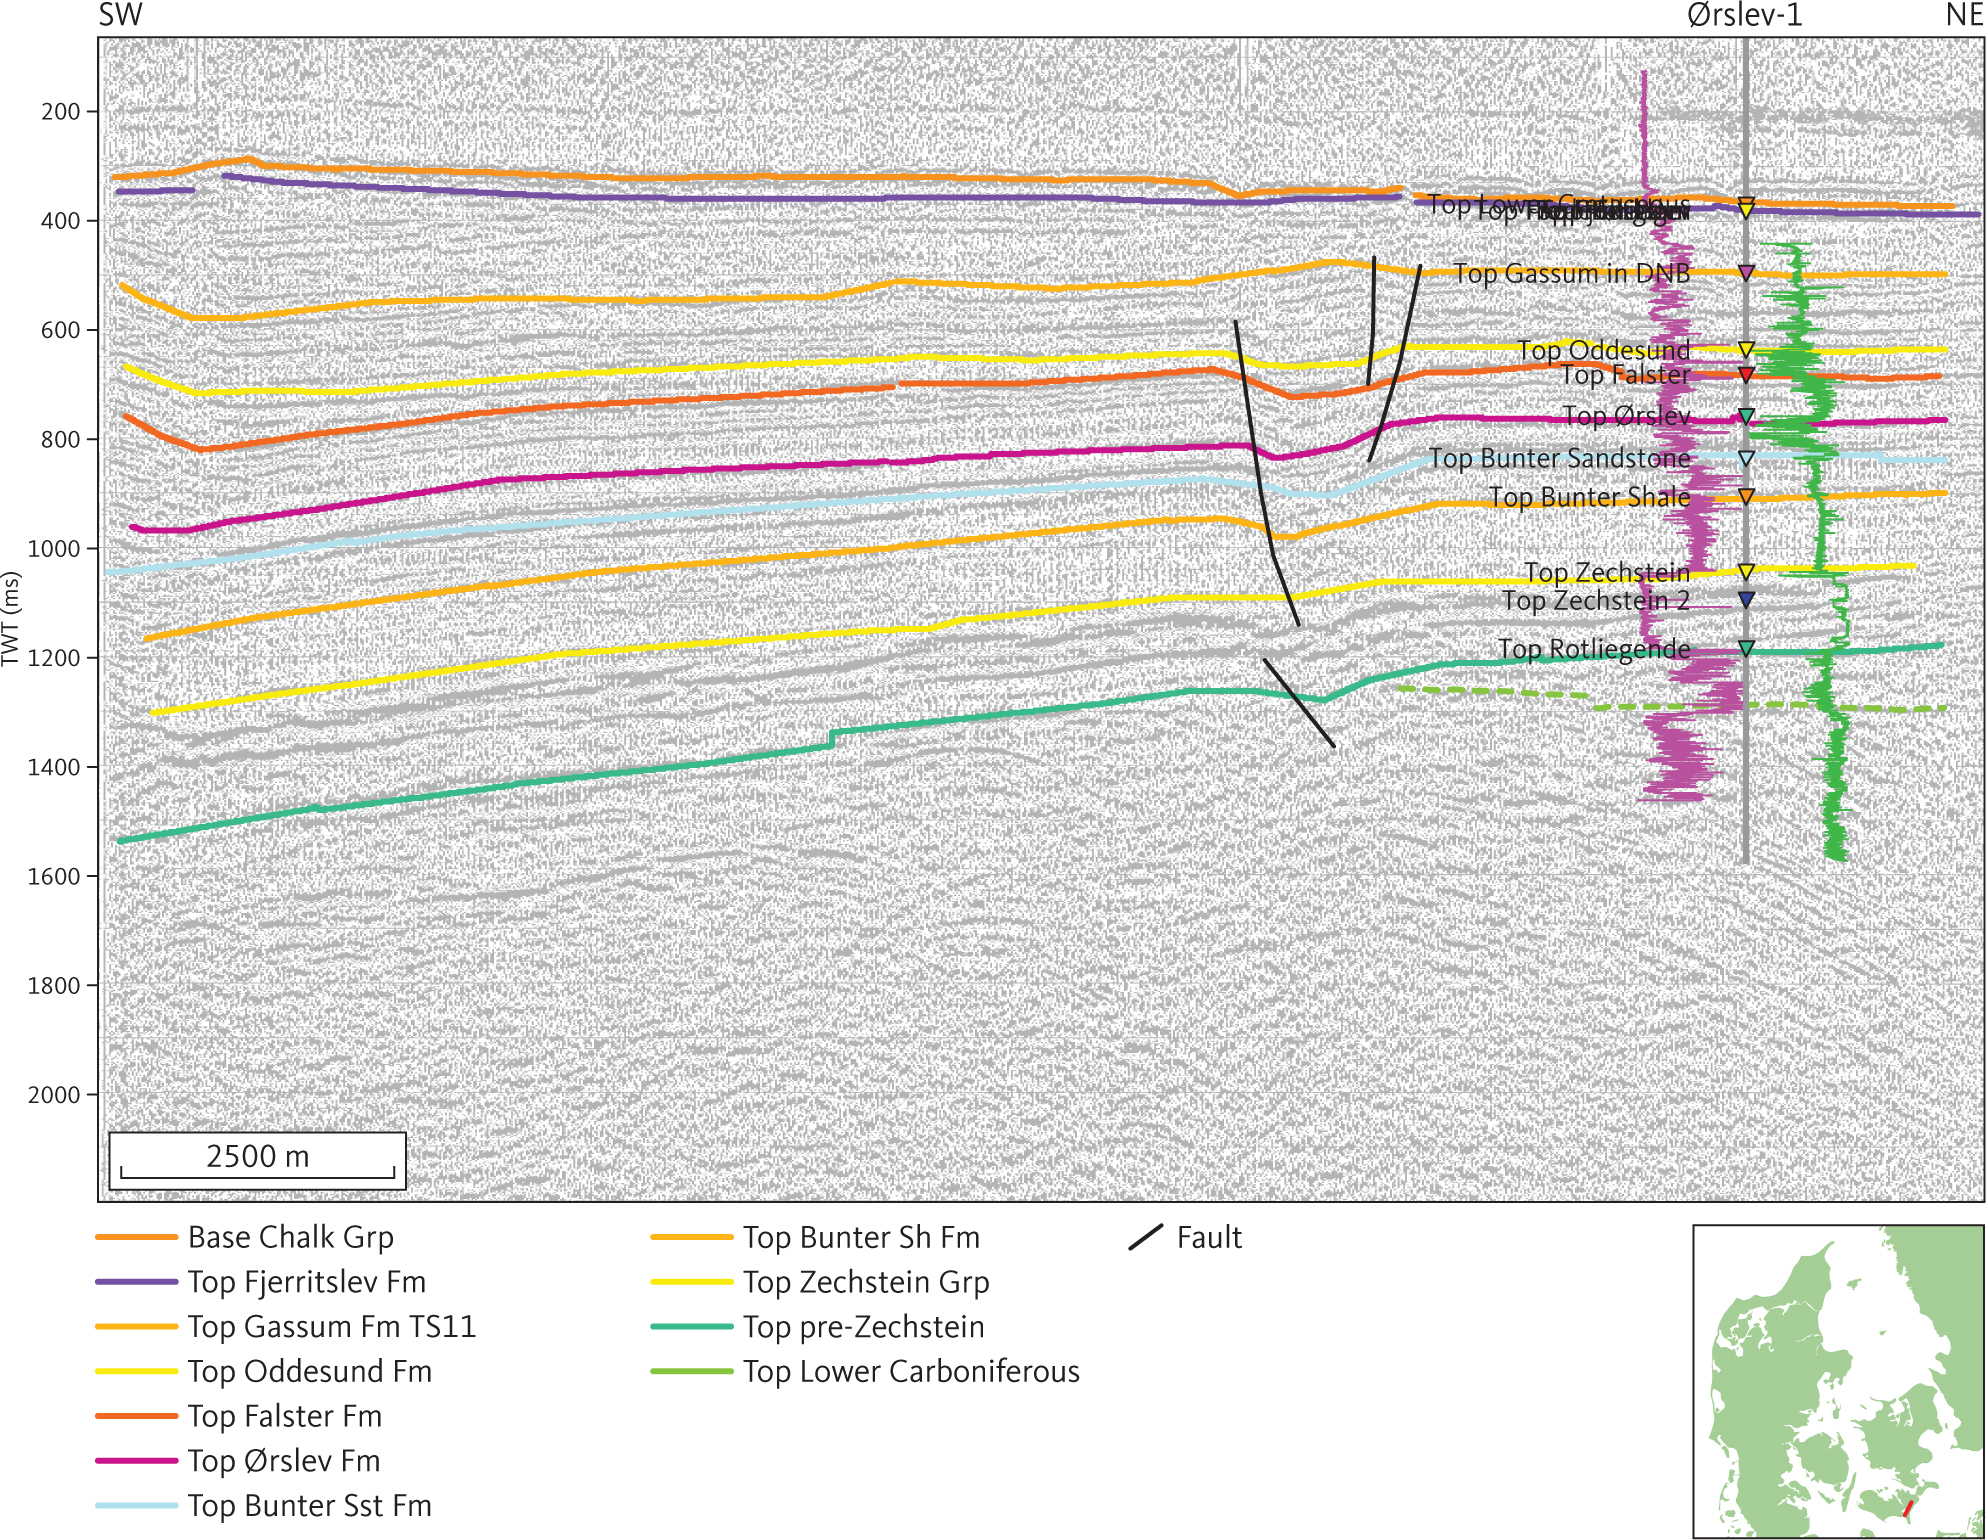
Fig. 47 Seismic section 8102 is tied to the Ørslev-1 well and shows unconformities truncating the Fjerritslev and Oddesund Formations and Lower Cretaceous Carbonates drilled in the Ørslev well. The gamma ray and sonic logs are shown as purple and green lines, respectively, on either side of the Ørslev-1 well path, with highest values closest to the well trace. DNB: Danish Norwegian Basin. Inserted map shows the location of the profile.
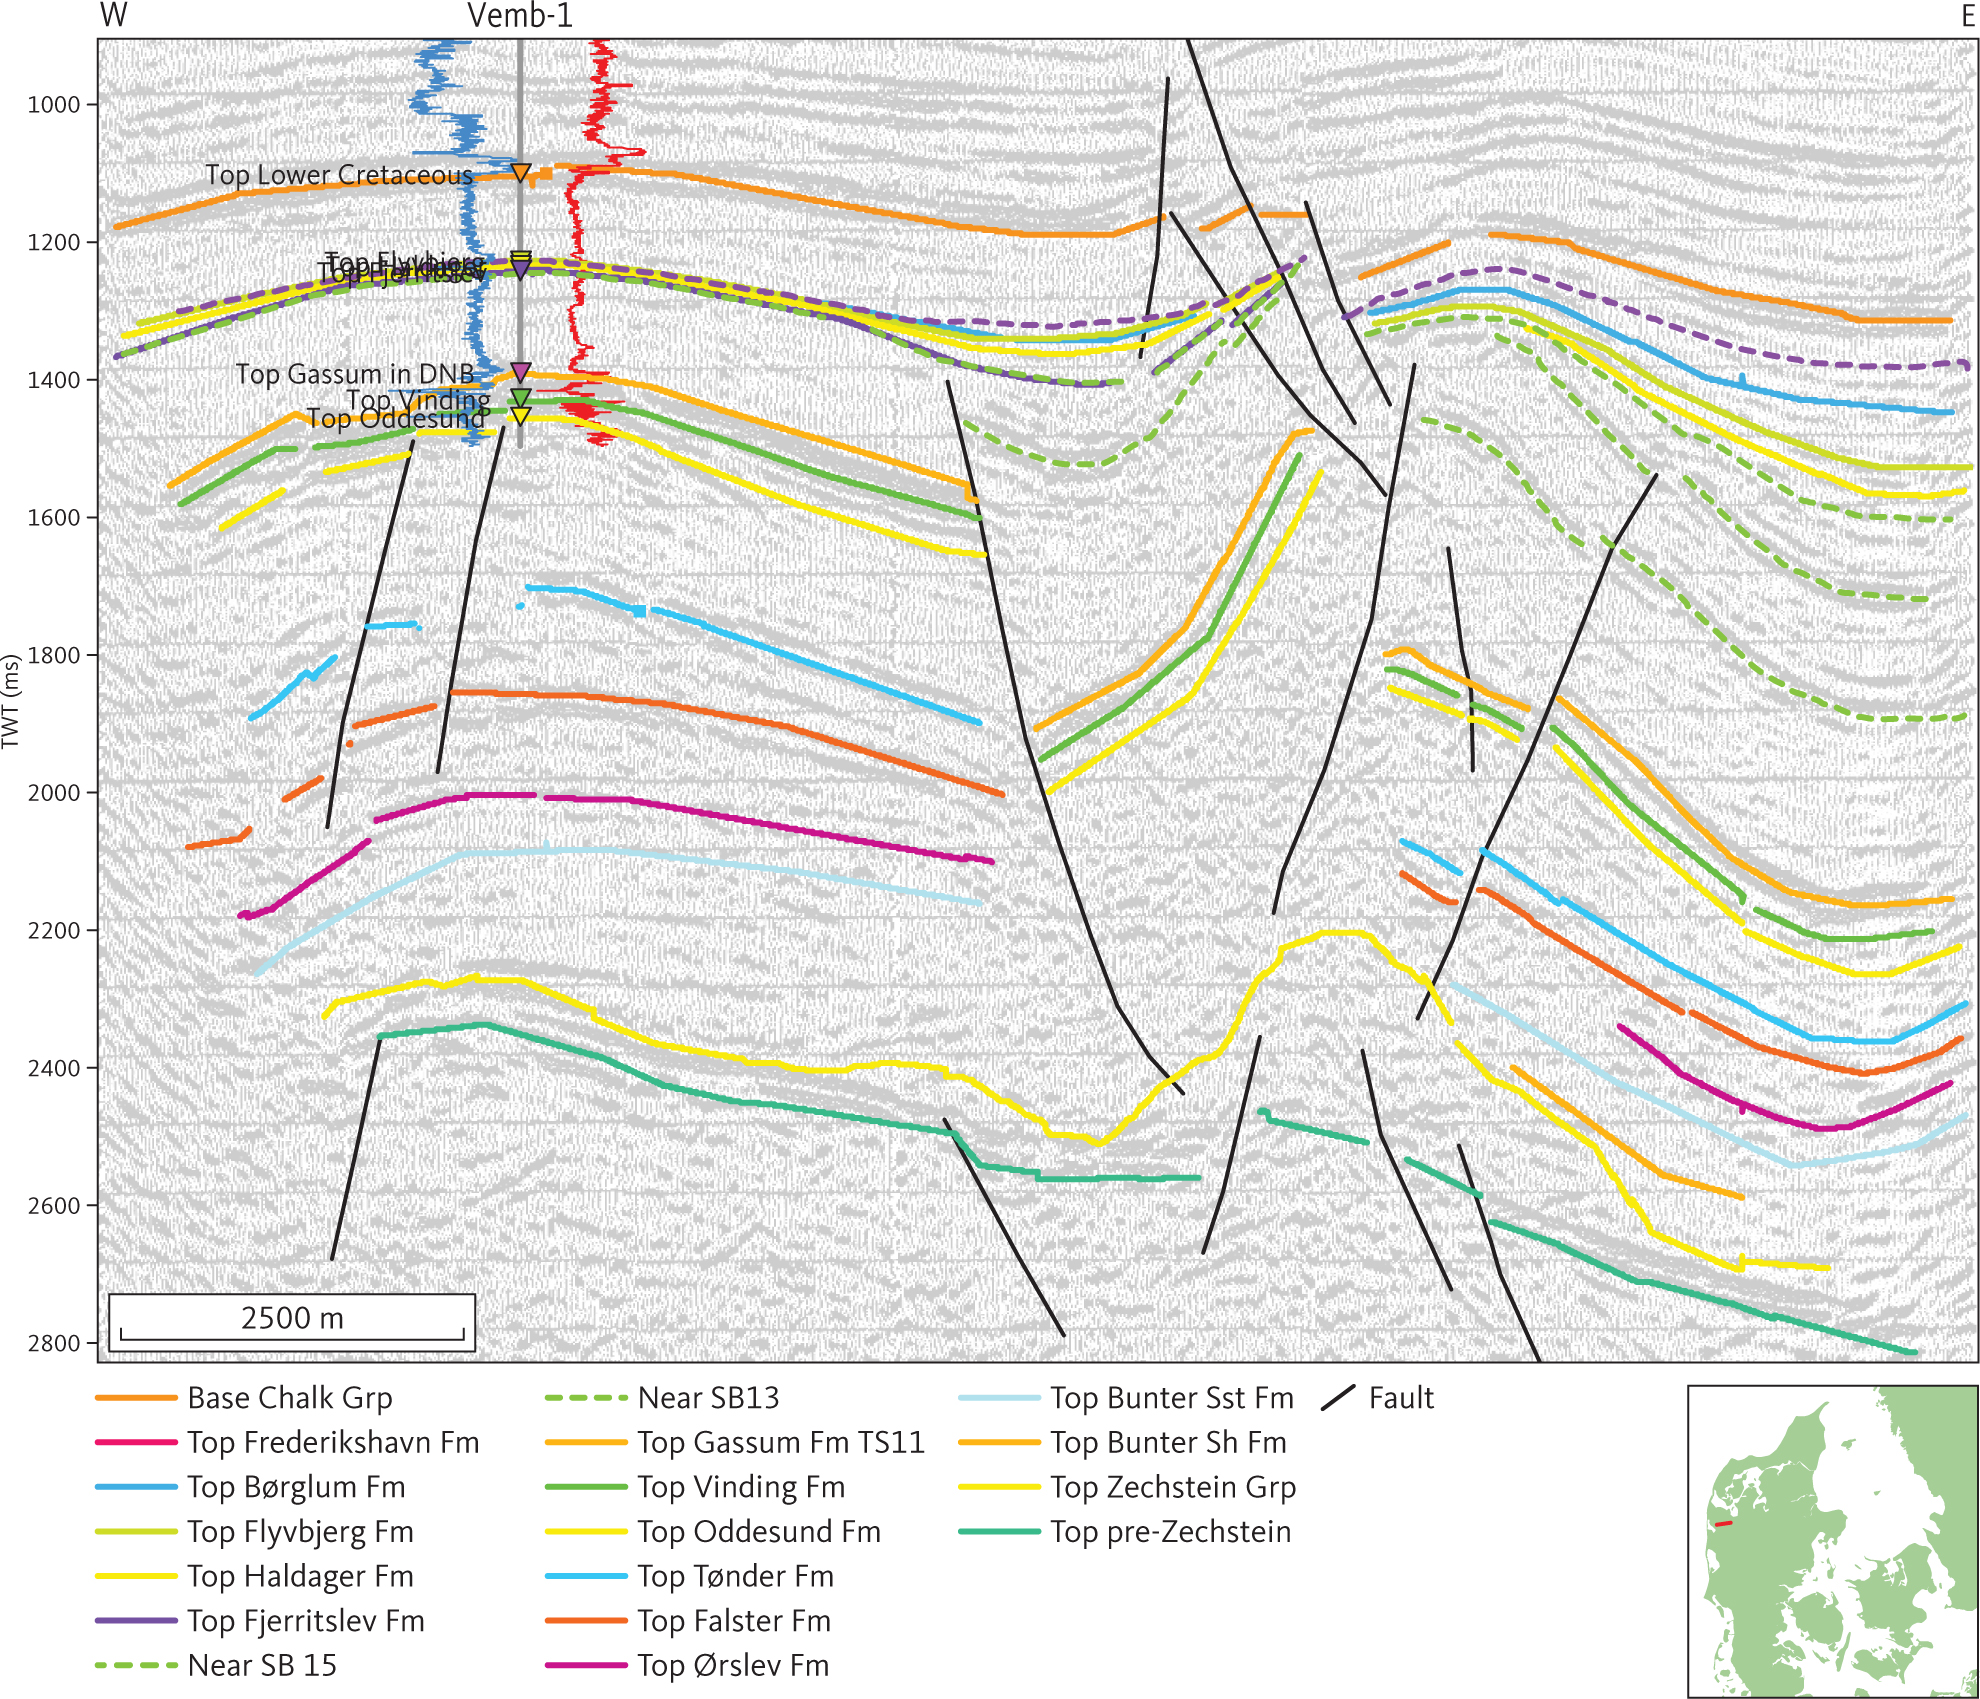
Fig. 48 Seismic section (PH86D007) at the Vemb-1 borehole. Salt mobilisation of the Zechstein Group, a salt detached fault system and basement faults offsetting the pre-Zechstein succession, is evident in this section. Several generations of activity are evident in the detached fault system: the most significant occurring during deposition of the unit E1 (Fjerritslev Formation). Horizons representing SB13 and SB15 of Nielsen (2003), shown as stippled green lines, highlight syn- and post-depositional faulting of the Fjerritslev Formation. Activity of basement faults is not constrained in this section. The spontaneous potential and short space resistivity (16”) logs are shown as blue and red lines, respectively, on either side of the Vemb-1 well path with highest values to the right. DNB: Danish Norwegian Basin. Inserted map shows the location of the profile.
3.5.3.4 Isochore of unit F2
The seismic unit F2 is about 200–300 m thick throughout most of the North German Basin, in the Brande Trough and in the southern part of the Danish Basin (Fig. 49). The formation thickens northward in the Danish Basin, where it reaches its maximum of around 2500–3000 m in the Himmerland and Rødding grabens. In the southern part of Kattegat, in the Odsherred Basin, the unit is more than 1000 m thick. The unit is absent above salt diapirs and most of the salt pillows in the Danish Basin.
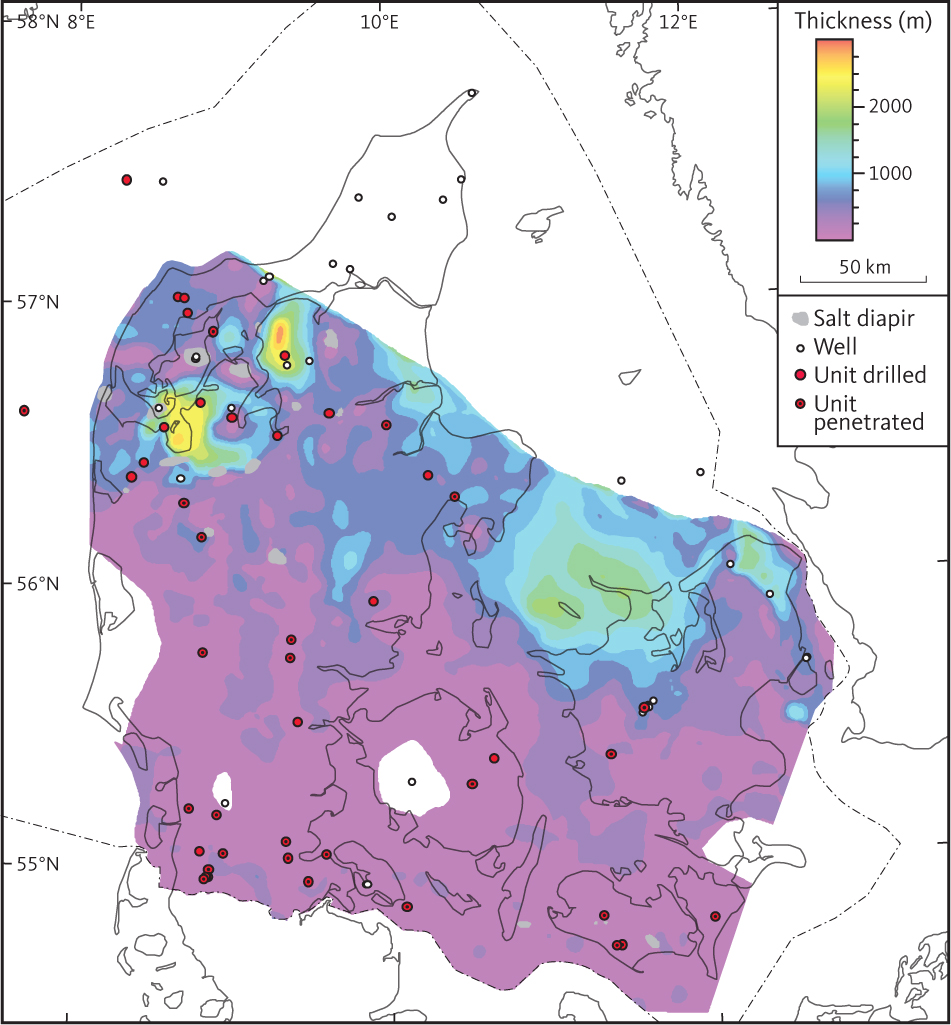
Fig. 49 Isochore of seismic unit F2 (Oddesund Formation).
3.5.4 Seismic unit F3 – Tønder Formation
3.5.4.1 Background and well data
Seismic unit F3 is interpreted throughout the south-western part of the study area. It is approximately equivalent to the Tønder Formation described by Bertelsen (1980). Within the North German Basin, the Tønder Formation comprises a succession dominated by claystones. Two distinct intervals dominated by sandstones are observed in the upper part of the formation (Bertelsen 1980).
The presence of unit F3 is also interpreted in the western part of the Danish Basin, where it correlates with a more than 300 m thick sandstone–mudstone succession observed in the Mors-1, Nøvling-1 and Rønde-1 wells. Unit F3 is not traced into the Sorgenfrei–Tornquist Zone. Stratigraphic equivalents of the Tønder Formation are expected to be present within the Skagerrak Formation. The Tønder Formation was defined based on lithological character in wells and petrophysical logs. The Ladinian age proposed for the formation is based on correlation to corresponding beds in the North German and Polish basins. Biostratigraphic dating is generally not available for Danish wells (Bertelsen 1980; Lindström et al. 2017). Overall, the petrophysical logs display patterns typical for clay-rich successions with intercalations of porous sandstones (Fig. 44). The patterns seen in the gamma-ray logs, in combination with the spontaneous potential logs, are indicative of radioactive minerals (probably feldspars) in the sandstones.
The Top of unit F3 is a distinct unconformity, which on many seismic profiles is characterised by onlap of unit F2 onto unit F3 (Fig. 42). In the south-eastern part of the study area, unit F3 is missing over large areas (Fig. 50), and unit F2 onlaps directly onto unit F4 (Clausen & Pedersen 1999). Overall, the top of unit F3 is shallow: about 1000–1500 m in the North German Basin and the southern part of the Danish Basin, and shallowest above the Ringkøbing–Fyn High (Fig. 50). In the Danish Basin, the top of unit F3 dips toward the north. The horizon is deepest in the Himmerland and Rødding grabens (<5000 m; Fig. 50). Locally, in the northern part of Danish Basin, the top of unit F3 is shallow above salt pillows.
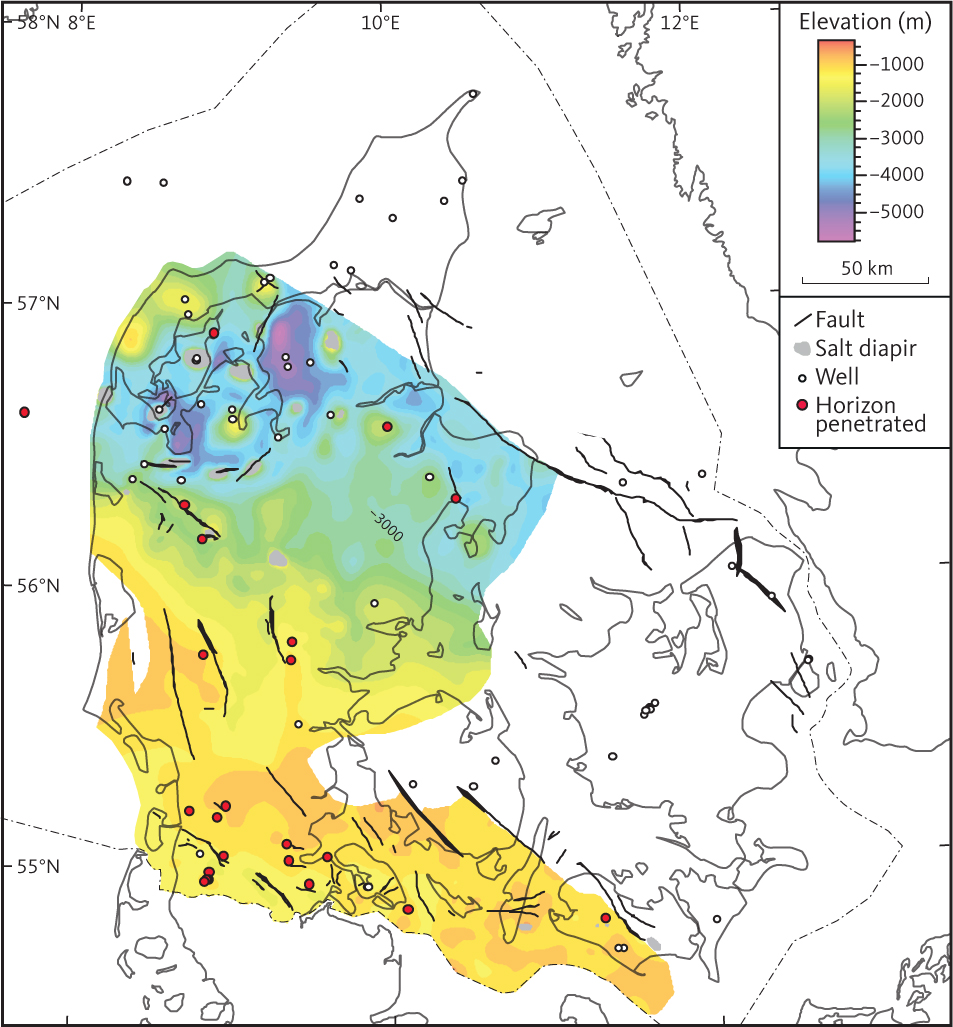
Fig. 50 Depth to the top of seismic unit F3 (Tønder Formation). Salt structures penetrating the unit are indicated in grey.
3.5.4.2 Seismic character of Unit F3
Overall, unit F3 is characterised by a succession of parallel reflections of variable amplitude. Discontinuous bands characterised by clinoforms or slightly undulating reflections are seen at various levels in the unit (Fig. 44). High amplitude reflections are seen as continuous horizons within the unit in the North German Basin.
3.5.4.3 Isochore of unit F3
In the south-eastern part of the study area, unit F3 is missing over large areas; the unconformity at the base of unit F2 cuts down into unit F4 (Fig. 47; Clausen & Pedersen 1999).
The thickness of unit F3 is mainly less than 400 m in the North German Basin and in most of the Danish Basin (Fig. 51). It is present as a c. 200 m thick succession over most of the western part of the Ringkøbing–Fyn High. The maximum thickness of the unit is in the Himmerland Basin and Fjerritslev Trough where the unit is c. 500 m thick.
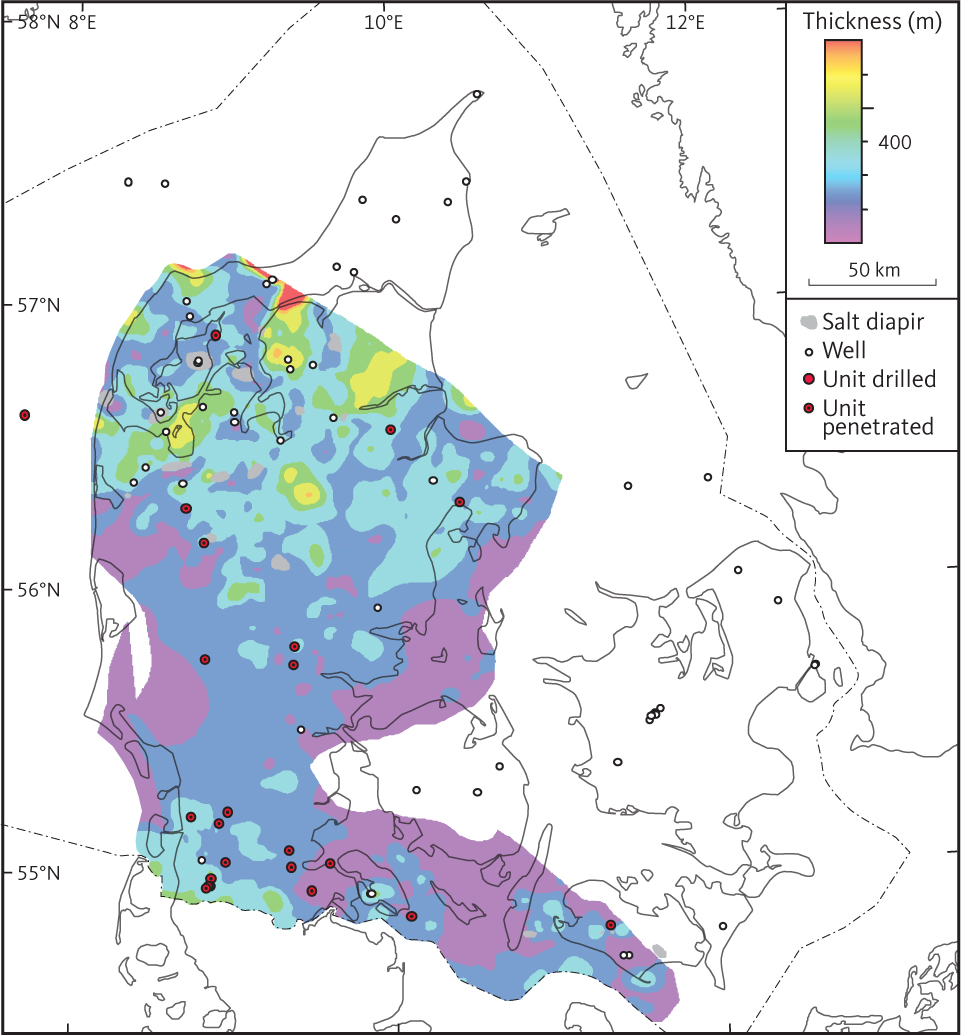
Fig. 51 Isochore of seismic unit F3 (Tønder Formation).
3.5.5 Seismic unit F4 – Falster Formation
3.5.5.1 Background and well data
Seismic unit F4 is equivalent to the Falster Formation within the study area (Bertelsen 1980). The Falster Formation is found throughout most of the southern and central part of the study area (Fig. 6) and is penetrated in approximately half of the deep wells in the study area (Fig. 52; Nielsen & Japsen 1991). From these, we can determine that the thickness in wells mostly varies between 100 and 200 m, and the greatest thickness observed in boreholes is 257 m in the Vinding-1 well. In the wells, the Falster Formation is a claystone succession with intercalations of limestones and anhydrites in the upper part. The lower part of the formation is characterised as interbedded claystones and limestones and the amount of carbonate decreases upwards (Bertelsen 1980). The depositional environment of the lower part of the formation is interpreted as marginal marine, while the upper part is considered to record a warm, shallow marine or sabkha environment (Bertelsen 1980). Towards the north and east, beds resembling the continental Skagerrak Formation become increasingly common within the Falster Formation (Bertelsen 1980; Michelsen & Clausen 2002). The seismic unit F4 has been interpreted throughout most of the Danish Basin. In the Sorgenfrei–Tornquist Zone, it is not possible to identify the unit owing to the scarcity of good seismic data. In the eastern part of the study area, unit F4 pinches out toward the western flank of the North Sjælland High and the Stevns Block. In the Øresund Basin, unit F4 corresponds to the Falsterbo Formation, a succession of Ladinian lacustrine and shallow marine muddy sandstones with calcareous intercalations (Erlström & Sivhed 2012). The Falster Formation is identified in wells by lithological, palaeontological data and petrophysical logs. In the type section, Rødby-1, gamma-ray readings from the Falster Formation are generally lower than in the lower part of the Tønder Formation and the upper part of the Ørslev Formation. Upward-increasing gamma-ray readings are seen in the upper part of the Falster Formation. High resistivity peaks, possibly related to anhydritic intercalations, are seen in the upper part of the succession.
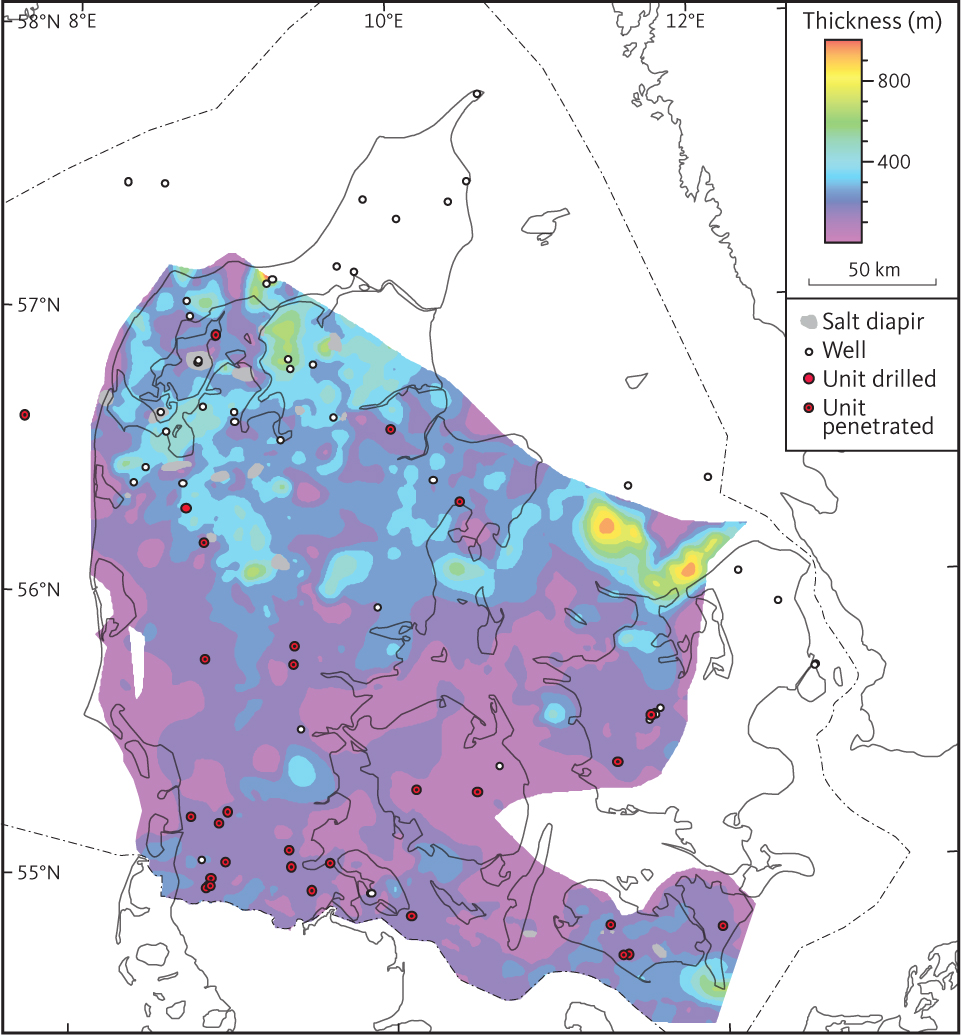
Fig. 52 Isochore of seismic unit F4 (Falster Formation).
3.5.5.2 Top of unit F4
The top of unit F4 is mostly a continuous horizon of high to medium amplitude. In the North German Basin, it is picked at the topmost of a series of regular and parallel reflectors (e.g. Figs 44, 53). It correlates with the boundary between the Tønder and Falster Formations as defined by Bertelsen (1980). The top of unit F4 is picked at the top of the Muschelkalk Formation (Michelsen & Clausen 2002). The depth to the top of unit F4 increases basinwards in the Danish Basin where a maximum depth of more than 5000 m is reached in the Rødding and Himmerland grabens (Fig. 54).
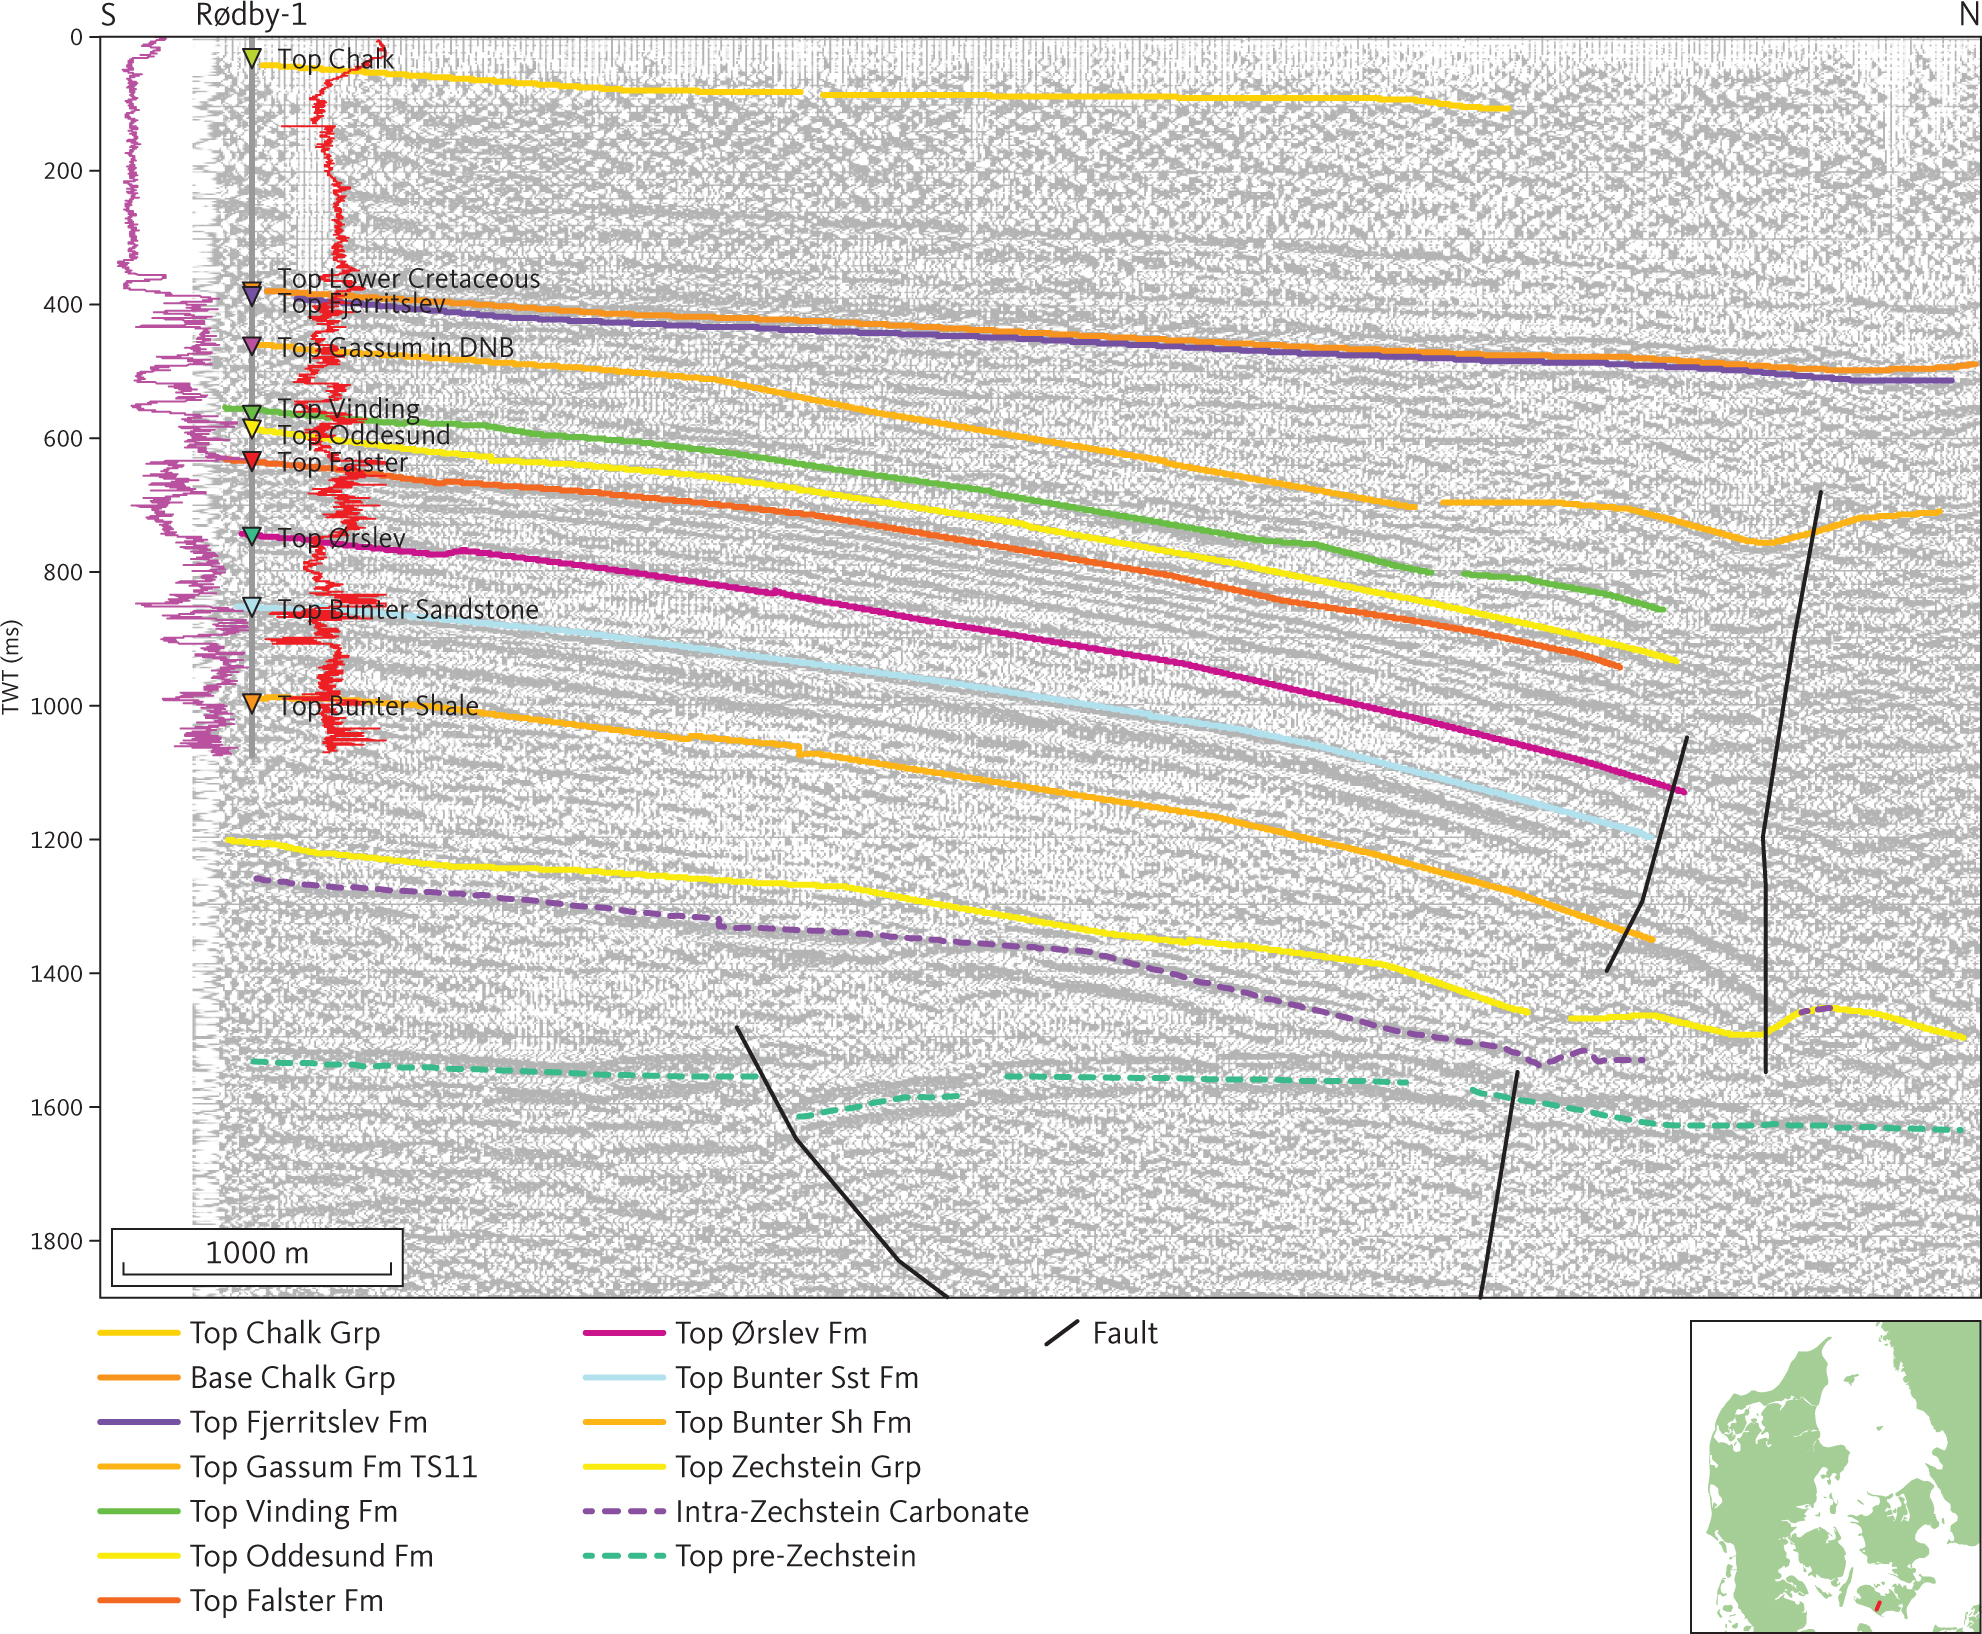
Fig. 53 Seismic section (8109) through Rødby-1 illustrating the layer-cake structure of the Triassic units dominated by continuous, fairly strong reflectors. The gamma-ray and 38” resistivity logs are shown as purple and red lines, respectively, on either side of the Rødby-1 well path with highest values closest to the well trace. DNB: Danish Norwegian Basin. Inserted map shows the location of the profile.
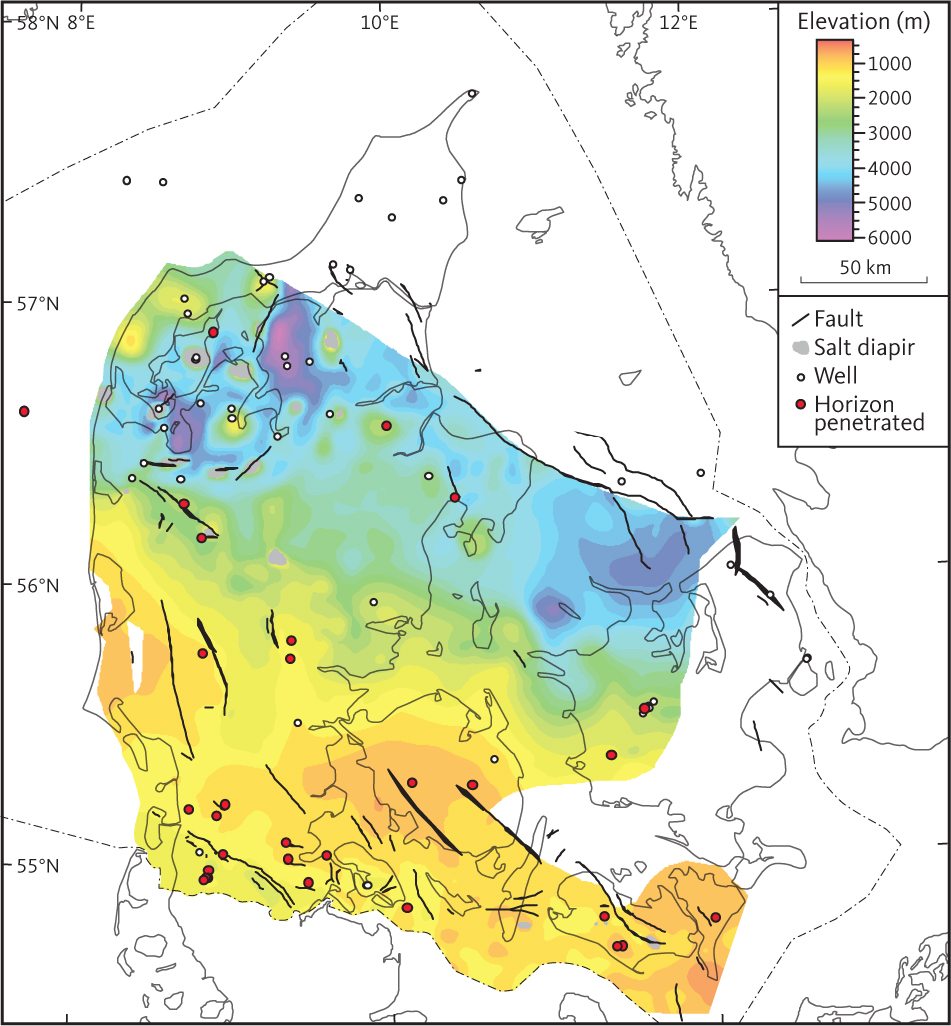
Fig. 54 Depth to the top of seismic unit F4 (Falster Formation).
3.5.5.3 Seismic character of unit F4
Overall, unit F4 is characterised by a conformable succession of parallel reflections (Fig. 44). Reflections from the upper part of the unit are generally of high amplitude and seen as continuous horizons. The seismic signals from the lower part of the unit are of moderate amplitude, and the lateral continuity of the signal is mostly low to moderate, but variable (Fig. 53).
3.5.5.4 Isochore of unit F4
Unit F4 is generally about 100–200 m thick in the North German Basin and in the Brande Trough. On the Ringkøbing–Fyn High, it is generally less than 100 m thick. In the Danish Basin, the thickness of the formation increases toward the north, and maximum thicknesses in the range 600–700 m are observed in both the Rødding and Himmerland grabens (Fig. 52). The thickness of unit F4 is reduced above salt pillows.
3.5.6 Seismic unit F5 – Ørslev Formation
3.5.6.1 Background and well data
The seismic unit F5, equivalent to the Ørslev Formation, is laterally continuous and similar to the Röt Formation of northern Germany (Michelsen & Clausen 2002). The Ørslev Formation is found in most wells in the North German Basin, on the Ringkøbing–Fyn High and in the southern part of the Danish Basin (Nielsen & Japsen 1991). It is 100–200 m thick in wells drilled in the North German Basin and on the Ringkøbing–Fyn High. The greatest thickness of the formation in wells is observed in the Danish Basin with maxima of 452 m and 315 m in the Mors-1 and Gassum-1, respectively. The upper part of the Ørslev Formation comprises silty claystones with anhydrite and some carbonate interbeds. The lower part of the formation is dominated by dolomite and evaporites, and the boundary towards the underlying Bacton Group is the northern extension of the Röt Halite or equivalent anhydrites (Bertelsen 1980). The Ørslev Formation in the Rønde-1, Gassum-1 and Mors-1 wells comprises beds transitional to the Skagerrak Formation (Bertelsen 1980). Interpretation of unit F5 has not been extended into the Sorgenfrei–Tornquist Zone or farther to the north and east. It is possible that sediments contemporaneous with unit F5 are found within unit FN in the north-western part of the study area. In the eastern part of the study area, unit F5 pinches out farther basinwards than unit F3. This interpretation is supported by the suggestion that time-equivalent strata of the Falster and Bunter Sandstone Formations, but not of the Ørslev Formation, are found in Skåne (Bertelsen 1980). Overall, the lower part of the Ørslev Formation may be considered of lagoonal origin in a restricted and arid environment grading upwards into a continental plain setting (Bertelsen 1980). Generally, the upper part of the Ørslev Formation is characterised by higher gamma-ray readings and transit times than in the overlying Falster Formation. The evaporitic and dolomitic intercalations in the lower part of the formation are characterised by low gamma-ray and transit time readings and very low resistivities.
3.5.6.2 Top of unit F5
The top of unit F5 has a fairly distinct horizon characterised by overall moderate amplitudes and variable continuity tying to the top of Ørslev Formation (Fig. 47). Locally, the top of unit F5 is picked at the base of the above-mentioned clinoform packages in the lower part of unit F4. The top of unit F5 is shallowest, about 1000 m, over the Ringkøbing–Fyn High (Fig. 55). Both to the north and the south of the high, the horizon dips into the major basins. The greatest depths (more than 6000 m) are attained in the Rødding and Himmerland grabens. The Brande Trough probably connected the Danish and North German basins. Local highs associated with salt structures are seen in the salt dome province.
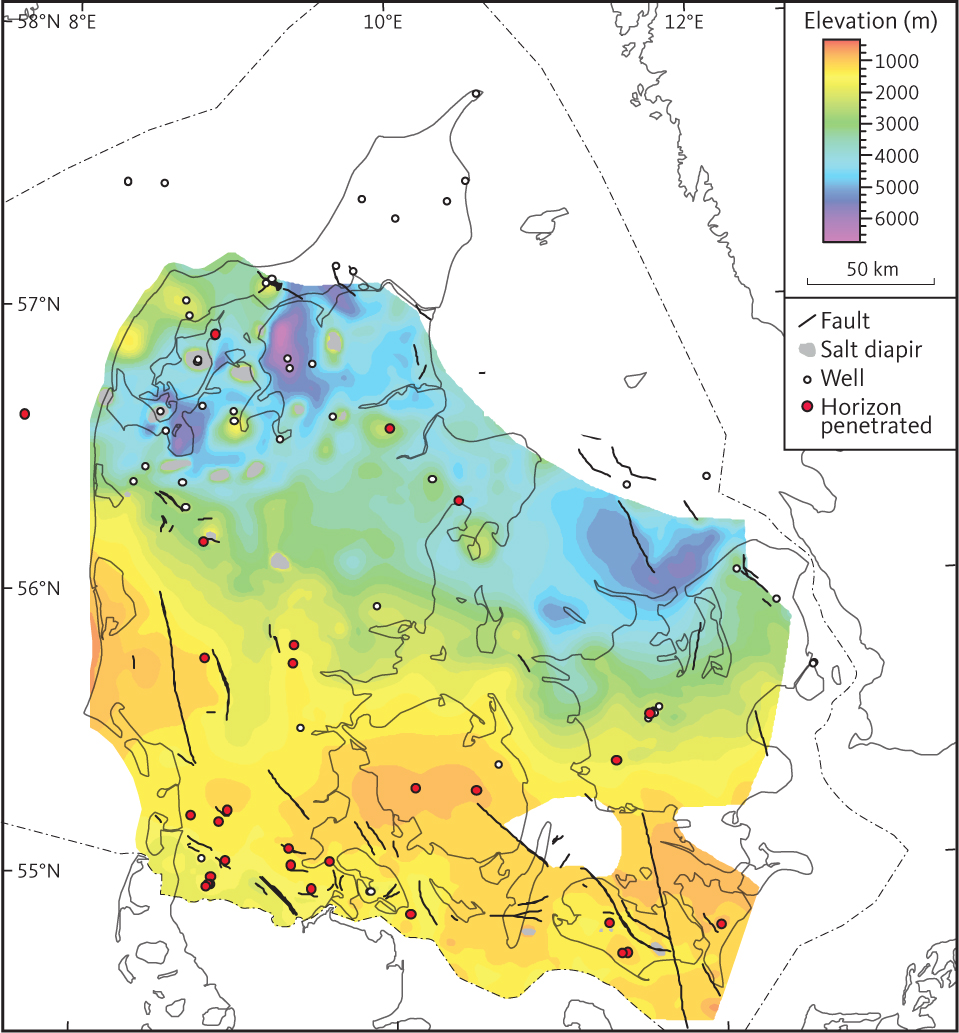
Fig. 55 Depth to the top of seismic F5 unit (Ørslev Formation).
3.5.6.3 Seismic character of unit F5
At the type locality of the Ørslev Formation, the Ørslev-1 well, the formation is thin (115 m) and the corresponding unit F5 is characterised by low to moderate amplitude reflections of low lateral continuity (Fig. 47). At Kegnæs-1, the formation appears to be subdivided into clinoform units. This subdivision of unit F5 is reflected in the petrophysical logs of Kegnæs-1 (Fig. 41).
3.5.6.4 Isochore of unit F5
Unit F5 is 200–400 m thick in most of the study area (Fig. 56). In the Himmerland and Rødding grabens, the formation reaches a thickness of more than 800 m. Minor local depocentres of the Ørslev Formation are found between salt pillows, especially in salt dome province.
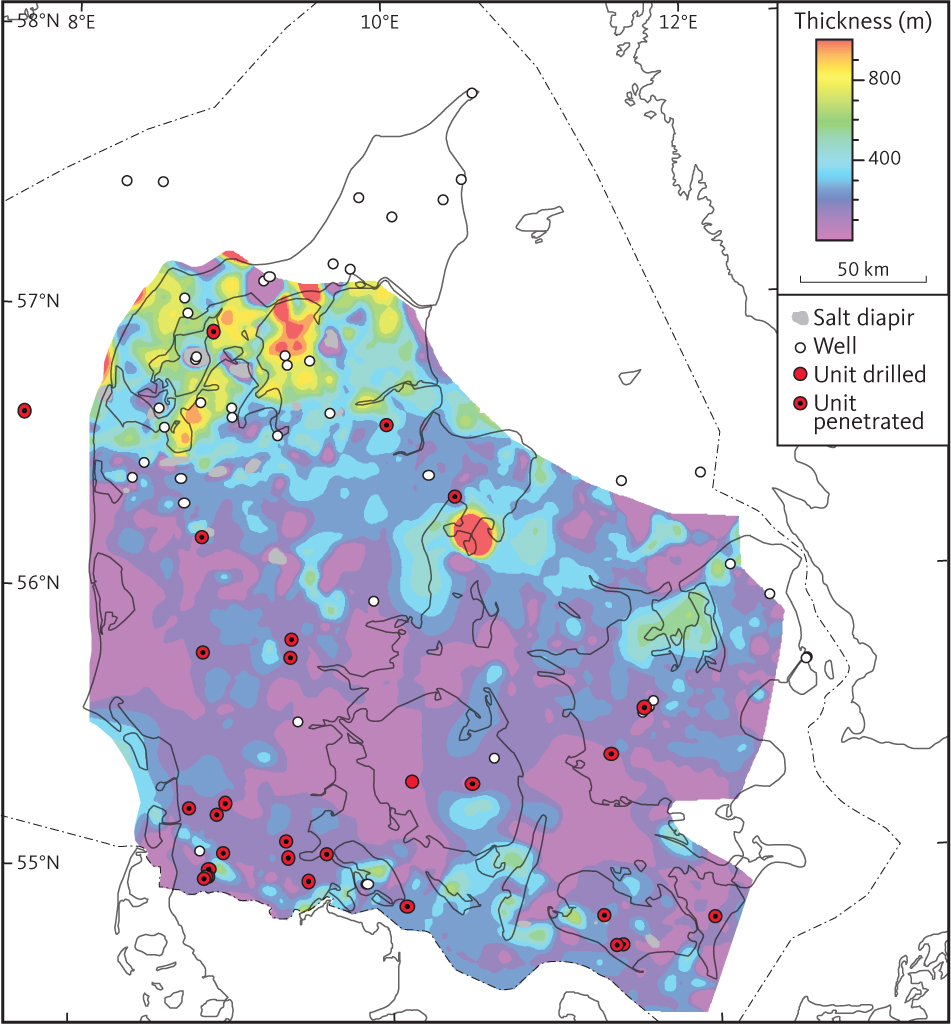
Fig. 56 Isochore of the F5 unit (Ørslev Formation).
3.5.7 Seismic units F6 and F7 – Bacton Group
The Bacton Group comprises the Bunter Sandstone and Bunter Shale Formations (seismic units F6 and F7, see below), which in the North German Basin are distinct lithostratigraphic units (Bertelsen 1980). The group is reached in seven wells in the Danish Basin, whereas it has been drilled in all but two wells in the North German Basin (Nielsen & Japsen 1991). North of the Ringkøbing–Fyn High, the Bacton Group grades into the Skagerrak Formation. Equivalents of the seismic horizons corresponding to the top of the Bunter Sandstone and Bunter Shale Formations extend farther to the north, however, into the area mapped as the Skagerrak Formation where the Bacton Group is not recognised lithostratigraphically in well sections (Nielsen & Japsen 1991).
3.5.8 Seismic unit F6 – Bunter Sandstone Formation
3.5.8.1 Background and well data
Seismic unit F6 corresponds approximately to the Bunter Sandstone Formation (Bertelsen 1980) and is found throughout the southern part of the study area (Figs 5, 6; Nielsen & Japsen 1991). It is recognised in most wells in the North German Basin, where it attains thicknesses of up to c. 300 m. We found that the part of the North German Basin included in the study was marginal during deposition of the Bunter Sandstone. The formation thins over the Ringkøbing–Fyn High, where it is 12 and 57 m thick in the Ringe-1 and Grindsted-1 wells, respectively, whereas it is missing in the Glamsbjerg-1 well where the Ørslev Formation overlies Precambrian crystalline basement. The Bunter Sandstone Formation comprises a characteristic succession of fine-grained sandstones, siltstones and claystones interpreted as desert and sabkha deposits (Bertelsen 1980; Clemmensen 1985). In the North German Basin, it is subdivided into the distinct Solling, Hardegsen, Detfurth and Volpriehausen Members, each distinguished by sandstones at the base (e.g. Bertelsen 1980; Michelsen & Clausen 2002). New interpretation of the wells Søllested-1, Rødby-1, Rødby-2 and Ørslev have shown that the Volpriehausen, Detfurth and Solling Members are present in the first three mentioned wells whereas the Detfurth Member is not recognised in Ørslev-1 (Abramovitz et al. 2024).
Bertelsen (1980) identified the Bunter Sandstone Formation as transitional to the continental Skagerrak Formation in a few wells in the Danish Basin. In the two northernmost wells where Bertelsen (1980) recognised the formation, it is 694 m thick in Gassum-1 whereas in the Mors-1 well, 936 m was drilled without penetrating the formation. Seismic data suggest the formation to be at least 1200 m thick in this area. Pedersen & Andersen (1979) interpreted the Bunter Sandstone Formation in the Gassum-1 borehole to represent a continental, possibly fluvial, setting. Michelsen & Clausen (2002) proposed the extension of the use of Skagerrak Formation to the continental Lower Triassic in the Danish Basin.
The top of the Bunter Sandstone Formation is found in wells from the southern part of the study area recognised by characteristic inflections on the petrophysical logs, which are considered to reflect a sharp boundary between the Röt Halite and anhydritic deposits in the lower Ørslev Formation and sandstones in the top of the Bunter Sandstone Formation. The sandstone members are recognised on gamma-ray and spontaneous potential logs.
3.5.8.2 Top of unit F6
Overall, the top of unit F6 is a distinct continuous horizon of variable amplitude (Figs 41, 47). In the North German Basin, the top of unit F6 is found at a depth of 3000 m, shallowing to about 1000–1500 m over the Ringkøbing–Fyn High (Fig. 57). Faults along the Brande Trough were active during deposition of this unit, and at this stratigraphic level the trough is a distinct structural low, cutting across the Ringkøbing–Fyn High. The top of unit F6 is here found at about 1700–2000 m depth (Fig. 57). The horizon dips northwards from the Ringkøbing–Fyn High into the Danish Basin, where it reaches depths in excess of 5000 m. In the Himmerland and Rødding grabens, the depth to the top Bunter Sandstone seismic horizon exceeds 7000 m (Fig. 57). Locally, the horizon is found at a shallower level than the surroundings, for example on top of salt structures in the north Jylland salt dome province.
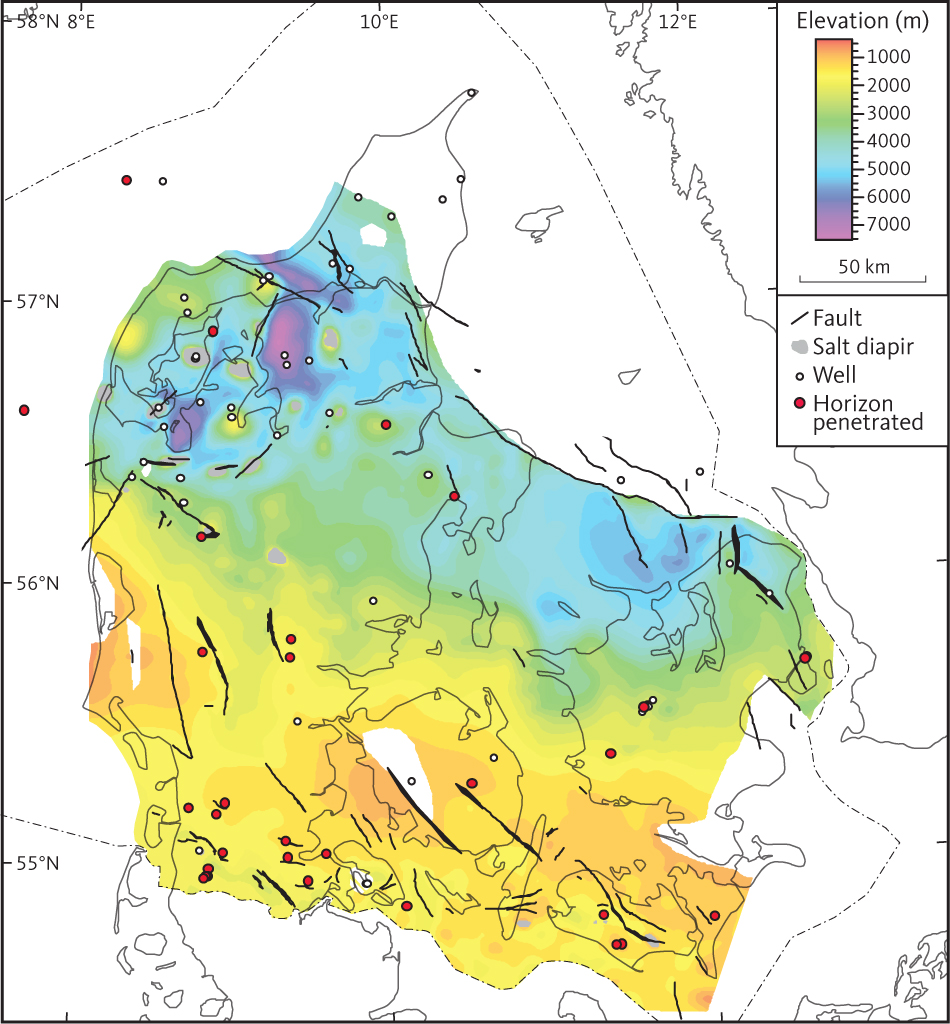
Fig. 57 Depth to the top of unit F6 (Bunter Sandstone Formation).
3.5.8.3 Seismic character of unit F6
In the North German Basin, the seismic character of unit F6 is similar to that of F3, F4 and F5, being characterised by moderate to high amplitude reflections aligned along continuous and parallel horizons (Fig. 53). Zones characterised by clinoforms are observed in the formation, mostly within the middle part. Around the Tønder-3 borehole, a clinoform unit correlates with the middle sandstone beds of the formation (Fig. 44). A pronounced horizon of high amplitude reflections is identified in the lower part of the unit (Fig. 44) and is tied to a porous sandstone in the Solling Member of the Bunter Sandstone Formation that has a high content of nitrogen (N2) gas (GEUS 1981; Hjuler et al. 2019). This sandstone is traced throughout most of the area south of the Ringkøbing–Fyn High. However, the amplitude anomaly associated with nitrogen gas is restricted to an area around the Tønder salt swell (Hjuler et al. 2019).
In the Danish Basin, the internal reflections of unit F6 are mostly parallel, in some cases wavy and/or discontinuous, and the amplitude is more variable than in the North German Basin (e.g. Fig. 41).
3.5.9 Seismic unit F7 – Bunter Shale Formation
3.5.9.1 Background and borehole data
In the North German Basin, seismic unit F7 corresponds to the Bunter Shale Formation that is found in most of the wells in this basin (Fig. 6). The Bunter Shale Formation is absent in Glamsbjerg-1 near the culmination of the Ringkøbing–Fyn High at the Fyn segment. In the Danish Basin, the Bunter Shale Formation is only reached in a few wells in the southern part of the basin, and it is not reported from wells within the central and northern part of basin that penetrate into the Zechstein Group or older rocks. However, unit F7 has been interpreted as continuing into the Northern Marginal Facies Province (Bertelsen 1980), where it comprises the lower part of the Skagerrak Formation. Overall, the Bunter Shale Formation comprises a succession dominated by reddish and brownish claystones with intercalations of siltstones, carbonates and anhydrites. Oolitic limestone beds are found in some wells in the upper part of the formation (the Rogenstein Member of Bertelsen 1980; Michelsen & Clausen 2002). On petrophysical logs, the Bunter Shale Formation is characterised by log patterns typical of mudstone successions. The Rogenstein Member is characterised by thin spikes of low amplitude on the petrophysical logs, reflecting the thin oolitic limestone beds.
3.5.9.2 Top of unit F7
In the North German Basin, the top of unit F7 is a distinct horizon, at the base of the mostly parallel reflections of unit F6. Distinct onlap to the horizon is seen locally and may be associated with early salt movement in the underlying Zechstein Formation (Fig. 41). The top of unit F7 is interpreted as an unconformity associated with an expansion of the basin towards the north, whereas in the vicinity of the Ringkøbing-Fyn High it may rest directly on older units. The horizon is distinct and fairly continuous, of moderate amplitude and parallel with internal reflections of unit F6 (Fig. 44). Farther to the north, the base of seismic unit F6 is less distinct. However, the top of unit F7 is traced into the Danish Basin, and in the Rønde-1 well it correlates to distinct deflections of the sonic log and pattern change on the resistivity logs at a depth of c. 4370 m SSTVD (Fig. 42). In the North German Basin, the top unit F7 is found at 1500–2500 m depth, while in the Danish Basin it is mostly found at depths from about 2000–6000 m (Fig. 58). Unit F7 is missing on parts of the Ringkøbing–Fyn High but is found in both the Brande Graben and the Storebælt Trough.
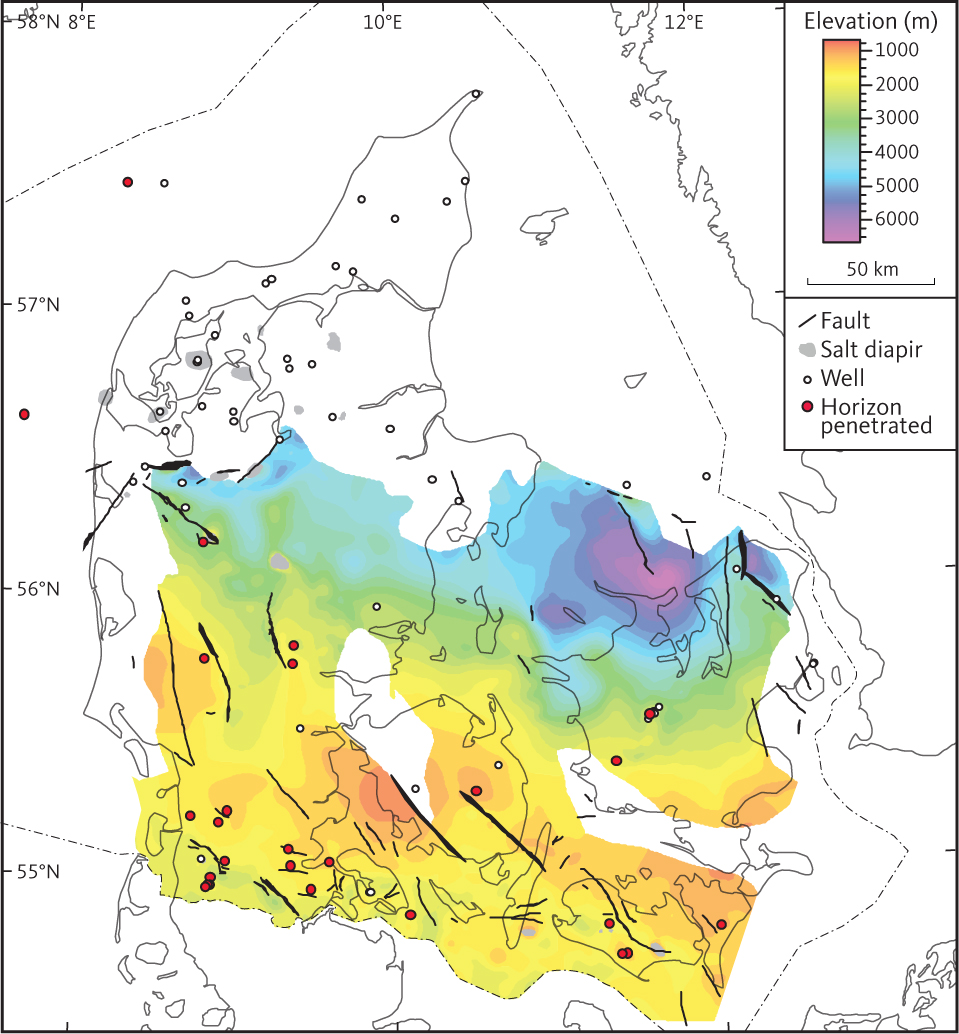
Fig. 58 Depth to the top of unit F7 (Bunter Shale Formation).
3.5.9.3 Seismic character of unit F7
In the North German Basin and the Danish Basin, the internal reflections of the Bunter Shale Formation are characterised by low to moderate amplitude and are arranged along mostly low continuity parallel or sub-parallel horizons (Fig. 44).
3.5.10 Isochore of the combined units F6 and F7
The Bacton Group is thickest south and north of the Ringkøbing–Fyn High. In the Danish Basin, localised depocentres of more than 2000 m are found in the Himmerland and Rødding grabens and NW of Sjælland (Fig. 59). In the North German Basin, localised depocentres are recorded in the Glückstadt Graben. The Bacton Group is absent locally on top of salt diapirs. The thickness distribution of the Bacton Group shows that halokinesis occurred mostly after the group had been deposited.
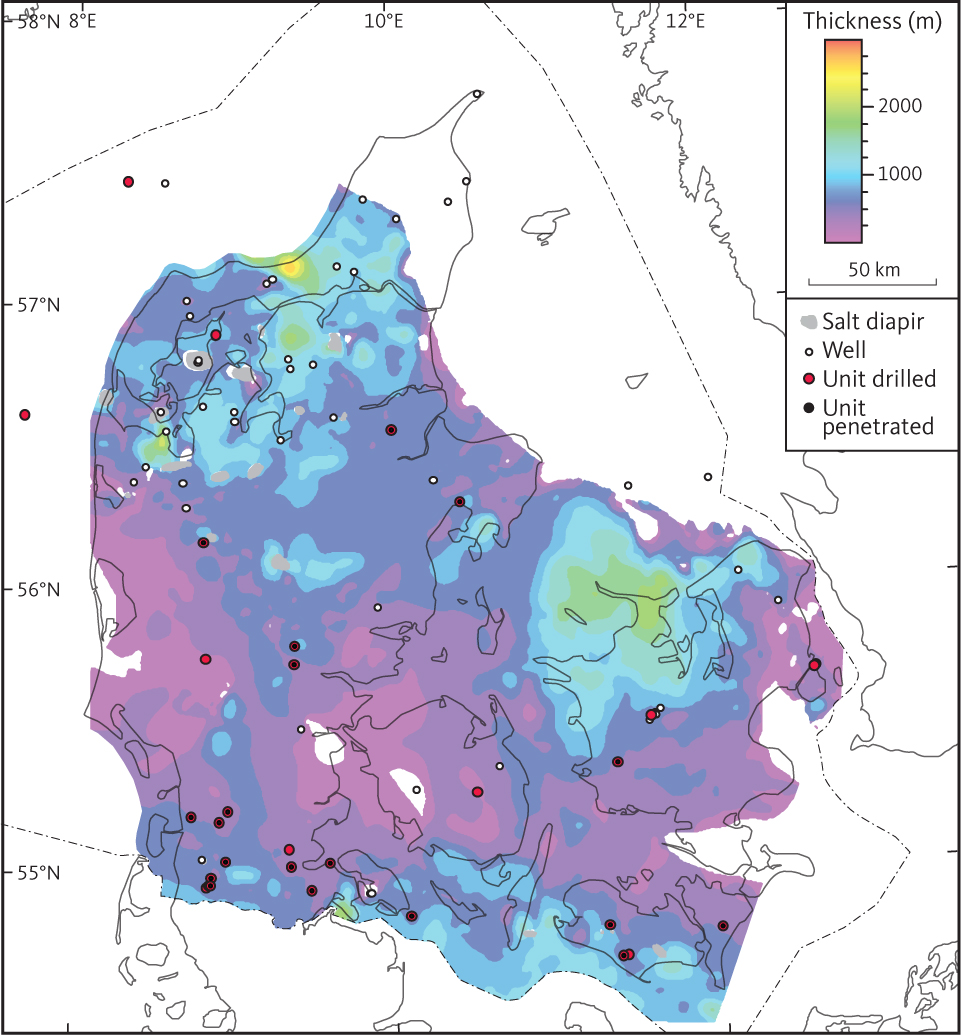
Fig. 59 Combined isochore of units F6 and F7 (Bacton Group).
3.6 Seismic unit G – Zechstein Group
3.6.1 Background and borehole data
Within the study area, seismic unit G is equivalent to the Zechstein Group, which is found in 12 deep wells in the North German Basin and in 15 deep wells in the Danish Basin (e.g. Clark & Tallbacka 1980; Stemmerik & Frykman 1989; Nielsen & Japsen 1991). In addition to the deep wells, a large number of shallow boreholes have been drilled into salt diapirs in the Danish Basin and these have demonstrated the presence of the Zechstein Group throughout most of the basin. In the deeper part of the basins, the Zechstein Group is dominated by evaporites (Clark & Tallbacka 1980). In the wells drilled into the Zechstein Group in the deeper part of the North German and Danish basins, five evaporation cycles (Z1–Z5) are recognised (Clark & Tallbacka 1980). These can be correlated between wells, but not all cycles are identified in all wells, and Z3 to Z5 are commonly grouped into one unit (Nielsen & Japsen 1991). Due to later salt mobilisation, thicknesses observed in boreholes are mostly unrepresentative of the true depositional thicknesses of the Zechstein Group. Thin mudstones form the basal part of individual evaporite cycles, and the group comprises sediments deposited in a restricted sea characterised by high evaporation (Clark & Tallbacka 1980; Peryt et al. 2010). The Zechstein Group is absent in wells drilled into pre-Zechstein units in the Øresund Basin, on the Skagerrak–Kattegat Platform and on the Ringkøbing–Fyn High. In the Hans-1 and Terne-1 wells, continental siliciclastic sandstones are identified, which are considered contemporaneous with the Zechstein Group and as representing a marginal facies at the northeastern basin margin (Michelsen & Nielsen 1993). In the wells drilled on the flanks of the Ringkøbing–Fyn High, the Zechstein Group is characterised by a succession of carbonates and anhydrites, representing a basin margin setting (Stemmerik & Frykman 1989). Presumably, the Zechstein Sea never extended across the Ringkøbing–Fyn High. However, continental deposits as those seen in Terne-1 may have been present prior to erosion of the high. The extent of the Zechstein deposits within the study area is indicated in Fig. 60 (which shows where these are mapped in the area). The north-western and southern extents of this sea are beyond the study area. The log patterns of the group are very distinct, characterised by marked log inflections associated with changing lithology of the evaporite sequence (Figs 41, 42, 47; e.g. Clark & Tallbacka 1980).
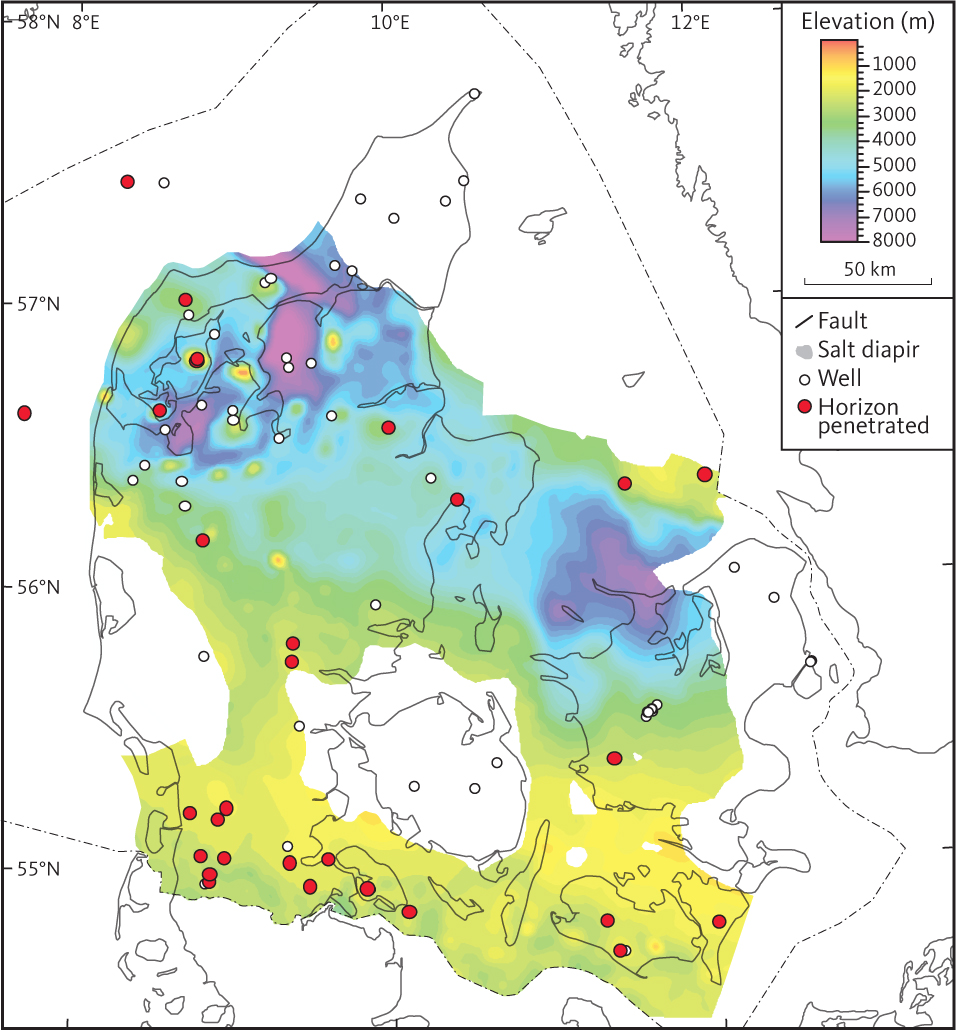
Fig. 60 Depth to the top of unit G (Zechstein Group).
3.6.2 Top of unit G
The top of unit G is interpreted throughout most of the study area (Fig. 60). In the North German Basin, the horizon is a diffuse low to moderate amplitude reflection found approximately 100 ms above a characteristic high amplitude reflection related to the uppermost carbonate beds in the Zechstein Group (Figs 41, 61; Maver 1995). In the Danish Basin, the top Zechstein seismic horizon is generally continuous and characterised by high amplitude reflections. The top of unit G reaches a depth of about 2500 m in the North German Basin and more than 4000 m in the Danish Basin, deepest in Fjerritslev Trough, Himmerland and Rødding grabens and in the Odsherred Basin (about 7000–9000 m). In both of the major basins, the top of unit G is locally found at shallower levels where associated with salt diapirs (Fig. 60). The depth to the top of most of the salt diapirs is constrained by borehole data rather than seismic interpretation.
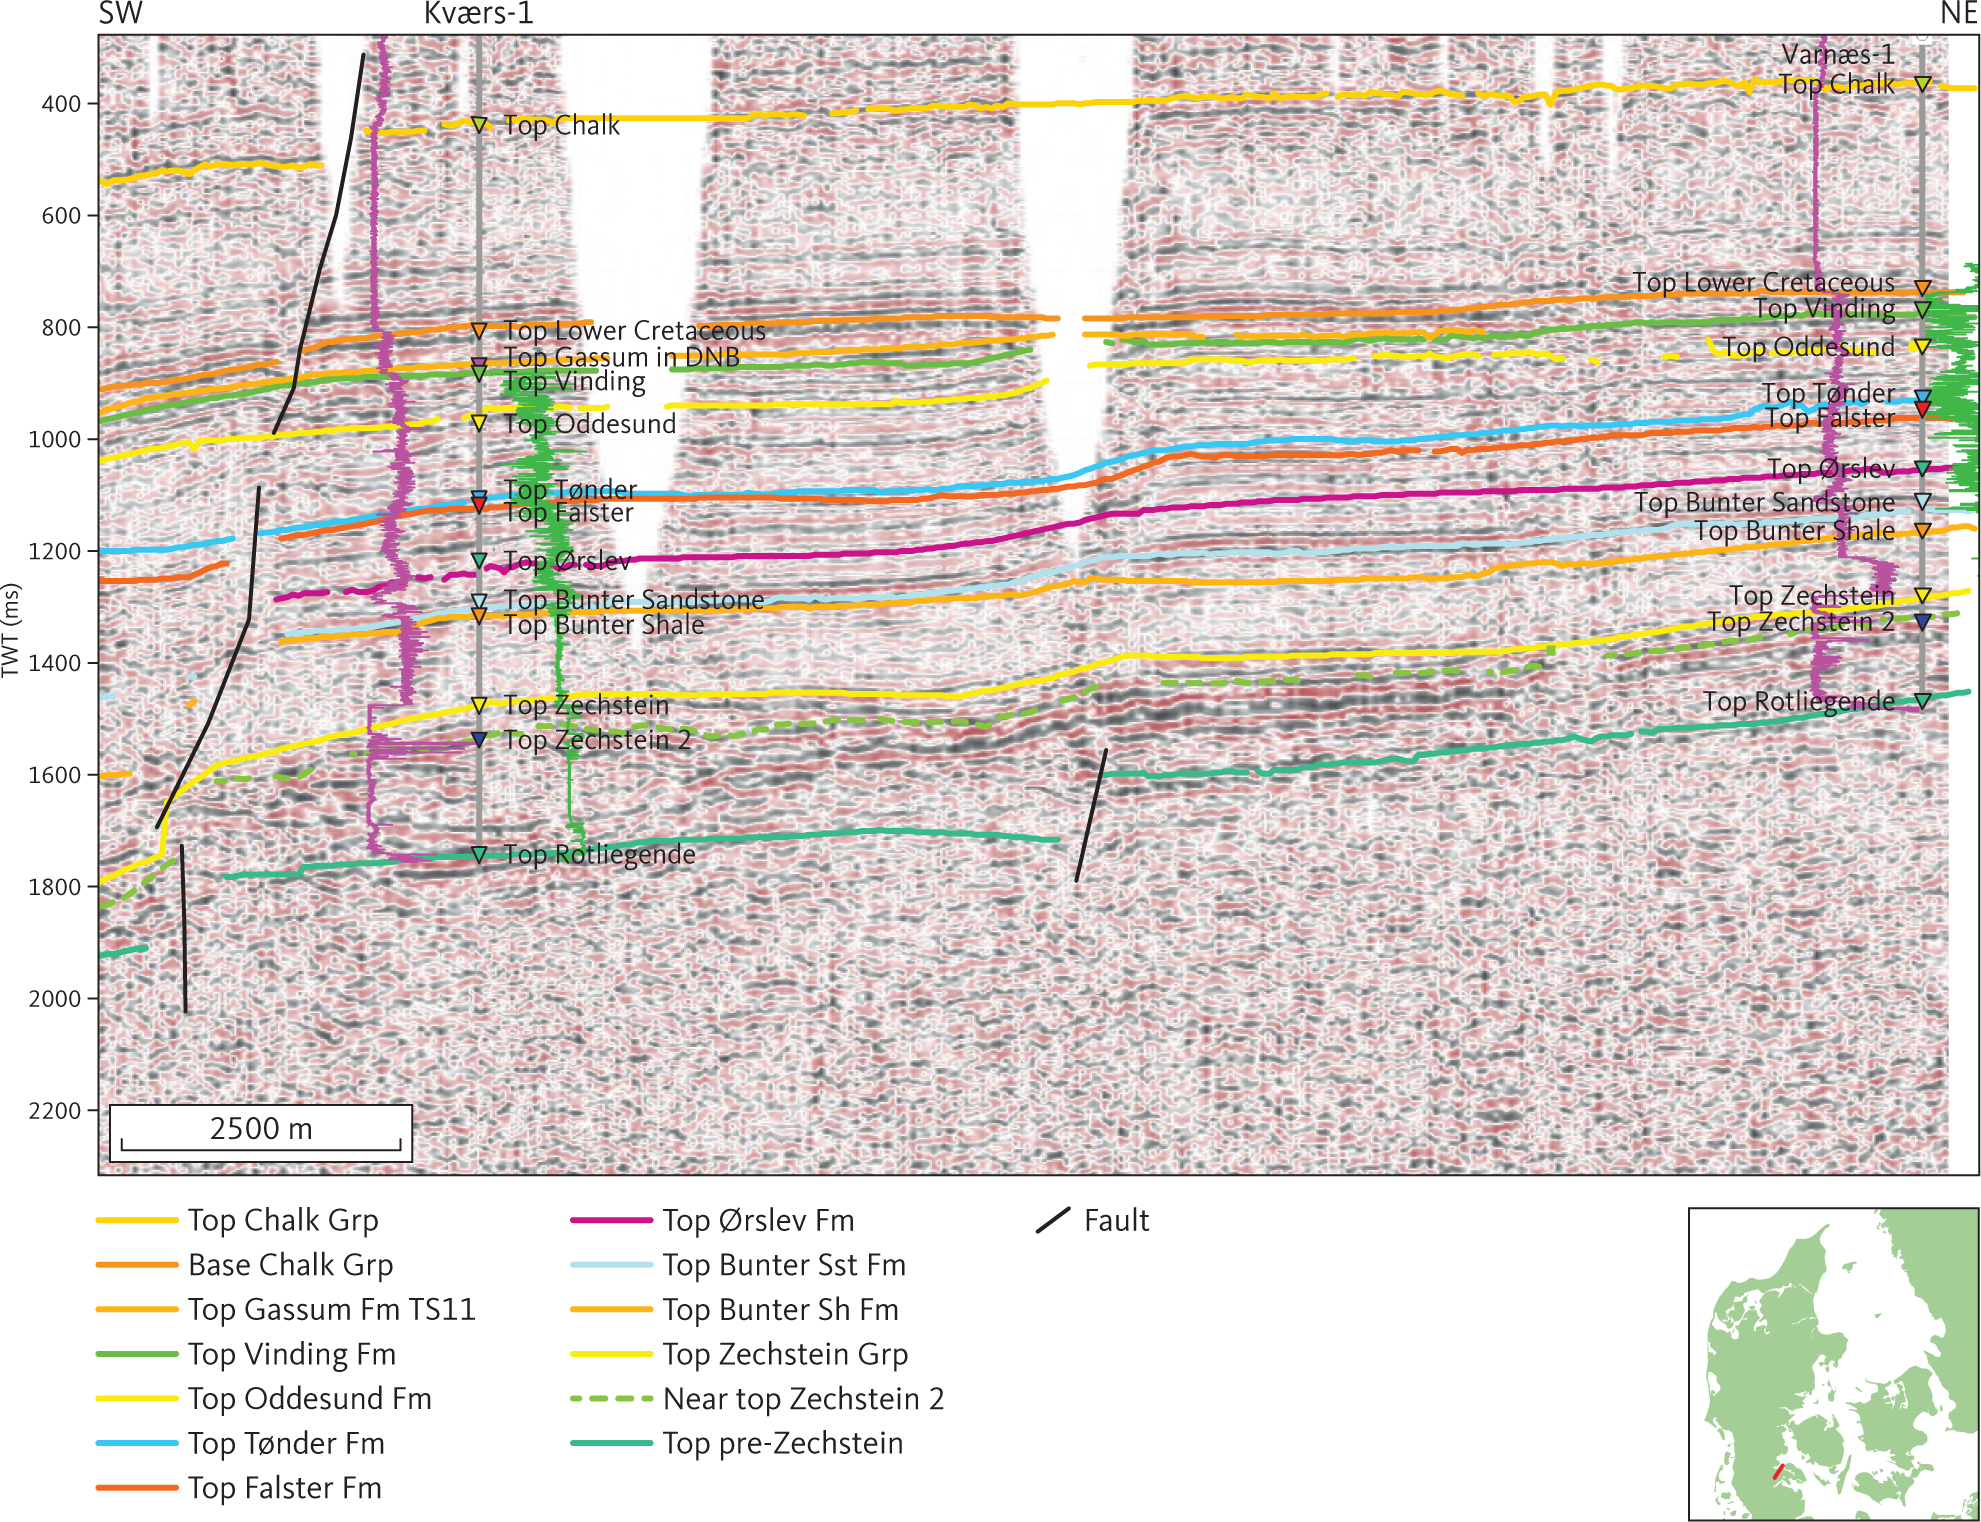
Fig. 61 Seismic section (7912) Kværs-1 and Varnæs-1. In both wells, a distinct increase of the gamma-ray log shown as a purple line is seen moving down from the Bunter Shale Formation into the Zechstein Group. The equivalent seismic horizon at the base of unit F is rather weak. Locally, it is picked as a ghost horizon parallel to the green stippled horizon of strong reflections associated with a carbonate bed internally in the Zechstein Group (see also Maver 1995). The gamma-ray and sonic logs are shown as purple and green lines, respectively, on either side of the Kværs-1 and Varnæs-1 well paths, with highest values closest to the well traces. DNB: Danish Norwegian Basin. Inserted map shows the location of the profile.
3.6.3 Seismic character of unit G
In deeper parts of both the North German Basin and the Danish Basin, unit G is characterised by high amplitude reflections and pronounced thickness variations associated with salt mobilisation (Fig. 62; e.g. Madirazza 1968, 1986). Where the unit is not mobilised or only to a limited degree, the unit is characterised mostly by moderate amplitude, parallel to sub-parallel reflections of moderate continuity (Figs 42, 44). In this setting, a few strong and distinct horizons of strong reflections are seen within the unit. In the lower part of salt pillows, these horizons become wavy or disrupted resembling boudinage structures (e.g. Jackson & Hudec 2017), an indication of internal deformation of the unit (Figs 41, 63). Where the top Zechstein horizon is drilled, these discontinuous reflections can be attributed to carbonate horizons within the evaporite succession (Fig. 61; e.g. Maver 1995). Unit G is absent on the Ringkøbing–Fyn and Møn highs, and internal reflections in the lower part of the unit onlap its lower boundary on both flanks of the highs. Unit G is recognised both in the Horn Graben and between the Ringkøbing–Fyn and Møn highs (Vejbæk & Britze 1994; Vejbæk 1997).
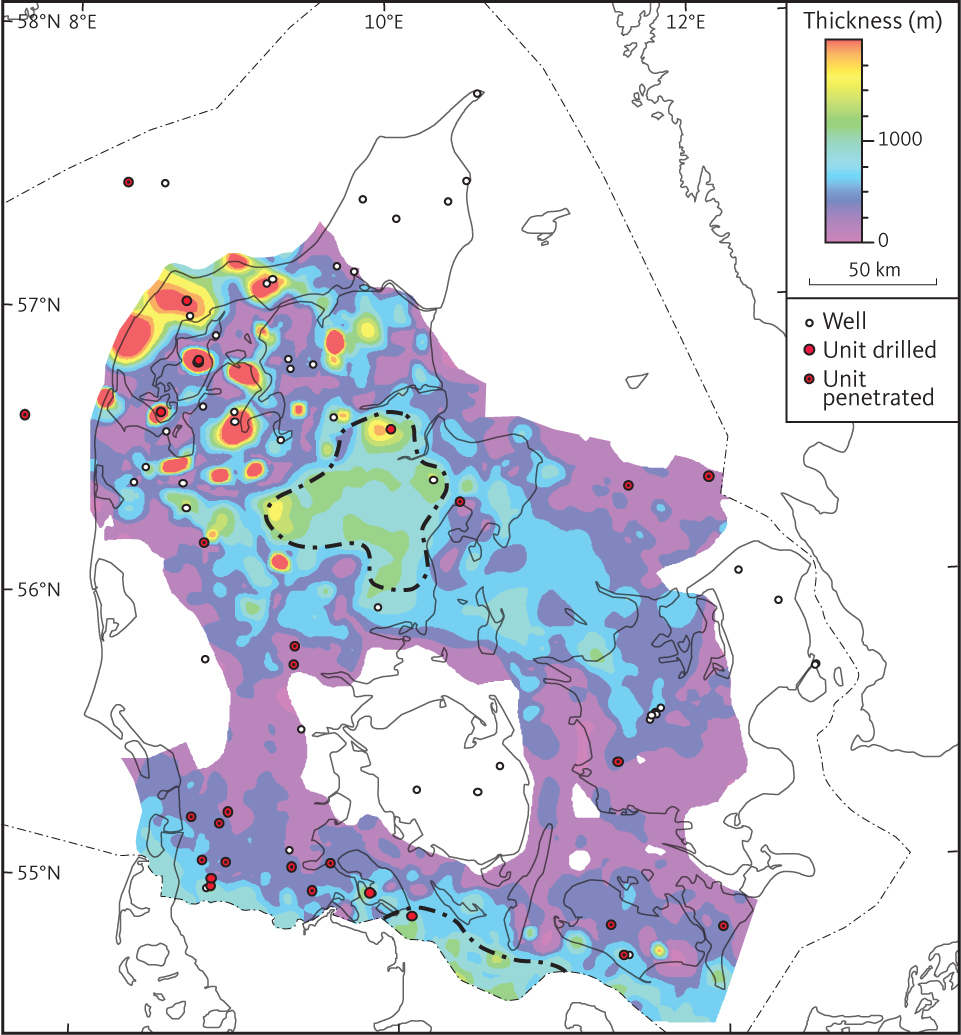
Fig. 62 Isochore of unit G (Zechstein Group). The area marked by a stippled black line in central Jylland is characterised by fairly constant thickness of the Zechstein Group and the absence of indications of salt mobilisations and may be representative of original thickness of the group.
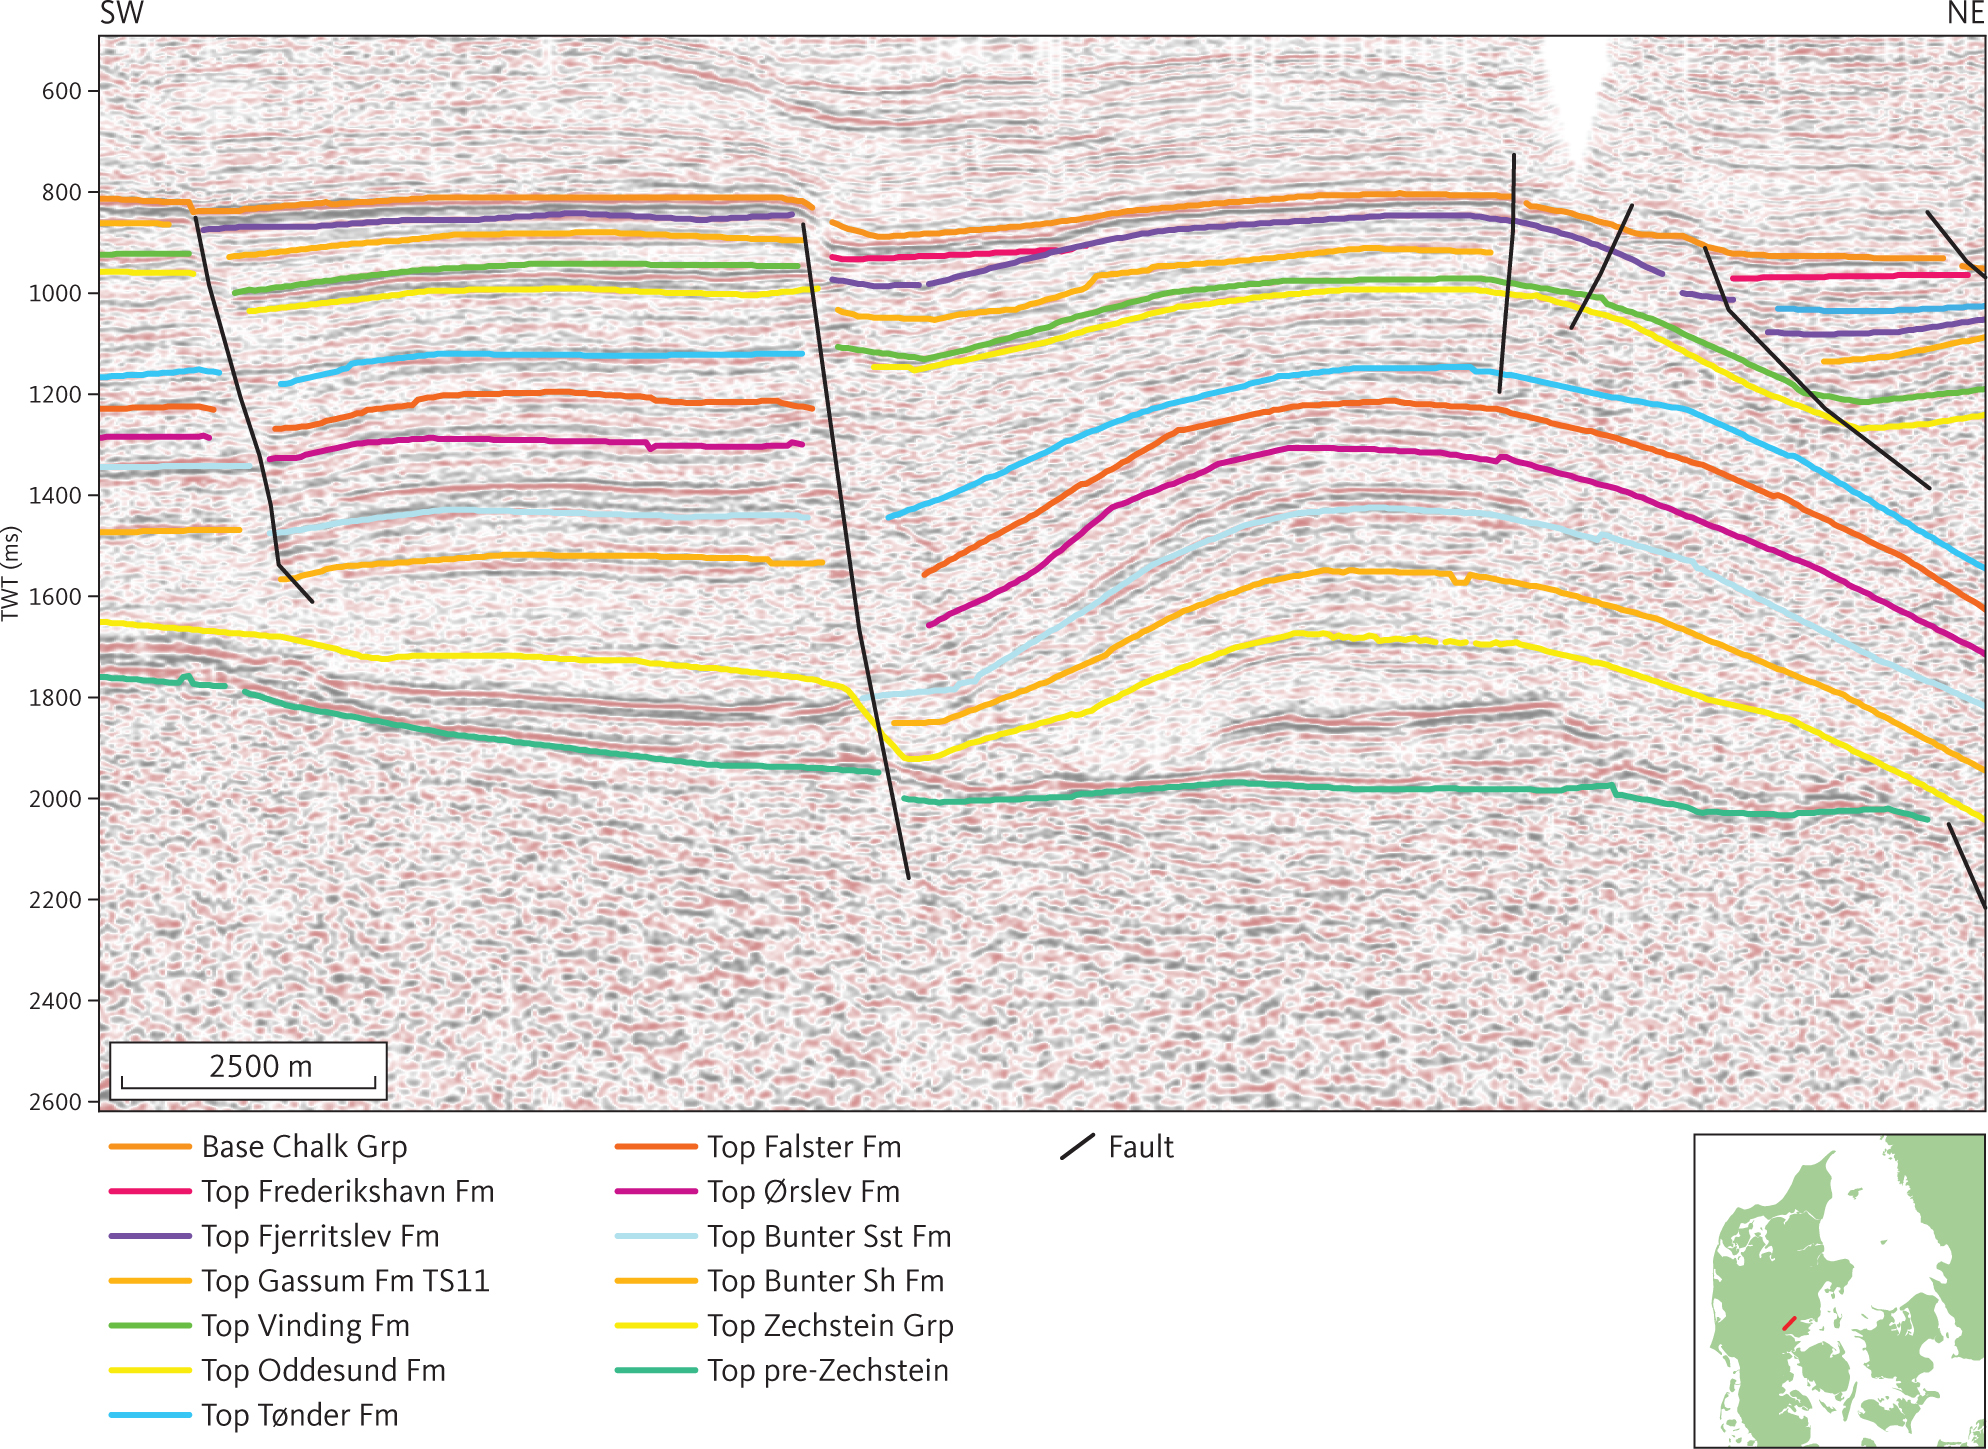
Fig. 63 Seismic section DNJ-16. Onlaps in Zechstein saltroller to the SW and salt pillow to the NE. Inserted map shows the location of the profile.
In salt diapirs, the reflection pattern is chaotic partly because of steep dips and complex deformation, affecting the seismic imaging. No seismic data suitable for imaging the internal and external geometry of salt diapirs in any detail have been acquired for the study area.
3.6.4 Base of unit G (top pre-Zechstein horizon)
The top pre-Zechstein horizon has been mapped in the entire study area (Fig. 64) and separates unit G and overlying seismic units from a basement comprised of igneous and metamorphic rocks and Palaeozoic sediments. It was originally mapped throughout Denmark by Vejbæk & Britze (1994). Where the pre-Zechstein is composed of sedimentary rocks, the top pre-Zechstein horizon is generally recognised as a distinct angular unconformity (e.g. Fig. 65). However, locally concordant reflectors are seen between the upper pre-Zechstein and the actual pre-Zechstein unconformity (e.g. Fig. 42).
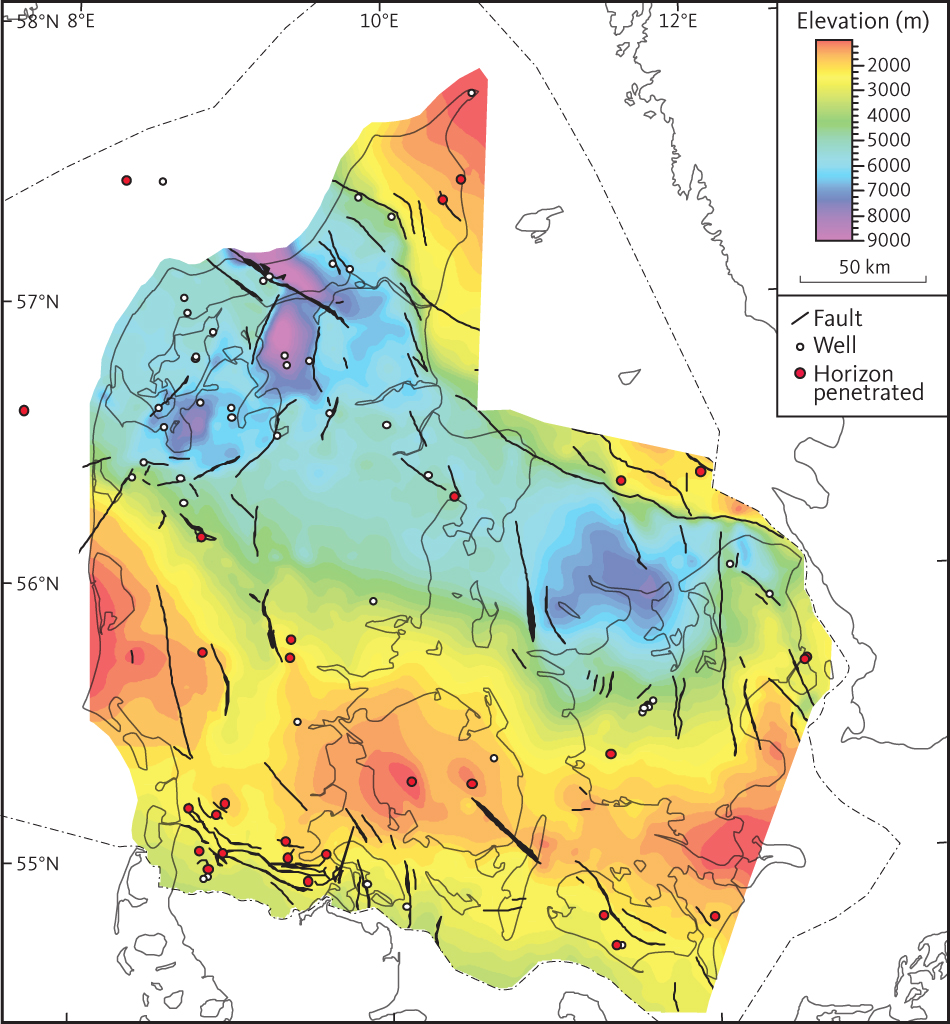
Fig. 64 Depth to the top pre-Zechstein horizon (base unit G and top unit H).
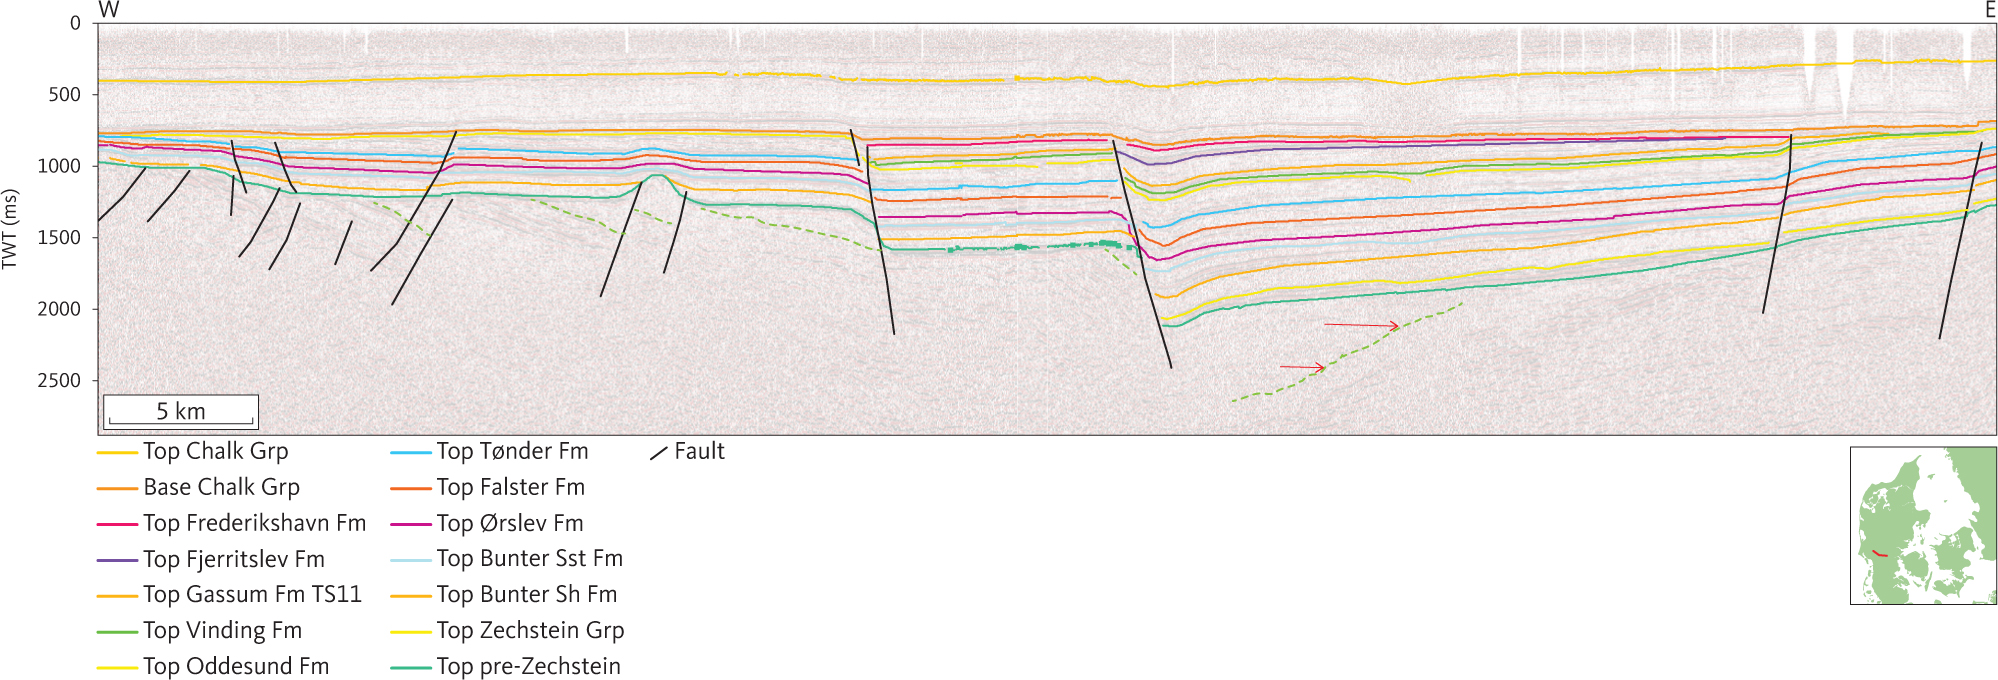
Fig. 65 Composite seismic section (DCJ-08, -09) across the Brande Trough. Activity along the N–S-trending faults bounding the Brande Trough is evidenced by thickness changes of Fjerritslev Formation, Oddesund Formation and Bacton Group across faults in the central part of the section. The stippled green horizon below top pre-Zechstein horizon is interpreted as the rift-onset unconformity related to the Late Carboniferous – Early Permian rift phase. A tilted sub-parallel bedded succession below the horizon is interpreted as a Lower Palaeozoic pre-rift succession. Red arrows below the Top pre-Zechstein horizon indicate onlap and truncation of a rifted sedimentary succession (presumably Lower Paleozoic–Carboniferous). Inserted map shows the location of the profile.
Throughout the study area, the top pre-Zechstein horizon is offset by faults. Between faults, the horizon is generally a continuous, fairly planar surface characterised mostly by continuous, moderate to high amplitude reflections. The faults offsetting the top pre-Zechstein horizon do not seem to have caused thickness variations of the Zechstein Group and were probably mainly active through distinct tectonic periods that can be correlated with regional Palaeozoic tectonic events (Fig. 5).
Within the study area, the base of unit G dips towards the south in the North German Basin, forming a N–S-trending depression that reaches a depth of about 3500 m in the northernmost part of the Glückstadt Graben. In the Danish Basin, the top pre-Zechstein seismic horizon is found down to depths of more than 5000 m. In the Fjerritslev Trough, Himmerland and Rødding grabens and an area north of Sjælland, the horizon is found to depths of about 7500–9500 m.
3.6.5 Isochore of unit G
The thickness of the Zechstein Group varies considerably, mostly as a result of later salt mobilisation that caused significant redistribution of the unit’s rocks. The median isochore of unit G is about 400 m. In an area in the southern part of the Danish Basin with little indication of salt mobilisation, the thickness of the Zechstein Group exceeds 800 m (Fig. 62), and in central Jylland, another similar area shows a thickness of 800 m. In addition to salt mobilisation, it is proposed that dissolution of halite of the Zechstein Group occurred during deposition of the Oddesund Formation (unit F3) and provided the salt found in the two halitic beds in the O2 member of the Oddesund Formation (Bertelsen 1980). The thickness of the originally deposited Zechstein Group in the deep parts of the Danish Basin may have been considerably greater than 800 m.
3.7 Seismic units below unit G
Within the study area, the basement of the pre-Zechstein horizon was reached in 26 wells (Fig. 64); metamorphic rocks from the Caledonian orogeny or older metamorphic rocks directly below the Zechstein Group or younger units were found in 13 of these wells; Middle–Lower Permian Rotliegend Group in 12 wells; and un-deformed Carboniferous or Lower Palaeozoic, either directly below the pre-Zechstein horizon or below the Rotliegend Group, were found in six wells. The Rotliegend Group, Carboniferous, and Lower Palaeozoic supracrustal rocks are present below large parts of both the Danish Basin and the North German Basin. Locally, distinct seismic horizons are recognised, which provide insight into the structural evolution of these rocks during deposition and after deposition. However, the continuity and resolution of the seismic signal from reflecting horizons within these units is generally rather poor, and none of the seismic horizons below the base of unit G have been mapped systematically as a part of this study.
3.7.1 Rotliegend Group
Within the study area, the Rotliegend Group comprises volcanic rocks, syn-rift deposits of epiclastic volcaniclastic rocks and fluvial-lacustrine deposits (e.g. Michelsen & Nielsen 1993). The regional Late Carboniferous – Early Permian rift phase observed throughout most of the Central European Basin System and in the Oslo Graben (e.g. Heeremans & Faleide 2004) is recognised in the study area in a zone parallel to the Sorgenfrei–Tornquist Zone and rifting was apparently most intense north of the Fjerritslev and Grenå–Hälsingborg Faults (e.g. Vejbæk & Britze 1994; Vejbæk 1997).
In the Hans-1 well and on seismic sections tying to the well, an unconformity is observed with Middle–Upper Rotliegend epiclastic volcanic sediments onlapping Lower Rotliegend effusive rocks tilted during the Late Carboniferous – Permian rifting (Fig. 66; Michelsen & Nielsen 1993). This syn- or late-rift unconformity is truncated by the top pre-Zechstein horizon. West of Rønde-1, an onlap-unconformity within the pre-Zechstein is observed (Fig. 42). It is truncated by an angular unconformity representing a hiatus between the Rotligend Group and the Silurian Nøvling Formation in Rønde-1.
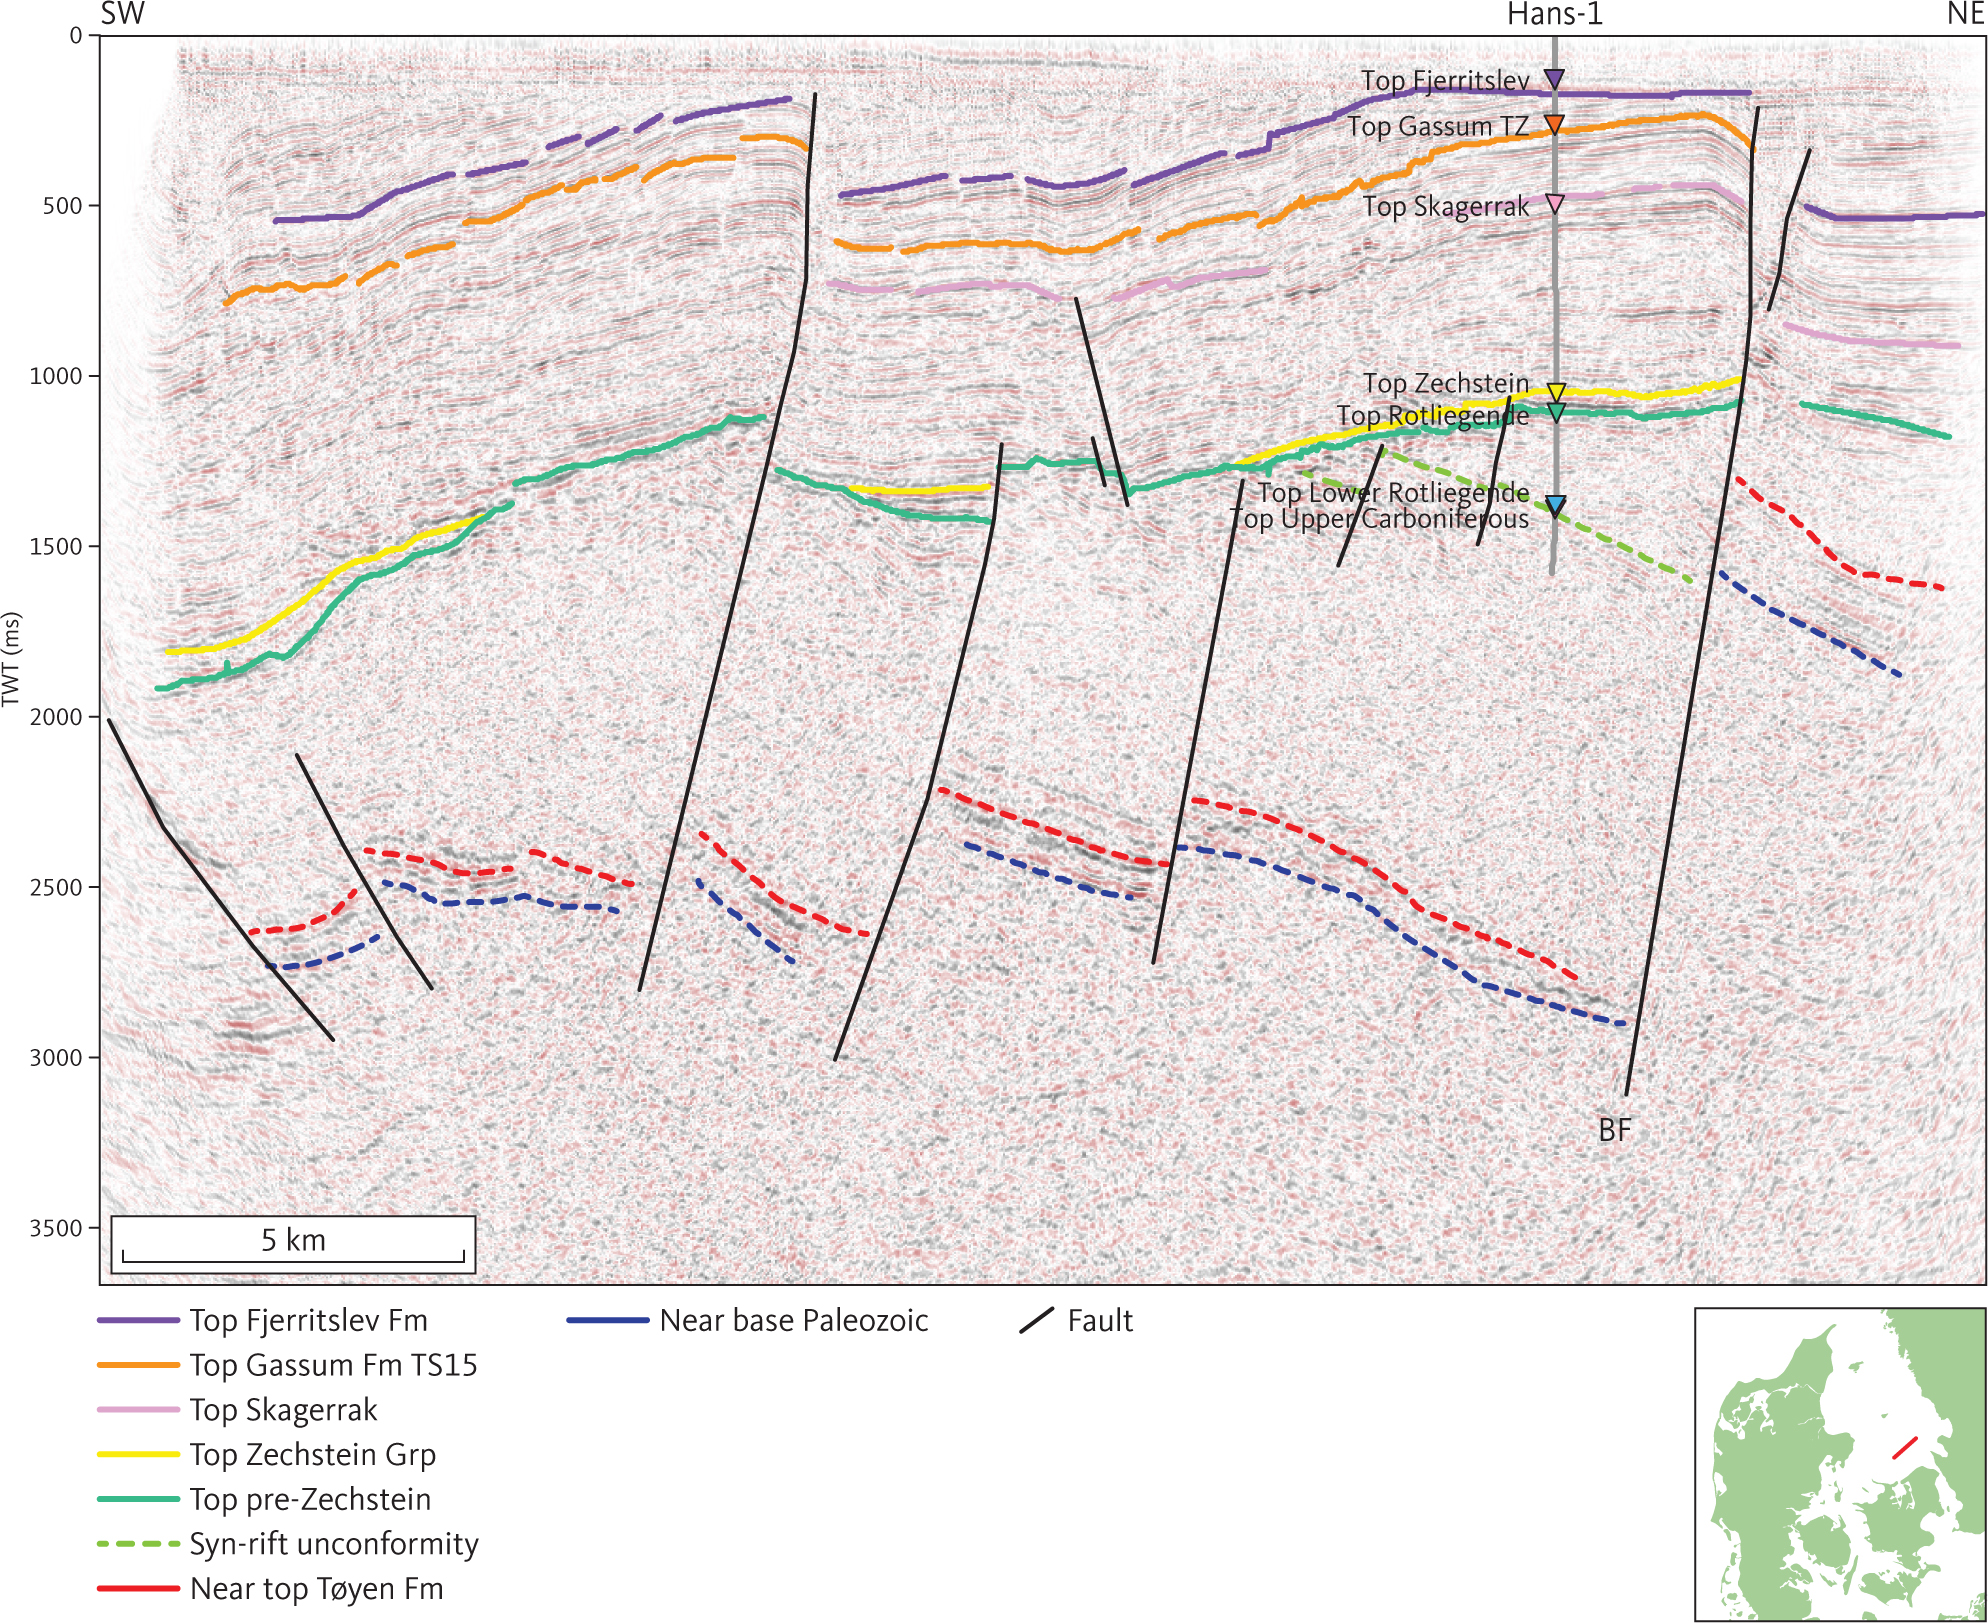
Fig. 66 Seismic section (K 83-005) at the Hans-1 well illustrating the character of the top pre-Zechstein horizon in Kattegat. A Late Carboniferous – Early Permian syn-rift unconformity preserved on the fault block closest to the Børglum Fault (BF) is shown as a green wavy line. It is penetrated in the Hans-1 well (Michelsen & Nielsen 1993). Stippled red horizon at c. 2500–3000 ms top Tøyen Fm of Schovsbo et al. (2016). The stippled blue horizon below approximates the base of the Paleozoic. Inserted map shows the location of the profile.
3.7.2 Carboniferous
Carboniferous rocks are documented in two wells within the study area. Upper Carboniferous fluvial-lacustrine sediments are recorded from the Hans-1 well (Michelsen & Nielsen 1991). They are conformable with the overlying Lower Rotliegend extrusives and with underlying Lower Palaeozoic units that are traced from the nearby Terne-1 but were not drilled in conjunction with Hans-1 (Figs 66, 67). A marine Lower Carboniferous carbonate succession is encountered directly below Upper Rotliegend redbeds in the Ørslev-1 well (Michelsen 1971), where it is truncated by a major unconformity. On the seismic sections, the hiatus is seen as an angular unconformity truncating a rifted succession below the Upper Rotliegend (Fig. 47).
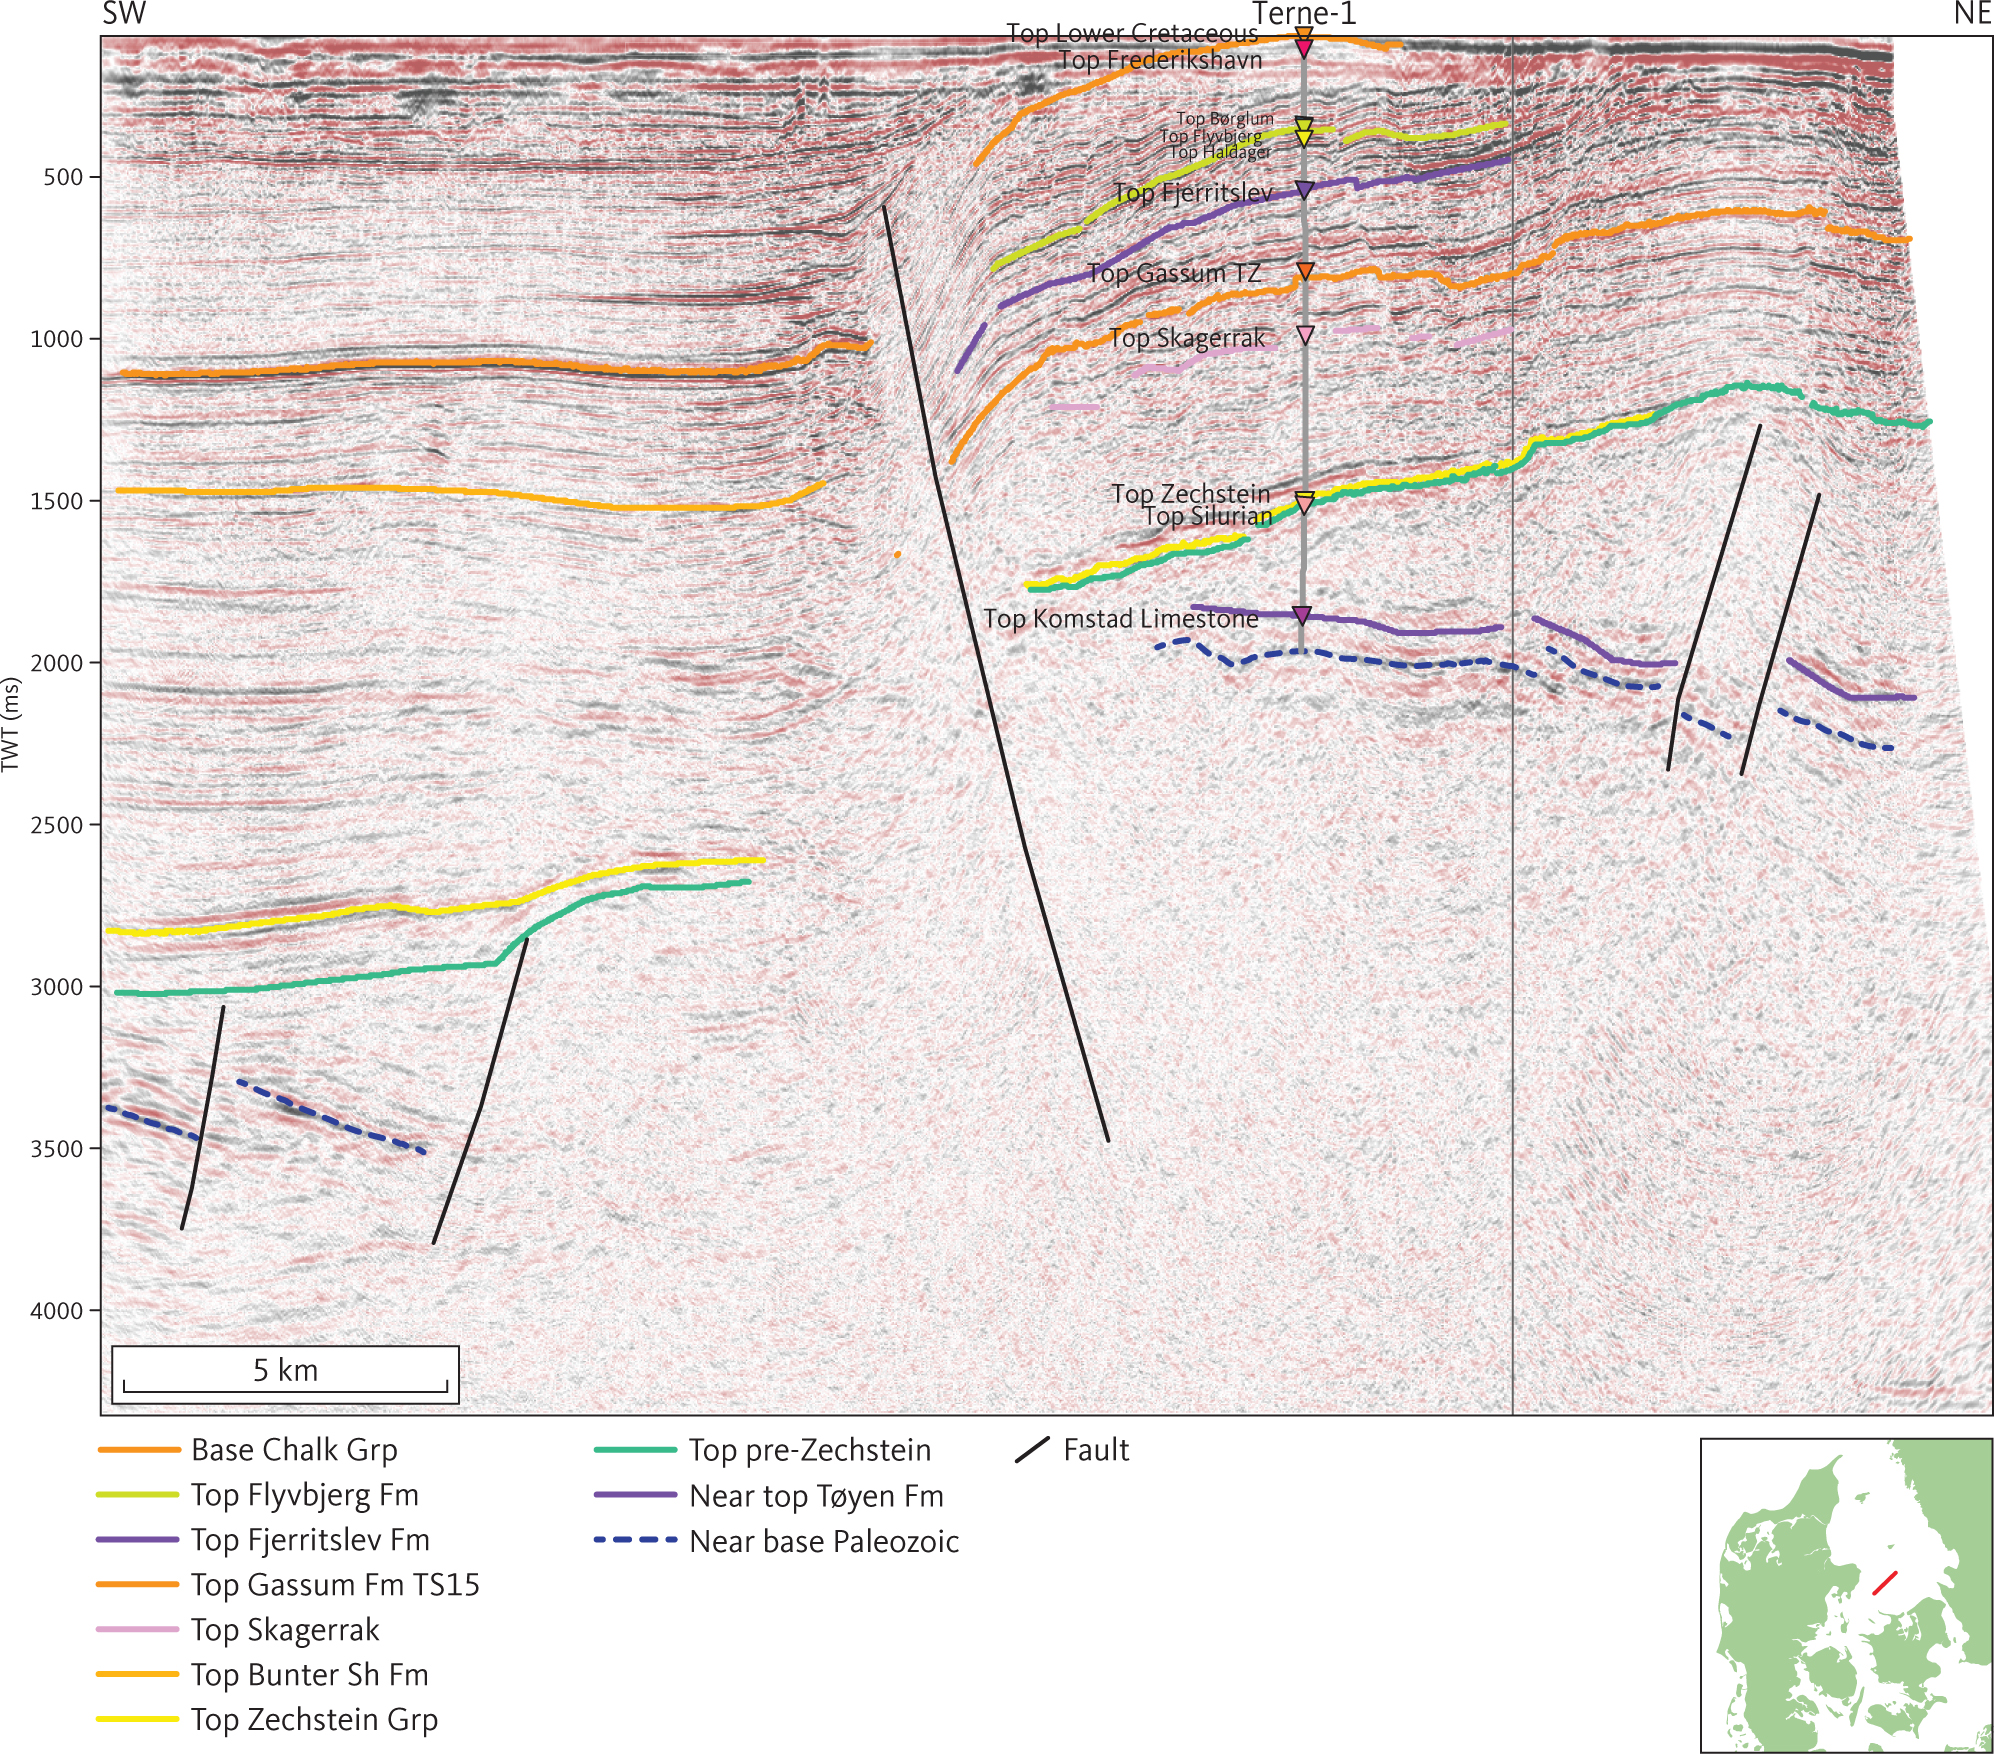
Fig. 67 Seismic section (ADK84-110) through the site of the Terne-1 well. Inserted map shows the location of the profile.
3.7.3 Devonian
Devonian sediments are not recorded in wells drilled within the study area, although drilling in wells on the structural highs encountered the Cambrian–Silurian (e.g. Terne-1). The seismic interpretation indicates that within the study area, the Early Carboniferous – Early Permian rift phase is the oldest tectonic phase offsetting the Cambrian–Silurian and Carboniferous successions (Figs 47, 66), and it might be possible that a Devonian succession is present in the area outside the structural highs.
3.7.4 Lower Palaeozoic
Undeformed Lower Palaeozoic rocks are found in four of the wells drilled in the Danish Basin. The maximum thickness encountered is 1062 m in the Terne-1, where the drilling stopped in a Cambrian sandstone (Nielsen & Japsen 1991). At this location, the Lower Palaeozoic comprises an upper succession of c. 600 m of Silurian shales overlying a c. 400 m thick succession of Cambrian – Middle Ordovician sedimentary rocks made up of shallow marine sandstones overlain in turn by shallow marine sandstones and black mudstones. The two successions are separated by the Middle Ordovician Tøyen Formation, which is contemporaneous with a widespread thin limestone succession, the Komstad Formation (Fig. 67; Schovsbo et al. 2016).
In the vicinity of Terne-1, the Lower Palaeozoic succession is characterised by parallel to sub-parallel, mostly diffuse reflections of various amplitude and continuity (Fig. 67). A distinct seismic horizon is seen in the lower part of the Lower Palaeozoic succession in southern Kattegat. It ties with the top of the Middle Ordovician Tøyen Formation in the Terne-1 well.
The Lower Palaeozoic succession was faulted and tilted during the Late Carboniferous – Early Permian and truncated by the pre-Zechstein horizon (Figs 66, 67). At Hans-1, the horizon tying to the Tøyen Formation is found c. 3000 m below the top pre-Zechstein horizon. It is thus apparent that a c. 2500 m thick succession of Lower Palaeozoic through Carboniferous sedimentary rocks was removed around Terne-1 during the Late Carboniferous – Early Permian rift phase.
4 Interpretation of the tectonic development of the Danish Basin and North German Basin
4.1 Layered digital elevation model (LDEM)
The seismic interpretation made in this study resulted in a layered digital elevation model (LDEM) representing most of the Danish Basin and the northern part of the North German Basin. The model is composed of depth grids with a cell size of 400 × 400 m at 16 stratigraphic levels. The lowermost grid represents the pre-Zechstein horizon (base of unit G; see Fig. 64), and the uppermost represents the top of the Chalk Group (top of unit B; Table 1). The stratigraphic subdivision of the LDEM is finest in the Triassic, especially the Lower–Middle Triassic (Fig. 5). The seismic horizons below the pre-Zechstein were not interpreted systematically, and no grids are constructed representing these seismic horizons. The LDEM is the basis for analysis of the sediment deposition in the study area.
The evolution of the studied parts of the Danish and North German basins can be subdivided into four stages, as seen below. Stages 1–2a are based on observations from seismic profiles and well reports combined with published literature and cover the section composed of the seismic units below unit G. Stages 2.b–4 are based on the seismic interpretation and correlation with the wells, combined with analyses using the layered digital elevation model; these stages are represented by Seismic units B–G.
| Stage 1: | Late Carboniferous wrenching, formation of the Skagerrak Centred Large Igneous Province plume, igneous activity and rifting. |
| Stage 2.a: | Early–Middle Permian subsidence of the dome by thermal contraction associated with erosion until the land–surface reach base level. This resulted in formation of the regional top pre-Zechstein horizon. |
| Stage 2.b: | Late Permian – Triassic main evolution of depositional basins by thermal contraction, some rifting and rapid sediment accumulation. |
| Stage 3: | Jurassic – Early Cretaceous minor rifting, oscillating sea level and reduced subsidence. |
| Stage 4: | Late Cretaceous biogenic sedimentation during major long-lasting eustatic sea-level high followed by Paleogene overall regression and Neogene tilting of the study area. In addition, Late Cretaceous compressional basin inversion occurred along the STZ. |
The three younger stages are distinct in plots of basin floor subsidence (e.g. Fig. 68), but thickness patterns are locally modified by salt tectonics.
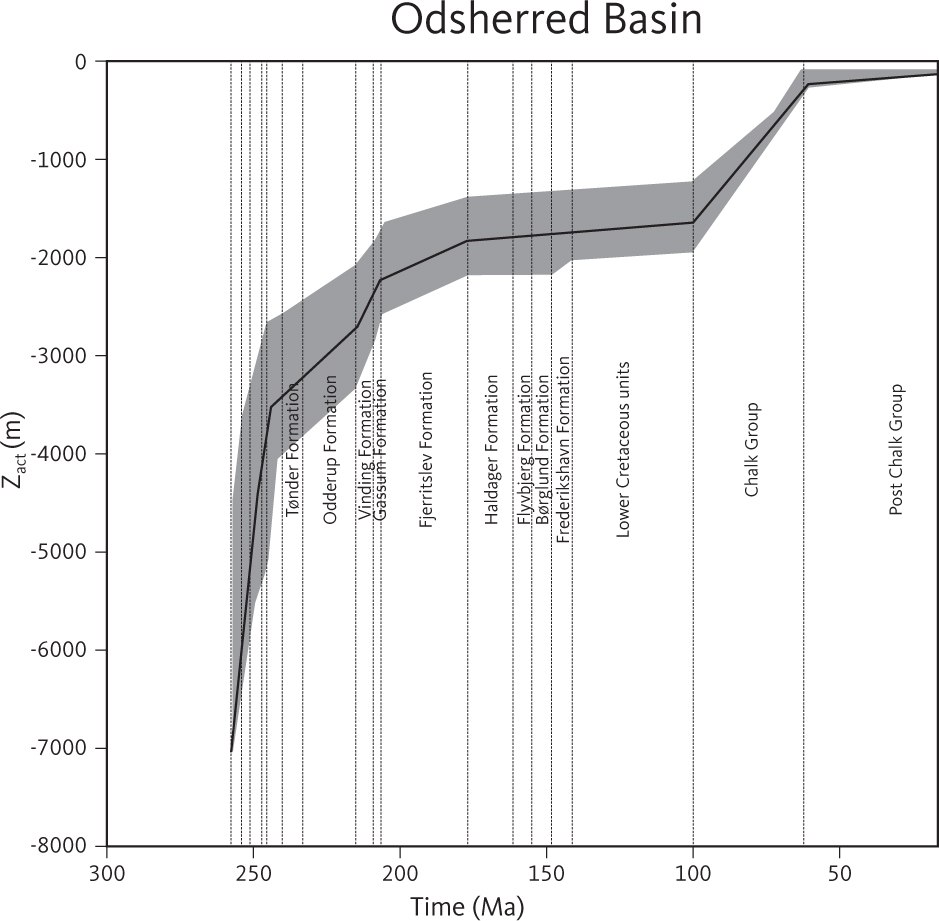
Fig. 68 Curves illustrating basin floor burial in the Odsherred Basin. The curves are calculated using the backstripping scheme proposed by (Sclater & Christie 1980). Zact is the thickness of the rock column above the basin floor, the top pre-Zechstein horizon. Neither sea-level changes nor erosion and over-compaction are taken into consideration in the calculations.
Devonian sediments are not recorded, and Michelsen & Nielsen (1991, 1993) speculated that a Devonian–Carboniferous hiatus extended across the study area.
4.2 Stage 1: Late Carboniferous – earliest Permian doming, igneous activity and rifting
In the vicinity of the Hans-1 and Terne-1 wells in the Sorgenfrei–Tornquist Zone, the top pre-Zechstein horizon is an angular unconformity at the base of the Upper Permian, and continental and marginal clastics are reported that are equivalent to the Zechstein Group (Michelsen & Nielsen 1993). The unconformity truncates a faulted succession (Fig. 66), including a thick foreland succession of Upper Silurian shales overlain by Upper Carboniferous fluvial-lacustrine sediments, volcanic rocks and an Upper Carboniferous – Lower Permian succession of syn-rift sediments. The syn-rift succession, penetrated by the Hans-1 well, comprises coarse clastic continental sediments of the Rotliegend Group with abundant volcanic fragments (Michelsen & Nielsen 1991, 1993). The Late Carboniferous – Early Permian rift phase is recognised throughout the Central European Basin System (e.g. Ziegler 1988; Pharaoh et al. 2010).
It has not been possible to determine precisely the age of the volcanic rocks below the syn-rift succession in the Hans-1 well and a similar succession penetrated by the Sæby-1 well. However, the relative stratigraphic position in the well and the presence of epiclastic volcanic sediments in the syn-rift succession in Hans-1 indicates that the volcanics are part of the Late Carboniferous – Early Permian igneous province. This province extends across the Danish Basin, including Scania and the Oslo Graben to the north (Fig. 5; e.g. Michelsen & Nielsen 1993; Heeremans & Faleide 2004). Contemporaneous igneous rocks are found throughout most of the Central European Basin System (e.g. Heeremans & Faleide 2004). Peak igneous activity occurred during the latest Carboniferous and earliest Permian (e.g. Klingspor 1976; Neumann et al. 2004; Timmerman et al. 2009). Torsvik et al. (2008) classified the Late Carboniferous – Early Permian (c. 300–290 Ma) igneous activity in and around the Central European Basin System as the Skagerrak Centred Large Igneous Province (SCLIP).
In the south-eastern part of the study area around the Ørslev-1 well, an angular unconformity is observed between Lower Carboniferous (Visean) marine carbonates and Upper Rotliegend redbeds (Fig. 47). The available data may suggest that tilting of the Lower Carboniferous succession in the vicinity of Ørslev-1 was caused by rifting contemporaneous with Early Carboniferous rift structures observed south of the Mid North Sea High (e.g. van Hulten & Poty 2007; Kombrink et al. 2010). The Late Carboniferous – Early Permian rift phase is the first event which significantly offsets the Upper Palaeozoic succession below the Danish Basin (e.g. Fig. 66; see also Vejbæk 1990). Therefore, any Early Carboniferous rifting within the study area must be restricted to the area south of the Ringkøbing–Fyn High. It is thus concluded that the uplift and erosion shown by the pre-Zechstein horizon was initiated more or less contemporaneously with emplacement of the SCLIP (Torsvik et al. 2008).
4.3 Stage 2a: Formation of the top pre-Zechstein horizon
The top pre-Zechstein horizon in the Danish Basin and the remaining part of the Central European Basin System is the result of regional erosion during the Cisuralian and Guadalupian in the Early Permian (e.g. Vejbæk & Britze 1994; Vejbæk 1997). Some of the erosional products resulting from the formation of the top pre-Zechstein horizon were deposited in local fault-bounded basins as demonstrated by the successions penetrated by Hans-1 and Sæby-1 in the Danish Basin (Michelsen & Nielsen 1991, 1993) and the Müritz Subgroup in the North German Basin (Gast et al. 2010).
Modelling of vitrinite reflectance data indicates that in the Rønne Graben and the Kattegat segment of the Sorgenfrei–Tornquist Zone, this erosional event removed about 3300 m and 5000 m, respectively, of Lower Palaeozoic and younger sediments (Jensen & Nielsen 1995; Schovsbo & Nielsen 2015).
It has been proposed that an increase in heat flow occurring during the Caledonian collision and lasting throughout the Devonian and Carboniferous caused the high vitrinite reflectance observed in the Lower Palaeozoic sedimentary rocks from the study area and its vicinity. According to this model, a transient heat was caused by thickening of the crust by about 18 km during the orogenic phase (Schovsbo & Nielsen 2015). Jensen & Nielsen (1995) proposed that maximum burial in the Rønne Graben occurred during the Late Carboniferous. This is in line with the suggestion that the pre-Zechstein horizon formed as a result of Cisuralian and Guadalupian erosion of the Late Carboniferous dome.
4.4 Stage 2b: Permian–Triassic subsidence of the lithosphere and sedimentary loading
Late Permian (Lopingian) sediments, including the evaporitic Zechstein Group, were deposited in the Danish Basin and other basins of the Central European Basin System. It has been proposed that the North German Basin subsided below sea-level prior to marine flooding with the basin floor being as deep as 300 m below sea level in the central part of the basins when the Kupferschiefer was deposited at the base of the Zechstein Group (e.g. van Wees et al. 2000).
The Zechstein Group accumulated rapidly (up to 1000 m in c. 3.5 Ma; e.g. Peryt et al. 2010). However, the low content of clastics in the Zechstein Group indicates that efficient transport of sediments from sediment source areas was not established during the Lopingian. Either potential sediment source areas surrounding the Central European Basin System were not exposed to erosion, a barrier prevented effective transport of sediment into the basin system or the potential source areas were characterised by low relief and a dry climate.
Near the end of the Lopingian, the depositional surface of the basins emerged above sea level, and a succession of continental clastics, the Bacton Group and equivalents, accumulated above the Zechstein Group. In the Danish Basin, the clastics were derived primarily from the north and north-east (e.g. Olivarius & Nielsen 2016; Olivarius et al. 2017, 2022). This indicates that either the sediment source areas in Scandinavia were exposed to erosion in the Early Triassic, or that any barrier to effective sediment transport from Scandinavia into the Danish Basin was removed/breached, or formation of high-lying source areas and a more humid climate allowed formation of river systems near the Permian–Triassic boundary. Deposition of continental clastics in the basin continued throughout the Triassic, and during this period the evolving basin was generally filled (Bertelsen 1980; Nielsen 2003).
Curves of basin-floor burial in the Danish Basin illustrate that sediment accumulation in the basin decreased during the Triassic (Fig. 69). This reflects that thermal contraction of the basin decreased over time. Diminished input of clastic sediments from the source areas to the north and north-east may also have contributed to the reduced sediment accumulation at the end of the Triassic. It is unfortunately difficult to estimate the cooling history of the lithosphere below the Danish Basin from curves of basin-floor burial due to Triassic rifting, variable degrees of basin filling and salt mobilisation.
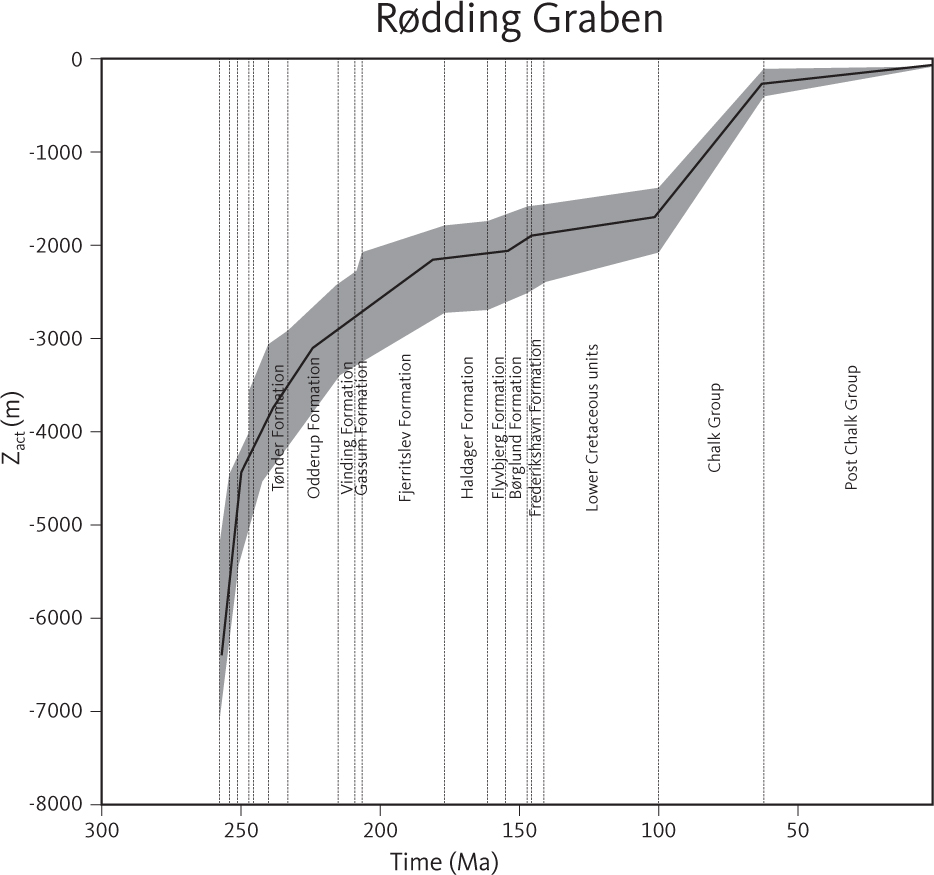
Fig. 69 Sediment accumulation history in the Rødding Graben based on seismic profiles at selected sites within the study area.
Minor rifting occurred along mostly N–S-trending faults during deposition of the Bacton Group (Figs 57, 65). This initiated or re-activated sub-basins within the Danish Basin, (the Himmerland and Rødding grabens, the Odsherred Basin and the Brande Trough; Figs 55, 56). Depositional rates remained high throughout the Induan–Olenekian (on average more than 50 m/Myr in basinal settings; up to around 100 m/Myr in the sub-basins mentioned above); and the depositional area expanded both into the Øresund Basin and onto the Ringkøbing–Fyn High (Fig. 59).
The temporal equivalents of the Röt and Muschelkalk Formations (Ørslev and Falster Formations) in the Danish Basin are thickest in the Himmerland and Rødding grabens reaching up to about 800 m (Figs 52, 56) reflecting enhanced thermal subsidence of these basins in the wake of the Olenekian tectonic event. However, flow of Zechstein salt away from the central part of the basins may have contributed significantly to the development of accommodation space in the central part of these sub-basins during the Anisian – early Landinian.
Contemporaneous with the uplift of the Ringkøbing–Fyn High and deposition of the Oddesund Formation, faults that bound approximately N–S-trending sub-basins of the Danish Basin, such as the Brande Trough, the Rødding and Himmerland grabens, were re-activated (Fig. 46; e.g. Madirazza et al. 1990; Vejbæk 1990). This rift phase, frequently referred to as the Early Cimmerian rift phase, is recognised throughout the northern and central Europe (e.g. Ziegler 1988; Bachmann et al. 2010). Within the study area, it triggered mobilisation of the Zechstein salt, causing salt to move from the basin centres toward the margins. This generated additional space for the Oddesund Formation to be accommodated, which reaches a maximum thickness of around 2500–3000 m in the central part of the Rødding and Himmerland grabens (Figs 20, 46, 49). Madirazza et al. (1990) proposed that Carnian rifting in the Rødding Graben occurred in response to a dextral wrench system including the Fjerritslev and Grenå Hälsinborg faults, a mechanism proposed for pull-apart basins such as the Ålborg and Rønne grabens (Liboriussen et al. 1987). The proposed wrench component in the stress system affecting the study area during the Ladinian–Carnian could account for synchronous rifting in the N–S-trending basins mentioned above as well as uplift of the Ringkøbing–Fyn High.
4.5 Stages 3 and 4: Jurassic – Early Cretaceous minor rifting, oscillating sea level and slow sediment accumulation
During Jurassic and Early Cretaceous times, basin subsidence was generally slow (Fig. 69), and the position of the coastline shifted within the study area. Overall, however, marine muds were deposited in the central parts of the Danish Basin while marginal marine and fluvial sands were deposited in the Sorgenfrei–Tornquist Zone and over the Skagerrak–Kattegat Platform (Larsen 1966; Michelsen 1978; Nielsen 2003).
Early Jurassic rifting within the study area is indicated by thickening of the Fjerritslev Formation in the Sorgenfrei–Tornquist Zone (Fig. 31; Mogensen & Korstgård 2003) and by faults bordering the Fjerritslev Formation in the Brande Trough and Glückstadt Graben. A number of narrow troughs characterised by basal onlap of their fill onto sequence boundary SB15 of Nielsen (2003) were formed by salt withdrawal at the end of the Pliensbachian (e.g. Figs 20, 29, 48). It appears that salt mobilisation in the Early Jurassic was triggered by the onset of rifting or faulting (Fig. 70), and that the SB15 unconformity should be considered a rift-onset/syn-rift unconformity.
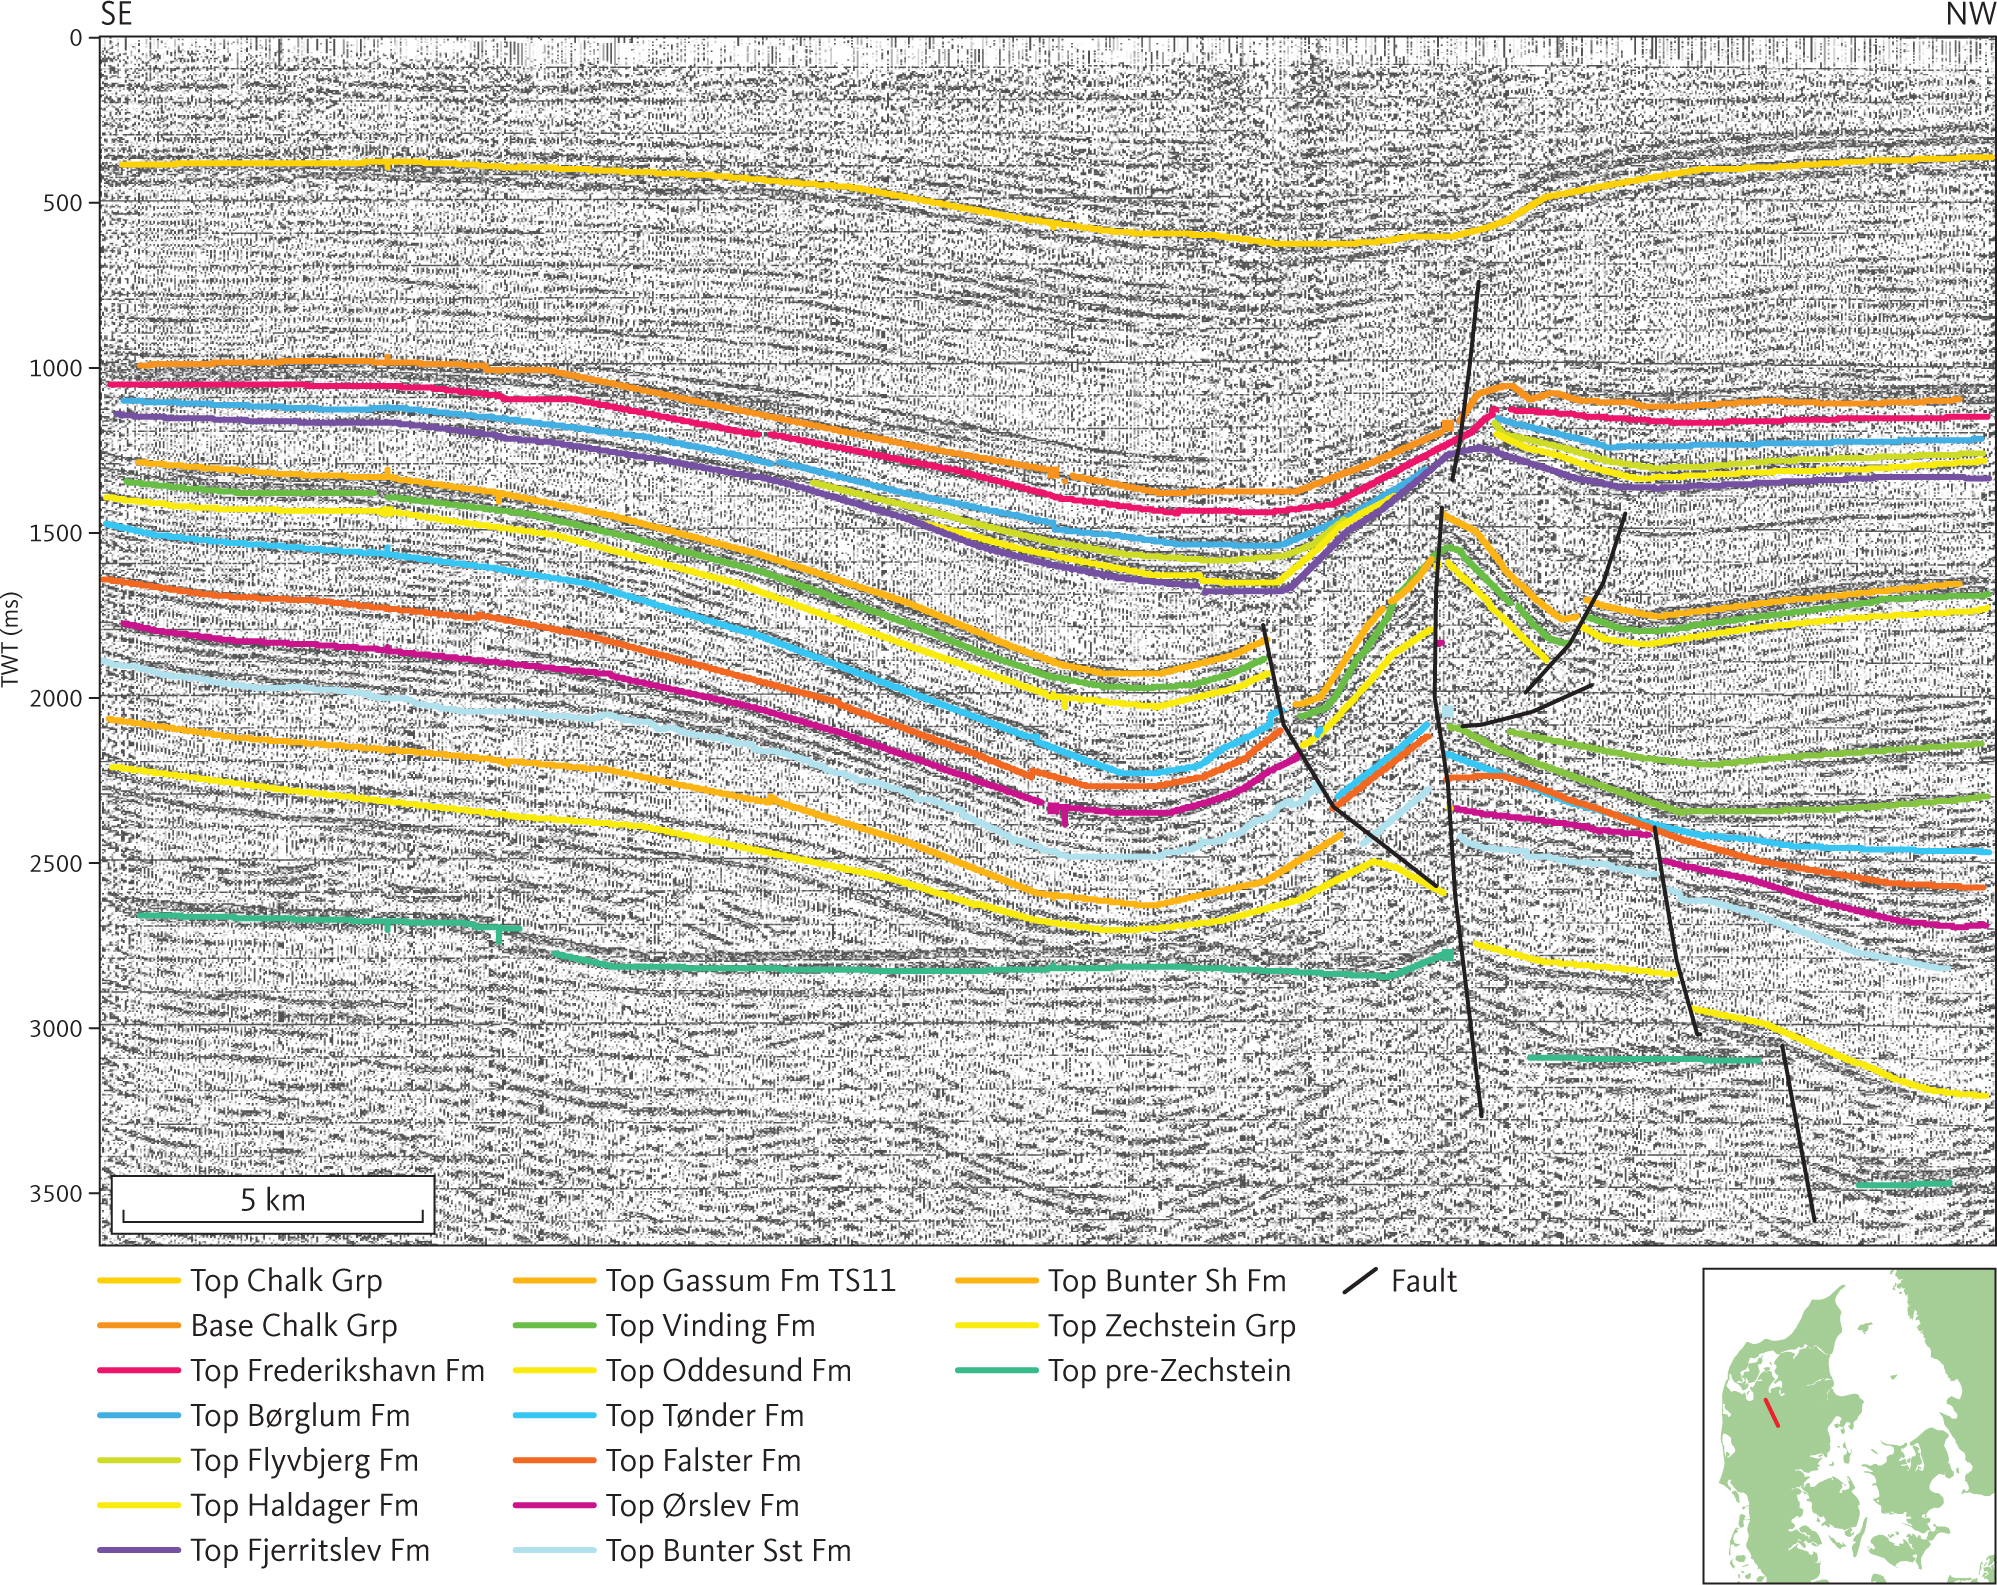
Fig. 70 Seismic section (PHDD009) illustrating salt mobilisation in the southern part of the Danish Basin.
Transtensional deformation presumably affected the Sorgenfrei–Tornquist Zone. This was likely caused by a regional extensional stress system that controlled Early Jurassic rifting in the Central and Viking grabens (Mogensen 1994; Mogensen & Korstgård 2003). A distinct rift-onset unconformity formed near the end of the Pliensbachian, and it is interesting that SB15 is situated close to the Pliensbachian–Toarcian transition and that it seems to correspond to a change in deposition in Scania and Bornholm that might reflect this suggested rift event.
The angular unconformity at the base of the Middle Jurassic Haldager Sand Formation (Figs 25, 29) is interpreted as the post-rift unconformity in relation to the rifting initiated in the Pliensbachian. It is correlated with the Lower Aalenian sequence boundary SB19 of Nielsen (2003) and to a distinct change in lithology from mudstones of the Fjerritslev Formation below to sandstones of the Haldager Sand Formation above (Nielsen 2003). Overall, relative sea-level changes were the most important factor controlling the depositional environments and the location of the shoreline during this stage (Nielsen 2003).
The depositional area gradually expanded beyond the Sorgenfrei–Tornquist Zone during the late Callovian – Oxfordian (Nielsen 2003) and accelerated during the Late Jurassic rifting that started in the Kimmeridgian, as indicated by the onlap unconformity at the base of the Frederikshavn Formation (Fig. 18). The corresponding post-rift unconformity is a major angular unconformity at the base of the Cretaceous Vedsted Formation (Figs 14, 30). On the Ringkøbing–Fyn High, this unconformity is itself truncated by the Late Cimmerian unconformity (Figs 30, 31). Therefore, most of the erosion that occurred prior to deposition of Cretaceous strata on the Ringkøbing–Fyn High and in the northern part of North German Basin presumably occurred as a consequence of the Late Cimmerian tectonic phase rather than the Middle Cimmerian tectonic phase (e.g. Ziegler 1988; Nielsen 2003).
Distribution of the Fjerritslev Formation within the transgressed area was controlled by intense salt mobilisation, which resulted in formation of a deep trough, the Fjerritslev Trough, within the Skagerrak–Vendsyssel segment of the Sorgenfrei–Tornquist Zone, and an irregular system of linked rim-synclines south of the Sorgenfrei–Tornquist Zone (e.g. Michelsen 1971; Thomsen et al. 1987; Vejbæk 1990; Christensen & Korstgård 1994).
In Turonian–Campanian time, reorganisation of regional stress caused dextral movements and formation of large inversion structures in the Sorgenfrei–Tornquist Zone and depression of the Danish Basin south of the Sorgenfrei–Tornquist Zone, as seen in the thickness map for the Chalk Group that documents a significant change in depocentre location compared to the Early Cretaceous.
5 Conclusions
The systematic interpretation of 2D reflection seismic data within the study area allows construction of regional depth and isochore maps of 16 units for the first time. The maps are tied to well data mostly through tops compiled by Nielsen & Japsen (1991). The depth and isochore maps are built into a layered digital model (LDEM) of the subsurface of the Danish onshore area. In addition, eight cross-sections are presented that are based on interpretation of the seismic profiles and illustrate the geological development across the study area. The interpretations presented here provide an improved mapping and description of the distribution and setting of the stratigraphic units in the investigated area, facilitating an analysis of the tectonic evolution of the Danish Basin and the northern part of the North German Basin during the Permian–Cretaceous.
The lowermost horizon in the model is the top pre-Zechstein horizon, which is a major regional unconformity overlain by the Lopingian Zechstein Group and younger sediments. Several younger regional unconformities are represented in the model (Fig. 5). These are correlated with major unconformities outlining depositional periods identified in the North German Basin (Bachmann et al., 2008). The uppermost horizon in the model is the top Cretaceous horizon. Deposition attributed to the rifting events is distributed unevenly among the different sub-basins of the Danish Basin. This complex tectonic-stratigraphic evolution is illustrated by the maps generated from data extracted from the LDEM and key seismic profiles.
Four separate tectonic stages are recognised, and the three younger stages are quite distinct in plots of basin-floor subsidence (Figs 68, 69).
Stage 1: The first major tectonic event within the Danish Basin occurred in the Late Carboniferous – Early Permian (c. 300 Ma). Regional wrenching and bulk replacement of the dense upper mantle by a less dense mantle plume triggered this event, which facilitated emplacement of the Skagerrak Centred Large Igneous Province (SCLIP) and the development of a surface dome due to the buoyancy of the hot plume material replacing the upper mantle, which was succeeded by rifting.
Stage 2a: During the early cooling phases of the SCLIP mantle plume, thermal expansion of the crust balanced the contraction of the upper mantle, and the surface remained subaerially exposed allowing for erosion during most of the Early Permian and early part of the Late Permian. This resulted in the formation of the regional top pre-Zechstein horizon.
Stage 2.b: Some of the erosional products formed during stage 2.a were deposited in local fault- bounded basins formed during stage 1. A major part of the accommodation space generated during the Late Permian and Triassic was the result of subsidence compensating for the crustal mass deficit that was caused by erosion of the SCLIP dome. Evolution of accommodation space during the Triassic was also affected by syn-depositional rifting and by salt mobilisation. Overall, sediment accumulation in the Danish Basin was high throughout the Late Permian and Triassic, and sediments derived from southern Scandinavia caused overfilling of the basin during most of the Triassic.
Stage 3: A rift episode in the Early Jurassic and one in the Late Jurassic controlled the evolution of accommodation space during the Jurassic and Early Cretaceous. The post-rift unconformities associated with these events cut into the Triassic succession deposited on the Ringkøbing–Fyn High and in the northern part of the North German Basin. Sediment accumulation in the Danish Basin was slow during the Jurassic and Early Cretaceous compared to the Triassic. It appears that thermal contraction of the lithosphere was insignificant during this period. Throughout most of the Jurassic and Early Cretaceous, relative sea-level changes were important in controlling the depositional environment and the location of the shoreline.
Stage 4: The last tectonic stage indicated by curves of basin-floor burial comprises the c. 40 Myr long Late Cretaceous – Danian period characterised by the accumulation of chalk during a long-lasting sea-level high. This was followed by overall regression in the Paleogene and tilting of the area in the Neogene. Several phases of basin inversion are recognised within the Sorgenfrei–Tornquist Zone.
Acknowledgements
This work was made possible by a targeted grant provided by the former Ministry of Energy and Climate resulting from the Climate Agreement of 12 March 2012 by the Danish parliament and a research grant from the Danish Innovation Fund (GEOTHERM-project 6154-00011B). The authors are also grateful to dr.scient., Professor Finn Surlyk, for a comprehensive and detailed readthrough with many valuable suggestions that improved a previous version of the manuscript. Thanks are also due to Ole V. Vejbæk, Mads Huse, Torsten Hundebøl Hansen and Lars Hamberg for constructive suggestions. The authors are also grateful to Dr Gabriel Strykowski and Dr Steen A. Petersen for permission to use the gravity maps. Lastly, the authors thank Carsten E. Thuesen for preparing the figures.
Additional Information
Additional files
Eight profiles are provided in an Appendix accompanying this manuscript.
Author contributions
Conceptualization: LOB, MSA, EK, HV, LHN
Data curation: LOB, MSA, EK, ANM
Formal Analysis: LOB, MSA, EK
Funding Acquisition: LHN
Investigation: LOB, MSA, EK
Methodology: LOB, MSA, EK, ANM, LHN
Project Administration: LOB, MSA, LHN
Resources: LOB, MSA, ANM
Software: LOB, MSA, ANM
Supervision: LOB, MSA, LHN
Visualization: LOB, MSA, EK, ANM
Writing-original draft: LOB, MSA
Writing- review & editing: LOB, MSA, HV, ANM, LHN
Data availability statement
All gridded data are available to download at https://doi.org/10.22008/FK2/THTMHL.
References
Appendix 1
Eight profile lines (cross-sections) illustrating the geologic evolution of the study area. The location of the profile lines is shown in Fig. 4. The profile lines are produced from interpreted seismic profiles intersecting wells in the area. The included seismic profiles are separated by black thin vertical lines. The coloured formations form potential reservoirs for CO2 storage and deep geothermal energy. The Zechstein Formation, which reflects the halotectonic influence on the geological evolution, is also colour coded. Major faults in the Pre-Zechstein and in the post Zechstein column are marked. Note that the vertical scale is in TWT seconds.