 |
RESEARCH ARTICLE  |
Traverse route from Pituffik to Warming Land, North Greenland
Abstract
We examine the feasibility of an overland motorised traverse from Pituffik to Greenland’s oldest ice outcrop in Warming Land, North Greenland. We assess a 778 km overland traverse that departs Pituffik via the Nunatarssuaq Take-Off Ramp, which is an alternative to the more frequently used, but more heavily crevassed, Thule Take-Off Ramp. The traverse route includes brief sea ice and primitive road conditions, each c. 4% of the route length, and a lengthy ice sheet segment (c. 92% of the route length). This study outlines challenges for each of these traverse segments, including primitive road conditions and snow cover, seasonality of extreme cold conditions (air temperatures below –30°C), seasonality of surface melting and softening (air temperatures above 0°C), sea-ice thickness and potential ridging hazards and ice dynamics and potential crevasse hazards. Ongoing work is required for annual vetting of the traverse route to ensure operational safety. The optimal operational window for such a traverse is departing Pituffik in mid-April and returning in mid-May. In comparison to aircraft-supported ice-sheet fieldwork, scientific traverses offer the opportunity for more intensive ground-based science, while significantly reducing carbon emissions. Based on previously reported traverse fuel consumptions, a ground traverse from Pituffik to Warming Land would use 90% less fuel than aircraft-supported fieldwork. This assessment underscores the potential for sustainable ground-based access to Greenland’s oldest ice outcrop and other science sites within the region.
Citation: Colgan et al. 2025: GEUS Bulletin 59. 8387. https://doi.org/10.34194/ft7sk529
Copyright: GEUS Bulletin (eISSN: 2597-2154) is an open access, peer-reviewed journal published by the Geological Survey of Denmark and Greenland (GEUS). This article is distributed under a CC-BY 4.0 licence, permitting free redistribution, and reproduction for any purpose, even commercial, provided proper citation of the original work. Author(s) retain copyright.
Received: 12 Dec 2024; Revised: 23 May 2025; Accepted: 17 Jun 2025; Published: 20 Oct 2025
Competing interests and funding: Henrik Lassen and Sune Tamm supply data on their own vehicles.
This work was supported by GC-Net.
*Correspondence: wic@geus.dk
Keywords: traverse, ice sheet, Pituffik, Warming Land
Abbreviations
CEN: Camp Century weather station
GC-Net: Greenland Climate Network
GEUS: Geological Survey of Denmark and Greenland
HUM: Humboldt weather station
NGRIP: North Greenland Ice Core Project
NSF: National Science Foundation
NUTO: Nunatarssuaq Take-Off
PDD: positive degree days
PROMICE: Programme for the Monitoring of the Greenland Ice Sheet
THU_L: Thule Lower
TUTO: Thule Take-Off
USACE: U.S. Army Corps of Engineers
Edited by: Harold Lovell (University of Portsmouth, UK)
Reviewed by: Zoe Courville (Cold Regions Research and Engineering Laboratory, USA), Lenneke Jong (Australian Antarctic Division, Australia) and one anonymous reviewer
Greenland’s oldest ice outcrop
Ice cores, drilled vertically into Earth’s ice sheets and glaciers, have provided valuable information on past climates (Jouzel & Masson-Delmotte 2010). Retrieving precious ancient ice, however, comes at great cost and typically takes several years. Collecting so-called ‘horizontal ice cores’ seeks to make use of the fact that ancient ice can also resurface at land-terminating margins. While this approach has long offered the tantalising possibility to recover nearly unlimited volumes of paleo ice of a desired age, reliably assessing surface ice age has been a tremendous practical challenge to such efforts (Reeh et al. 2002). The few attempts to collect horizontal chronologies of ice, however, have benefited from more detailed analyses than are possible with volume-limited conventional ice core samples recovered from depth (Petrenko et al. 2006; Kurbatov et al. 2010).
The age and extent of Last Glacial Period ice outcropping from the ice-sheet ablation area has recently been mapped in North Greenland using visible spectrum satellite imagery linked to ice-core stratigraphy and chronology (MacGregor et al. 2020). Alternating light and dark bands within this Last Glacial Period ice outcrop correlate with periods of higher and lower dust concentration in the North Greenland Ice Core Project (NGRIP) ice core. This reflects Greenland Stadials and Interstadials associated with Dansgaard–Oeschger events. In Warming Land, North Greenland, the alternating light and dark ice bands allow the ablation area ice to be potentially mapped to at least 48 000 years before the present time (MacGregor et al. 2020). This makes the Warming Land ice-sheet ablation area a high priority target for paleoclimatic sampling. We describe general science plans for the Warming Land ablation area towards the end of this report.
The Warming Land ablation area containing Greenland’s oldest ice outcrop is located between Sermeq Konrad Steffen and Sermeq Niels Reeh. This is an exceptionally logistically challenging location to reach. While Knud Rasmussen’s Second Thule Expedition (1917–1918) and Svend Lauge Koch’s Bicentenary Jubilee Expedition (1920–1923) both crossed the ice-sheet ablation area in Warming Land, only one modern scientific party, a 1984 GEUS (Geological Survey of Denmark and Greenland) team led by Niels Henriksen, has undertaken glaciological investigations there (Henriksen et al. 2009; Dawes 2022). Located c. 530 km from the airport at Qaanaaq to the south-west and c. 580 km from the airport at Station Nord to the east, the site is difficult to reach by aircraft due to the long distances over which aircrafts must carry their own return fuel. Aircraft logistics are therefore poorly suited for sustaining scientific investigations at Greenland’s oldest ice crop.
Motorised ice-sheet traverses
An alternative to using aircraft is using ground vehicles for overland traverses on the ice sheet (Fig. 1). Between 1959 and 1967, traverses of the U.S. Army Corps of Engineers (USACE) regularly departed the Pituffik Space Base (formerly Thule Air Base) to support Camp Century inland on the ice sheet. These traverses primarily ascended the ice sheet at Thule Take-Off (TUTO) Ramp, south of Pituffik (Davis 1967). Between 2008 and 2016, TUTO Ramp was utilised by the U.S. National Science Foundation (NSF) to operate 2200 km round-trip resupply traverses between Pituffik and Summit (Lever & Weale 2011). Recent increases in crevasse extent c. 40–45 km inland from TUTO Ramp have effectively ended the operational use of this route. This inland crevasse area is located where the traverse route follows along a relatively narrow local flow divide between Ullip Sermia (Harald Moltke Bræ) flowing into Uummannap Kangerlua (Wolstenholme Fjord) to the north and a family of tidewater glaciers draining into Puisillip Kangerlua (De Dødes Fjord) to the south.
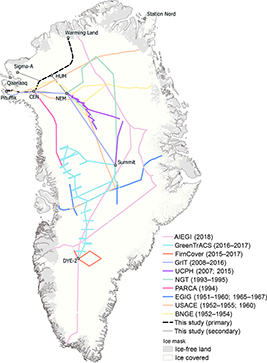
Fig. 1 Overview placing the traverse route assessed in this study in the context of past traverses on the Greenland ice sheet. Past traverses: AIEGI: American-Icelandic Expedition on the Greenlandic Icecap (Stokholm et al. 2021); GreenTrACS: Greenland Traverse for Accumulation and Climate Studies (Meehan et al. 2021); FirnCover: Greenland Firn Compaction Verification and Reconnaissance (MacFerrin et al. 2022); GrlT: Greenland Ice Sheet Traverse (Hawley et al. 2014); UCPH: University of Copenhagen (Karlsson et al. 2020); NGT: North Greenland Traverse; PARCA: Program for Arctic Regional Climate Assessment (Thomas et al. 1998); EGIG: Expédition Glaciologique Internationale Au Groenland (Hofmann 1964); USACE: U.S. Army Corps of Engineers (USATB 1960; Benson 1962); BNGE: British North Greenland Expedition (Hamilton et al. 1956). This compilation of previous motorised traverses is likely not comprehensive. Stars indicate place names referred to in the text. HUM: Humboldt. CEN: Camp Century. NEM: North Greenland Eemian Ice Core (NEEM). SIGMA-A: Snow Impurity and Glacial Microbe in the Arctic site. DYE-2: disused radar station.
Before selecting TUTO Ramp as the primary ice-sheet ascent to Camp Century, the USACE also trialled ascending the ice sheet at Nunatarssuaq Take-Off (NUTO) Ramp, on the north side of Uummannap Kangerlua (Wolstenholme Fjord; Fig. 2). This land–ice transition had been previously used by the British North Greenland Expedition (Hamilton et al. 1956). While NUTO Ramp was located at an elevation similar to TUTO Ramp, the steeper ice-sheet surface there presented a shorter ablation area to traverse. The TUTO and NUTO ice-sheet ascents, after differing lengths of over ice travel, converged at ~1200 m elevation on the ice sheet, at a site named Sierra. The seasonal constraint of crossing the sea ice from Pituffik to NUTO Ramp ultimately compelled the USACE to construct a gravel road across the ablation area at TUTO Ramp to permit year-round ice-sheet access. NUTO Ramp has fallen almost entirely out of use since that time.
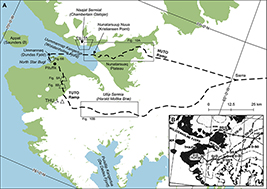
Fig. 2 Overview of the study area. A: Highlighting the TUTO and NUTO ramps, as well as place names in the vicinity of Pituffik (Klimadatastyrelsen 2024a). The black dashed line represents the traverse routes. B: Mile markers on the overland traverses from the NUTO and TUTO ice-sheet approaches (Benson 1962). Reproduced from the U.S. Corps of Army Engineers.
During the 1950s and 1960s, the USACE also performed extensive testing of the trafficability of different vehicle types on the ice sheet in North-West Greenland (Nuttall & Finelli 1955; Rula 1960; Mellor 1963; Schreiner 1965). This testing provides a wealth of information that continues to be relevant today. In these investigations, the USACE clearly identified that vehicle performance is dependent on snow type and wetness, with all vehicles performing best on dry fine-grained snow. While wheeled vehicles perform adequately in the ice sheet’s interior accumulation area, tracked vehicles consistently outperformed wheeled vehicles, especially when the snow is either deep and soft or wet and saturated. The USACE reports of the era therefore make the specific recommendation that tracked vehicles with ground pressure under 6 psi (41 kPa) provide the most effective means of ice-sheet transportation in North-West Greenland across all conditions.
Pittufik to Warming Land
Here, we look at the technical and logistical feasibility of supporting scientific investigations at Greenland’s oldest ice outcrop, in Warming Land, using an overland traverse from Pituffik. As an alternative to the heavily crevassed TUTO route, we assess a route that ascends the ice sheet at NUTO Ramp (Fig. 2). We provide an overview of the route, and describe specific challenges of the sea ice, the primitive road and the ice sheet segments of the traverse (Fig. 3). We also describe general science plans for working in the Warming Land ice-sheet ablation area. Lastly, we assess the differences in carbon emissions associated with accessing Warming Land via aircraft and traverses.
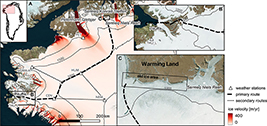
Fig. 3 Overview of the traverse route from Pituffik to Warming Land, with ice-sheet surface velocities overlaid on a visible SPOT 6 satellite image mosaic of 10 m spatial resolution for the region from July 2020 (Solgaard & Kusk 2022; Solgaard et al. 2021; Klimadatastyrelsen 2024). Potential route extensions linking secondary ice-sheet science sites in the area are also shown. Secondary ice-sheet science sites are denoted thus: HUM for Humboldt, CEN for the Camp Century, NEM for the North Greenland Eemian Ice Core (NEEM) and SIGMA-A for the Snow Impurity and Glacial Microbe in the Arctic site (Matoba et al. 2018; Vandecrux et al. 2023).
The traverse route from Pituffik to Warming Land, via NUTO Ramp, is 778 km long one way. It begins at the North Star Bugt sea-ice access ramp at Pituffik Space Base, located at sea level at the harbour. The first 29 km of the route crosses sea ice around Uummannaq (Dundas Fjeld) into Uummannap Kangerlua (Wolstenholme Fjord), making landfall again at Nunatarsuup Nuua (Kristiansen Point). The subsequent 32 km of the route (km 29 to 61) then traverses a primitive road constructed by the USACE in 1954. This primitive road rises from sea level to the margin of the ice sheet at 552 m elevation. This primitive road reflects c. 4% of the total traverse length, but >25% of the total traverse elevation climb. The remaining 717 km of the route traverses the ice sheet, terminating in the Warming Land ablation area. On the ice sheet, the proposed route is selected with the primary goals of minimising altitudinal variations and ice velocities (Fig. 4).
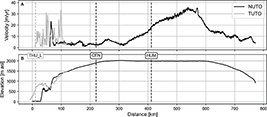
Fig. 4 Feature of the traverse routes. A: Ice surface velocity along the TUTO and NUTO traverse routes to Warming Land derived from a 5-year average (2016–2021) based on offset tracking of Sentinel-1 data (Solgaard & Kusk 2022; Solgaard et al. 2021). B: Surface elevation along both routes (Porter et al. 2023). Vertical lines mark the location of the PROMICE/GC-Net weather stations along the routes. These stations are denoted thus: THU_L for Thule Lower, CEN for Camp Century and HUM for Humboldt (Vandecrux et al. 2023; How et al. 2022).
The route ascends the ice sheet via the centreline of NUTO Ramp and continues climbing a local flow divide to where it intersects the TUTO Ramp approach route at km 119 (1443 m elevation). To minimise crossing high ice velocities and strain rates associated with tributaries of Ullip Sermia (Harald Moltke Bræ), our proposed NUTO ascent bears north of the USACE NUTO ascent. Consequently, the modern Sierra, or intersection of the TUTO and NUTO approaches, is c. 16 km further east of the USACE Sierra (Mile 1–10 instead of Mile 1–0; Fig. 2). From this modern Sierra crossroads, the route then follows the local ice-flow divide upwards to Camp Century weather station at km 221 (CEN; 1895 m elevation). The route then turns north-east and follows just below the 2000 m contour, passing the Humboldt weather station at km 412 (HUM; 1950 m elevation), and continues east, past the inland ice-stream onset of Petermann Gletsjer (Fig. 3). It then turns north to descend a local ice-flow divide into the land-terminating ice-sheet ablation area in Warming Land at km 778 (902 m elevation).
A shapefile of this traverse route is available in the online supplementary material associated with this report (Supplementary File S1).
Sea-ice segment
The 29 km sea-ice portion of the traverse connects between Pituffik and Nunatarsuup Nuua (Kristiansen Point). We assess sea-ice characteristics along this portion of the traverse route during the 2014–2024 period using sea ice classification charts from the Danish Meteorological Institute (DMI 2024). We extract sea ice extent from Landsat 8 satellite imagery with a 30 m resolution. The DMI sea ice charts are determined by the interpretation of blended synthetic aperture radar imagery, optical imagery, infrared temperatures and passive microwave imagery. Together, these ice type and extent data show that sea ice thickness and extent demonstrate a consistent seasonality within Uummannap Kangerlua (Wolstenholme Fjord; Fig. 5, Table 1).
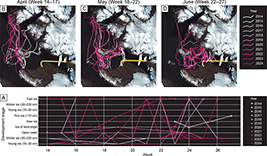
Fig. 5 Sea-ice conditions in the vicinity of the traverse routes. A: Sea-ice development stage assessed in sea-ice charts of the Danish Meteorological Institute (DMI 2024). B–D: Sea-ice extent delineated in Landsat 8 visible imagery of 15 m resolution for April, May and June during the period 2014–2024. Acquisition dates listed in Table 1. Yellow line: sea-ice segment of the traverse.
| Year | April | May | June |
| 2014 | 8, 10, 13, 17 | 19, 24, 26 | 2, 6, 13, 25 |
| 2015 | 2, 20, 25, 27, 29 | 4, 18, 20, 22, 27, 29 | 28, 30 |
| 2016 | 2, 6 | 6, 15, 22, 24, 29 | 5, 6, 10, 27, 29 |
| 2017 | 5, 7, 14 | 2, 11, 16, 30 | 5, 17, 23, 29, 30 |
| 2018 | 3, 17 | 10, 14, 26 | 4, 6, 11, 15, 27, 28 |
| 2019 | - | 6, 10, 15, 21, 29, 31 | 7, 13, 27, 29 |
| 2020 | 6, 24 | 10, 14, 17, 24 | 6, 8, 13, 18, 20, 27 |
| 2021 | 9, 25 | 2, 4, 6, 26 | 5, 7 |
| 2022 | 3, 21 | 9, 13, 14, 16 | 1, 15, 17, 22, 24, 30 |
| 2023 | 1, 6, 8 ,10 | 19 | 1, 2, 4, 24, 26, 29 |
| 2024 | 10 | 5, 19, 21, 26 | 4, 10, 15, 19, 20, 22, 26, 28, 29 |
Land-fast ice is present within the fjord each winter until the open water retreats inside Appat (Saunders Ø) at the mouth of Uummannap Kangerlua. This breakup of the land-fast ice generally occurs in June (weeks 23–27) but has been observed to occur in May (weeks 18–22) at least once during the 2014–2024 period. The traverse route plans to utilise the maintained land-to-sea transition at Pituffik harbour (Fig. 6). It is, however, also possible to transition from land to sea at Dundas village, north of the Pituffik space base, inside Uummannap Kangerlua. Using the Dundas transition point, which remained within the May land-fast ice perimeter in all years during 2014–2024, may mitigate early sea-ice breakup in the vicinity of Appat. Uummannap Kangerlua is rarely filled with land-fast ice throughout June. Sea ice of at least 30 cm thickness is present along the traverse route throughout April (Fig. 5). This includes the DMI classifications of ‘fast ice’ and assorted ‘winter ice’ types, which itself includes ‘thin’ – (30–70 cm), ‘middle’ – (70–120 cm) and ‘thick’ – (>120 cm) types (DMI 2024). Around mid-May (week 19), thinner sea-ice classifications, including ‘young’, ‘grey’, ‘thin’ and ‘new’, become increasingly present, as the fjord regularly transitions to open water by late June.
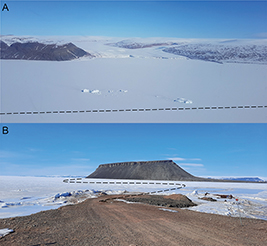
Fig. 6 Views to the traverse. A: Oblique aerial photograph of land-fast ice within Uummannap Kangerlua (Wolstenholme Fjord) on 22 May 2018. Naajat Sermiat (Chamberlin Glacier) in the background. Photo: William Colgan. B: Photograph of the land-to-sea transition maintained at Pituffik harbour on 17 May 2022. Uummannaq (Dundas Fjeld) in the background. Photo: William Colgan. The location of the photos is depicted in Fig. 2. The black dashed line represents the traverse route.
Within this range of winter sea-ice thicknesses, Canada’s Government of the Northwest Territories recommends wheeled vehicle loads, ranging from 3600 kg at 30 cm thickness to 57 600 kg at 120 cm thickness (GNWT 2015). This assumes a natural ice-pressure factor of 4 kg/cm2 or 392 Pa, which may be exceedingly conservative for the low-ground pressure vehicles suitable for traversing the ice sheet. In any case, the acceptable load for the sea-ice traverse can be most accurately estimated by verifying the thickness of the sea-ice route each year. This can be done via an ice-penetrating radar survey with accompanying ice coring (Masterson 2009; Barrette 2015).
Similar to the ice-sheet segment of the traverse, trafficability of the sea ice segment can be hindered by positive (above-freezing) air temperatures, which warm and soften the snowpack. Near sea-level meteorological records observed at Pituffik suggest that the average date of thaw onset, or positive air temperatures, is 17 May over the 1995–2024 period (Menne et al. 2023; Jensen et al. 2025). The earliest date of thaw onset during this period has been 18 March (2013), and the latest date of thaw onset during this period has been 15 June (2022). Traverse operations on the sea ice should therefore ideally occur prior to mid-May, to avoid softening snowpack, and certainly before the end of May, to avoid spring breakup of the land-fast sea ice.
Primitive road segment
The 32-km primitive road segment traverses the Nunatarsuaq Plateau, from the ocean shore at Nunatarsuup Nuua (Kristiansen Point) to the ice-sheet margin at NUTO ramp (Fig. 7). Fortunately, the land-fast nature of sea ice within Uummannap Kangerlua (Wolstenholme Fjord) minimises the development of ice ridges associated with sea-ice thrusting along the shoreline. The sandy spit at Nunatarsuup Nuua has shallow relief and presents two nearly orthogonal beach aspects. This offers some protection against sea-ice ridging by both minimising local formation and providing perpendicular approaches.
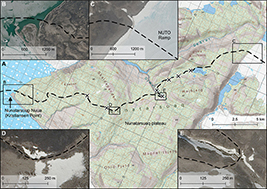
Fig. 7 Map of a primitive road on the Nunatarsuaq plateau between Nunatarsuup Nuua (Kristiansen Point) and the ice-sheet margin. A: Topographic map of the entire road length with suspected washouts of the roadbed indicated in red (Klimadatastyrelsen 2024a). B: Visible image at landfall, Nunatarsuup Nuua. C: Visible image of the NUTO ice ramp. D: Detailed visible image of a road segment in good condition. E: Detailed visible image of a road segment likely eroded by a river crossing. All visible satellite images are SPOT 6 images from July 2020 (Klimadatastyrelsen 2024b). The black dashed line represents the traverse route.
From Nunatarsuup Nuua, the route ascends the primitive road to the ice-sheet margin at the NUTO ramp. The primitive road appears to have been actively maintained by the USACE between its 1954 initial use and the subsequent 1960 completion of an improved ramp at TUTO in support of Camp Century operations (WES 1959; Davis 1967). The NUTO approach has received virtually no maintenance since then, however, although recreational vehicles from Pituffik are known to have used the route in recent years.
To evaluate the current condition of the NUTO access road, we analysed a mosaic of SPOT visible imagery and individual scenes TanDEM-X radar imagery, with spatial resolutions of 1.6 m and 6 m, respectively. In the first 10 km from Nunatarsuup Nuua, the road climbs more than 500 m in elevation and then follows natural topography on the Nunatarsuaq Plateau. Nearly the entire road length appears to be in good condition, with the raised and graded material of the roadbed intact and visible from space (Fig. 7). At seven stream crossings, however, the roadbed has clearly been eroded. Such washouts of road material are regularly reported during NUTO Ramp’s operational period (WES 1959).
Wind sheltering can cause drifting snow to preferentially accumulate in topographic depressions, due to aeolian deposition associated with decreased windspeeds in sheltered depressions (Mott et al. 2018). GEUS has operated on the TUTO access road most springs since c. 2010. In our experience, windblown spring snowpack collects on the road where it forms a local depression relative to surrounding topography. We therefore expect that windblown spring snowpack will preferentially collect in washouts on the NUTO access road. Spring snow coverage, however, is far from uniform on the Thule Peninsula, both through time and space (Fig. 8). From operational experience at TUTO access road, we expect that the majority (c. 75%) of the access road remains effectively snow-free, due to its elevated relief, with only a minority (c. 25%) of the access road having sufficiently depressed local relief to develop a windblown snowpack. If the NUTO access road shares these general characteristics, then depressed stream crossings will likely be snow-filled each spring. The majority of the primitive road traverse will also therefore take place on gravel, rather than snow.
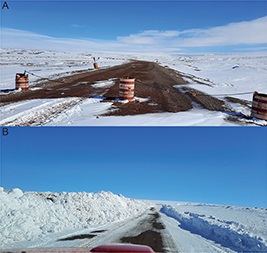
Fig. 8 View of the traverse. A: Photograph of a relatively elevated portion of the TUTO access road that remains snow-free in the spring (27 May 2023). Photo: William Colgan. B: Photograph of a relatively depressed portion of the TUTO access road where spring snow depth is >1 m (31 May 2023). Photo: William Colgan. The location of the photos is depicted in Fig. 2.
Ice-sheet segment
The 717 km long ice-sheet segment begins with the ascent of NUTO Ramp and ends in the ice-sheet ablation area in Warming Land (Nobles 1960). This longest portion of the traverse route has two main challenges, trafficability of the surface and crevasse safety hazards. The trafficability of the ice-sheet surface is highly dependent on cold and firm snow conditions, as warm and soft snow can significantly hinder vehicle performance. Surface melting can also present obstacles such as supraglacial lakes and streams. We assess the likelihood of encountering melting conditions using observations from the PROMICE (Programme for the Monitoring of the Greenland Ice Sheet) Thule Lower (THU_L; 570 m elevation) automated weather station located on TUTO Ramp. This station is representative of the warmest low-elevation conditions along the ice-sheet segment. We also assess the GC-Net (Greenland Climate Network) Humboldt (HUM) station in the ice-sheet interior, as representative of the coldest high-elevation conditions.
The annual positive degree days assessed at THU_L during the 2010–2023 observational period ranges from 51 days in 2013 to 97 days in 2019 (Fig. 9; Fausto et al. 2021; How et al. 2022). During this period, the average melt onset at THU_L is 29 June, with the earliest melt onset recorded on 18 March 2013 and latest melt onset recorded on 9 August 2010. These positive degree days represent the cumulative number of degrees Celsius that daily mean air temperatures are above 0°C during a single melt season. Their cumulative values provide an indication of melt intensity. This THU_L positive degree day analysis suggests that melting conditions become typical after 1 June. Traverse operations on the ice sheet should therefore conclude by the end of May, to avoid surface melt of the ice sheet.
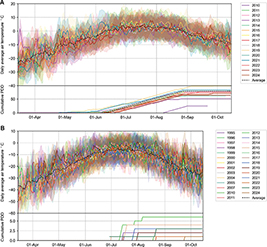
Fig. 9 Daily air temperatures and cumulative positive degree days (PDD) for all available station years during the polar day period for A: Thule Lower (THU_L) and B: Humboldt (HUM) ice-sheet weather stations (Fausto et al. 2021; Vandecrux et al. 2023; How et al. 2022). THU_L is located at an elevation of 570 m at TUTO Ramp near Pituffik. HUM is located at an elevation of 1950 m in the high-elevation ice-sheet interior. The transparent range around the daily air temperature values represents an uncertainty of one standard deviation.
We also assess air temperatures at the HUM weather station between 1995 and 2021 (Fausto et al. 2021; Vandecrux et al. 2023; How et al. 2022). At 1950 m elevation, HUM is characteristic of the high-elevation firn plateau that comprises most of the traverse route. Daily average air temperature at HUM rarely exceeds 0°C, with the highest daily average air temperature being 1.6°C (Fig. 9). Surface melt is typically negligible in the high elevation ice-sheet interior of North-West Greenland. Instead, the primary temperature concern on the high-elevation firn plateau is exceeding the operational cold-limit of vehicles. At HUM, the daily average air temperature during the April and May period ranges between –40°C and –12°C, with instances of the daily average air temperature below –40°C. The coldest ever recorded daily average temperature at HUM is –51.0°C on 22 March 2001. The daily average temperature typically climbs above –30°C in mid-April. This likely serves as the earliest practical start for inland traverse operations.
Crevasses pose an additional hazard on the ice-sheet segment of the traverse. The emergence of large crevasses c. 40–45 km inland from TUTO Ramp in recent decades has effectively suspended traverses from TUTO Ramp since 2016 (Fig. 10). By ascending the NUTO Ramp, any traverse effectively avoids this narrow region of high ice strain between Ullip Sermia (Harald Moltke Bræ) and the tidewater glaciers draining into Puisillip Kangerlua (De Dødes Fjord). Ice-surface velocities are readily available from offset tracking in satellite radar imagery (Solgaard et al. 2021). Via the TUTO approach, ice-surface velocities in the first c. 120 km of the traverse to Sierra average 9.0 ± 6.8 m/yr (Fig. 4). Via the NUTO approach they average only 5.8 ± 4.9 m/yr. While crevasses were historically present in ablations areas along the inland TUTO approach to Sierra (Meier et al. 1957), they have never been historically present in the NUTO ablation area and approach to Sierra (Nobles 1960).
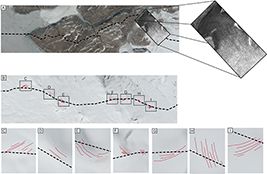
Fig. 10 Crevasse hazards along the NUTO and TUTO approaches. A: No crevasses are evident in the ablation area segment of the NUTO approach, even in TanDEM-X radar imagery from April 2022 with a 6 m resolution. B: Ablation area crevasse hazards along the TUTO approach in visible SPOT 6 satellite imagery from July 2020 with a spatial resolution of 1.6 m (Klimadatastyrelsen 2024b). The red lines in insets C–I denote crevasses that intersect the TUTO approach. The black dashed line represents the traverse route via both NUTO and TUTO approaches.
Crevasse traces, however, are currently clearly visible on NUTO Ramp (Fig. 11). These crevasse traces are distinctive bands of dark ice that result from refrozen water within healed fractures. They can originate from several processes, including (1) recent cessation of local crevassing as ice flow becomes less dynamic, (2) ongoing thrust fracturing and annealing occurring locally at similar time scales and/or (3) advection of re-healed full-thickness crevasses from upstream (Hambrey 1976; Hambrey & Müller 1978; Hambrey & Lawson 2000). We cannot speculate on the origin of the pronounced crevasse traces in the ablation area of NUTO Ramp today, but the presence of well-developed supraglacial runoff channels that consistently bisect these features indicate that they do not disrupt supraglacial hydrology by providing englacial access points. This suggests that they are not open features that can impend the safety or trafficability of ascending the ramp.
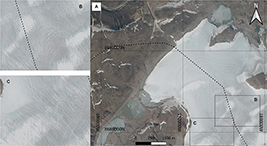
Fig. 11 Assessing potential hazards along the NUTO Ramp. (A): Visible band SPOT 6 satellite image of 1.6 m spatial resolution of NUTO Ramp in July 2020 (Klimadatastyrelsen 2024b). The black dashed line represents the traverse route. Locations of inset images are shown. B: Highlights crevasse traces intersected by supraglacial streams. C: Highlights supraglacial streams only.
Although crevasses are not common within Greenland’s high-elevation firn plateau, transverse and shear crevasses, both open and closed, of multi-metre widths have been documented above 1850 m elevation in a variety of different ice flow settings (Mankoff et al. 2020; Franke et al. 2022; Løkkegaard et al. 2024). Therefore, while crevasse hazard is generally minimised by selecting a route that minimises both absolute velocity and spatial gradients in velocity (i.e. strain rate), it is advisable to manually inspect satellite radar imagery of the entire high-elevation firn plateau route segment for crevasses. It is especially important to confirm the absence of crevasses in the vicinity of the inland ice stream onset that forms the Petermann Glacier. Such an operational analysis could necessitate route deviations on the scale of 10s of kilometres.
Warming Land science plan
The ice-sheet ablation area in Warming Land, between Sermeq Konrad Steffen to the west and Sermeq Niels Reeh to the east, is the ultimate science goal of the 778 km traverse. There, a <2 km long transect spans the past 12 Greenland Interstadials and past 13 Greenland Stadials, allowing ice to be potentially dated and sampled back to c. 48 000 years before the present time (Fig. 12; MacGregor et al. 2020). This sampling transect starts at the Holocene boundary (81.16217°N and 53.55995°W) and proceeds down the glacier, towards the ice margin, to the discontinuity that appears to mark the start of stratigraphically disordered basal ice (81.17447°N and 53.49773°W). This sampling transect is orientated to minimise crossings of large supraglacial channels. Even older ice is likely found between the GI-13 termination (c. 48 000 years ago) and the ice margin but it is more difficult to map the chronology from space. The surface expression of the stadial and interstadial ice bands are all at least >20 m wide, which potentially allows them to be located with the precision of a handheld GPS.
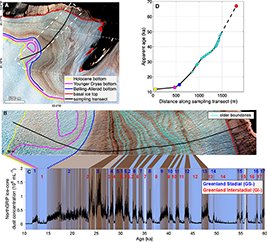
Fig. 12 Overview of the planned ice sampling transect in Warming Land adapted from MacGregor et al. (2020). A: Contrast-stretched WorldView-2 multispectral image of the ice-sheet margin at Warming Land with 1.8 m spatial resolution from 19 August 2014. White dashed line indicates area covered by panel B. ‘b’ indicates the origin (0 m) of the science transect. B: 45º-rotated zoom-in on exposed surface layering with sampling transect (black line). Colour shading of lines defined in panel A. C: Dust concentration measured in the NorthGRIP ice core (Ruth et al. 2003). Shaded polygons that link panel B with C illustrate potential stratigraphic correlations between surface- and ice-core observed dustiness – blue shading indicates low dust concentrations and brown shading indicates high dust concentrations. D: Relation between along-transect distance and apparent ice age (based on visual correlations; colour shading of dots defined in panel A). WorldView image in A and B: copyright Maxar Inc.
Our primary science goal is bulk sampling of pre-Holocene ancient ice. Following previous studies that have bulk-sampled Greenland ice for subsequent chemical analysis (Reeh et al. 2002; Schaefer et al. 2009), we expect to use electric chainsaws, appropriately prepared and cleaned, to reach a depth of >1 m below the weathering crust, from where ice samples will be recovered. Ice samples will ideally be recovered from a variety of depths within each of the stadial and interstadial ice bands. Rather than transporting the ice back for laboratory analysis, we anticipate extracting and concentrating the air bubbles from the ice, and only transporting this extracted air back for laboratory analysis. This requires a field-operable vacuum-melting tank that uses a noble gas for evacuation. While this is a sensitive apparatus, it has been successfully used in ice-sheet field camps (Petrenko et al. 2006, 2008).
Beyond paleoclimatology and the bulk sampling of ancient atmospheres, there are numerous secondary science goals to investigate in the Warming Land ice-sheet ablation area. These include ice-penetrating radar surveys to reconstruct three-dimensional englacial layering of stadial and interstadial ice bands to inform ice-flow models (Mackay et al. 2014), direct measurements of the material properties of ice deposited during different stadials and interstadials (Paterson 1991), the first systematic survey of Greenland’s most promising outcrop for meteorites (Whillans & Cassidy 1983), assessing the current mass balance and future persistence of Greenland’s oldest ice outcrop (Gilbert et al. 2017) and lastly using englacial temperature profiles to infer geothermal heat flow in a poorly unconstrained area (Colgan et al. 2022). There is also the possibility to undertake further opportunistic studies at automatic climate stations located along the traverse route (Matoba et al. 2018; Vandecrux et al. 2023; Fig. 3).
We anticipate that the science traverse will need to transport c. 3000 kg of scientific and camping equipment to Warming Land and back, which would support a six-person team for an approximately 1-month period (Colgan et al. 2018). Following a series of small daily transit camps during the inbound traverse, the team would establish a larger multi-week science camp in the middle of the sampling transect. A science camp established at the GI-8/GS-8 transition on the sampling transect (81.1698°N, 53.51036°W) would be within c. 600 m of all ice bands between GI-13 termination (c. 48 000 years ago) and the Younger Dryas (GI-1 onset; c. 12 000 years ago; Fig. 12). Similar to the NUTO Ramp ablation area, the presence of well-developed supraglacial runoff channels in high-resolution visible imagery indicates an absence of crevasses in the Warming Land ablation area. This should permit field scientists to move with relative ease along the sampling transect.
The green transition
Traverses are an economical way to move heavy equipment and supplies across the ice sheet, while also allowing scientific activities to be performed along the traverse route (Fig. 13; Lever & Weale 2011; Hawley et al. 2014; Lever et al. 2016; Stockholm et al. 2021). For example, the USACE estimated that the Weasel M29C, with a tare weight of c. 2500 kg and a ground pressure of 2 psi (14 kPa), has a rolling resistance of just 1% in dry snow conditions characteristic of much of the ice-sheet interior (Nuttall & Finelli 1955; Rula 1960). Under saturated snow conditions, found in the ablation area during the melt season, the Weasel’s rolling resistance can increase to 10%. Generally, however, the relatively low carbon footprint of ice-sheet traverses, in comparison to charter aircraft-supported ice-sheet access, makes them increasingly attractive options for adopting more sustainable ice-sheet operations as part of the Green Transition.
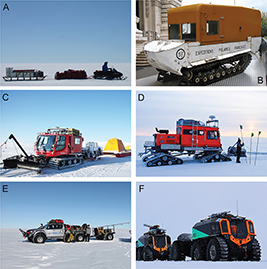
Fig. 13 Photographs highlighting the light traverse vehicles itemised in Table 2. A: Snowmobile. Photo: William Colgan. B: Weasel. Photo: Wikimedia Commons. C: Pisten Bully. Photo: Patrick Smith. D: Tucker SnoCat. Photo: Patrick Smith. E: Arctic Truck. Photo: Patrick Smith. F: Sherp. Photo: Henrik P.Ø. Lassen.
The fuel consumption of ice-sheet traverse vehicles is highly variable. Reported fuel consumption varies with vehicle type, payload, operating altitude, ice-sheet conditions and driver performance. We tabulate reported mileage and payloads for six vehicle types and estimate their carbon efficiency as vehicle mileage divided by vehicle payload (Table 2). The carbon efficiency units of L/km/t reflect the amount of fuel required to move a payload of one tonne over a distance of 1 km. These efficiencies range across an order of magnitude, from 0.023 L/km/t for a Piston Bully 300 to 0.80 L/km/t for a Weasel M29C. For comparison, a ski-equipped Twin Otter aircraft consumes c. 2 L/km of Jet-A fuel and can deliver 300 kg of payload to Warming Land, which is at an effective range limit from Qaanaaq. This yields a somewhat analogous carbon efficiency of 6.7 L/km/t, but this is not entirely comparable to the values listed in Table 2 as it externalises fuel weight. Generally, a ground traverse to Warming Land will use at least 90% less fuel per kilometre per tonne than typical aircraft-supported operations. Traverse vehicles also offer the possibility to use bio- or alternative fuels, which are not presently an option for aircraft operations in Greenland.
| Vehicle (fuel) | Mileage (L/km) | Payload* (kg) | Carbon Efficiency (L/km/t) | Source |
| Pisten Bully 300 (diesel) | 0.80 | 34 090 | 0.023 | Patrick Smith, per. comm. |
| Arctic Trucks Ford 6×6 (Jet A1) | 0.55 | 6100 | 0.090 | Sune Tamm, per. comm. |
| Tucker SnoCat (diesel) | 2.24 | 9070 | 0.25 | Lever & Weale 2011 |
| Tucker SnoCat (diesel) | 1.88 | 7270 | 0.26 | Patrick Smith, per. comm. |
| Pisten Bully 100 (diesel) | 1.88 | 6820 | 0.28 | Patrick Smith, per. comm. |
| Arctic Truck Toyota 6×6 (Jet A1) | 0.62 | 2200 | 0.28 | Sune Tamm, per. comm. |
| Sherp N1200 (diesel) | 0.40 | 1250 | 0.32 | Henrik Lassen, per. comm. |
| Arctic Truck Toyota 6×6 (diesel) | 0.62 | 910 | 0.68 | Patrick Smith, per. comm. |
| Polaris 550 Snowmobile (gasoline) | 0.40 | 550 | 0.72 | Patrick Smith, per. comm. |
| Weasel M29C (gasoline) | 1.27 | 1590 | 0.80 | Benson 1955 |
| *Payload refers to the combined vehicle and sled loads, including passengers and fuel. | ||||
For our specific Warming Land traverse application, we can calculate the direct carbon emissions associated with deploying c. 3000 kg with six persons to our intended science camp via Twin Otter versus Sherp 1200N. For a Twin Otter scenario, each round-trip flight from Qaanaaq to Warming Land to deliver 300 kg payload uses c. 2120 L of Jet-A fuel. Ten put-in flights and pull-out flights to transport the total camp payload would therefore require c. 42 400 L of Jet-A fuel. For a Sherp 1200N traverse, each vehicle would use c. 620 L of fuel for the return trip from Pituffik to Warming Land and back to Pituffik. We therefore assume a vehicle payload is approximately half fuel and half cargo. This would require five vehicles to transport the total science payload. These five vehicles would require a total of c. 3090 L of diesel fuel to complete the roundtrip traverse. In this specific application, the overland traverse scenario uses c. 7% of the carbon of the aircraft scenario. This difference in direct carbon emissions increases if the emissions associated with sea-lifting vehicles or flying aircraft to and from Pituffik are also included.
Summary
We evaluate the feasibility of an overland traverse from Pituffik to Warming Land that provides a safe and efficient method to access Greenland’s oldest ice outcrop. The 778 km route is designed to minimise variations in altitude and ice-surface velocities and strain rates, and mitigate potential sea-ice and crevasse hazards, as well as temperature risks. The route uses the historical NUTO Ramp to ascend the ice sheet, instead of the more crevassed TUTO Ramp. Analysis of satellite imagery confirms that the primitive access road to NUTO Ramp is mostly drivable, with seven washouts in depressions that spring snowpack is expected to largely mitigate.
The sea ice within Uummannap Kangerlua (Wolstenholme Fjord) has a relatively consistent seasonal pattern of thickness and extent. Landfast sea ice with minimal ridging generally persists to the end of May. Weather station data suggest that optimal conditions for snowpack firmness along the sea-ice and ice-sheet segments occur from mid-April to mid-May. On the ice sheet, during this period, there is both a low potential for extreme cold conditions as well as surface melting. Annual vetting of the traverse route, including ice-penetrating radar surveys and shallow coring on the sea-ice segment and manual inspection of remotely sensed imagery for potential crevasse hazards on the ice sheet segment, is required for operational safety. These potential issues could result in minor route deviations to bypass transient hazards.
Accessing Warming Land via ground traverse can consume 90% less fuel than accessing the site through aircraft-supported operations. Traverse vehicles also allow for the potential use of alternative fuels, which may further increase sustainability. By assessing logistical challenges, this study demonstrates a feasible, safe and low-impact method to access Greenland’s oldest ice outcrop and other secondary science sites within the region.
Acknowledgements
This report is a contribution of the Traverse Science Planning Group organised by GEUS. The Traverse Science Planning Group can be reached at traverse@geus.dk. This work supports the fieldwork activities of Greenland Climate Network (GC-Net) funded by the Danish Ministry of Climate, Energy and Utilities. We thank Erich Osterberg (Dartmouth College), Andreas Rønne Stokholm (Technical University of Denmark), Beata Csatho (State University of New York) and H. Jay Zwally (retired) for sharing knowledge of some previous ice-sheet traverses. We thank Henrik P.Ø. Lassen (Arctic Capacity/Sherp Denmark) for providing information about the Sherp 1200N. We thank Sune Tamm (Arctic Trucks) for providing information about the Arctic Truck 6×6. We thank the three reviewers, Scientific Editor Harold Lovell and Editor in Chief Catherine Jex for their detailed comments, which substantially improved the paper.
Additional information
Author contributions
Conceptualisation: W.C., N.B.K., R.S.F. and C.S. Analysis: D.F., G.L., A.L., E.B.N., P.H., A.R., A.S., R.S.F., K.K.K., J.A.M. and P.S. Data curation: P.S. Investigation: All authors. Visualisation: W.C., D.F., G.L., A.L., P.H., A.R., A.S., K.K.K., J.M. and R.S.F. Writing: W.C., N.B.K., D.F., G.L., A.L., P.H., A.R., A.S., J.A.M. and K.K.K. Administration: A.P.A., W.C. and N.B.K.
Additional files
A shapefile of the Pituffik to Warming Land traverse route described here is available in the online supplementary material associated with this report (Supplementary File S1; Colgan et al. 2025). https://doi.org/10.22008/FK2/OIP6L4
