 |
RESEARCH ARTICLE  |
The Kangâmiut dyke swarm in West Greenland: a new map and insights into their tectonic evolution
Abstract
This contribution presents a new map of the Palaeoproterozoic Kangâmiut dyke swarm in Central West Greenland. The map is based on publicly available aerial imagery, the scale and quality of which allowed for quick and efficient interpretation across a large area. The Kangâmiut dyke swarm has played a pivotal role in the identification and characterisation of the southern margin of the Nagssugtoqidian orogen. Change in dyke orientation from NNE-trending in the south to ENE-trending farther north is accompanied by increasing deformation in both dykes and host rocks. The zone where dykes and host rocks are totally parallelised defines the southern structural and metamorphic front of the Nagssugtoqidian orogen. We document variable changes in orientation of the dykes and their density to estimate the crustal extension accompanying dyke emplacement. The average width of the 123 dykes is 25 m (80% are <50 m). These dykes occur with an average frequency of 3.4 dykes per km and make up 6–11% of the outcrops. These data reveal subordinate groups of dykes with ESE and NE orientations and track regional changes. At present, their ages relative to the dominant NNE-trending swarm are not known. The swarm generally extends from south of Maniitsoq northwards to the Ikertooq shear zone; however, we identified features north of the Ikertooq shear zone, which we speculatively interpret to represent the northernmost occurrence of the Kangâmiut dyke swarm. The tectonic consequences of this interpretation – if correct – allow us to estimate the amount of shortening across the Ikertooq shear zone during the Nagssugtoqidian orogeny to be more than 150 km. If the other major tectonic boundaries in the orogen, including the Nordre Strømfjord shear zone, were the loci of similar shortening, the current extent of the orogen may represent only a fraction of pre-Nagssugtoqidian crust in Central West Greenland.
Citation: Sørensen et al. 2025: GEUS Bulletin 59. 8380. https://doi.org/10.34194/3cy30452
Copyright: GEUS Bulletin (eISSN: 2597-2154) is an open access, peer-reviewed journal published by the Geological Survey of Denmark and Greenland (GEUS). This article is distributed under a CC-BY 4.0 licence, permitting free redistribution, and reproduction for any purpose, even commercial, provided proper citation of the original work. Author(s) retain copyright.
Received: 08 Aug 2024; Revised: 10 Dec 2024; Accepted: 12 Dec 2024; Published: 04 Jul 2025
Competing interests and funding: The authors declare no competing interests.
This study received no funding.
*Correspondence: kaisoerensen@hotmail.com
Keywords: Kangâmiut dykes, Palaeoproterozoic, Nagssugtoqidian orogen, crustal shortening, West Greenland
Abbreviations:
CNO: Central Nagssugtoqidian orogen
DLC: Danish Lithosphere Centre
GGU: Grønlands Geologiske Undersøgelse
ISZ: Ikertooq shear zone
NNO: Northern Nagssugtoqidian orogen
SNO: Southern Nagssugtoqidian orogen
SNF: Southern Nagssugtoqidian Front
TD: total depth
Edited by: Thomas Find Kokfelt (GEUS, Denmark)
Reviewed by: Jeroen van Gool (Independent researcher, Denmark); Kyle Mayborn (Western Illinois University, USA)
1. Introduction
In the preface to their 1961 Geological Survey of Greenland Bulletin, Arne Noe-Nygaard and Hans Ramberg described the pioneering work in the Precambrian basement of West Greenland. They wrote: “In 1946 the geodetic survey was able to deliver us blue-prints of the newly made 1:250 000 scale map of the Holsteinsborg area, and consequently we set to work here, this region being as suitable as anything else on the west coast.” (Noe-Nygaard & Ramberg 1961, p. 4). That report contained the first extensive map of the Precambrian rocks between Qeqertarssup Tunua in the north (69°N) and the Nuuk region in the south (63°45N).
The region chosen turned out to be so much more than ‘suitable’ because it contains a swarm of basic dykes – the Kangâmiut dykes – which become increasingly deformed and metamorphosed when traced from the south towards the north and NE through Kangerlussuaq. This remarkable feature had already been described by Hans Ramberg as early as 1948 based on fieldwork in 1946–1947. He wrote: “When one is sailing in through the long fiord Kangerdlugssuaq, it is amazing to see how the originally ‘young’ cross-cutting Kangâmiut diabases (Fig. 2) gradually begin to take part in the plastical deformation of the gneisses” (Ramberg 1949, p. 316). He further described how the diabases are folded, recrystallised into amphibolites, affected by metasomatism and broken into large boudins.
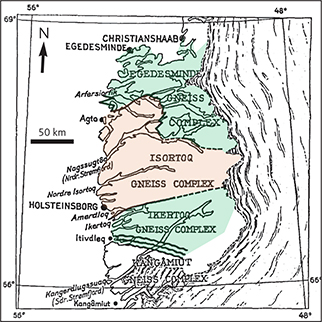
Fig. 1 Original overview map of the Nagssugtoqidian from Ramberg (1949), with their place name spellings, showing the proposed subdivision of the Precambrian rocks between Kangaamiut (Kangâmiut in the figure) and Qasigiannguit (Christianshaab in the figure) in West Greenland. The Isortoq gneiss complex is in granulite facies, while the adjoining Ikertoq and Egedesminde gneiss complexes are in amphibolite facies. Slightly modified from Ramberg (1949).
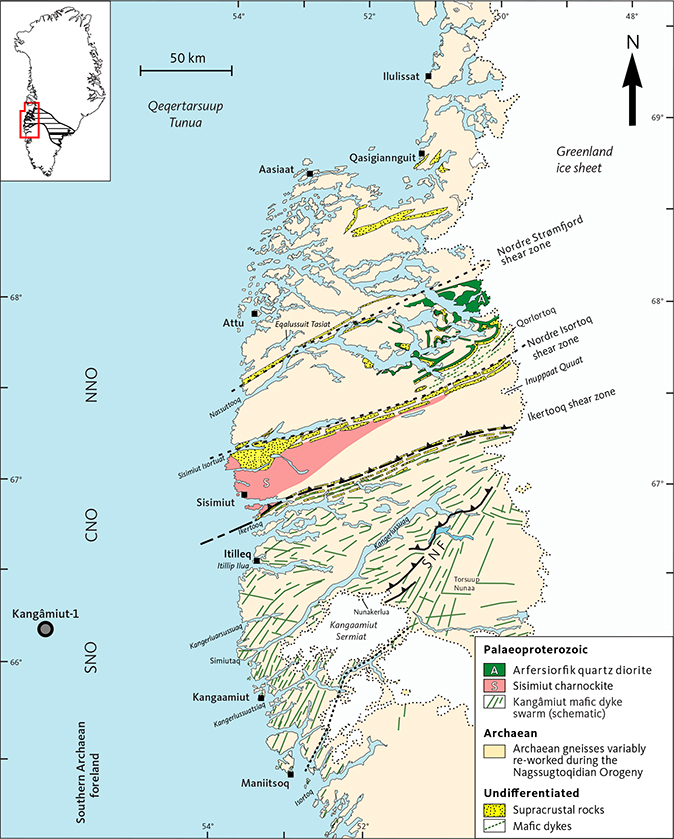
Fig. 2 Simplified geological map of West Greenland, showing the internal subdivisions of the Nagssugtoqidian orogen (SNO: southern Nagssugtoqidian orogen, CNO: central Nagssugtoqidian orogen, NNO: northern Nagssugtoqidian orogen, after Marker et al. 1995). The Kangâmiut dykes investigated in this study occur from 65°10´N to 67°45´N. North of Itillip Ilua and the Southern Nagssugtoqidian Front (SNF), country rocks are largely Archaean orthogneisses and minor supracrustal rocks, which are all variably to completely reworked during Nagssugtoqidian orogenesis. The thin stippled line at Kangaamiut Sermiat traces the Aujassoq shear zone (“Aujassoq-Evighedsfjord shear belt” of Allaart & Jensen 1978). ‘Kangâmiut-1’ is the location of the well drilled in 1976 by the French oil company Total. Black triangles: thrust faults. Inset map shows the extent of the Nagssugtoqidian orogen across southern Greenland. Slightly modified from Korstgård et al. (2024) and includes information from Escher (1971) and Allaart (1982).
The term “Nagssugtoqidian” also made its first appearance in Ramberg (1949) in his description of the Nassuttooq fjord as long, branched and situated in the middle part of the folded chain of post-Kangâmiut diabase age. In the fjord, he described “the most excellent exhibitions of folds and other tectonic deformations” and designated this Precambrian folded chain the “Nagssugtoqides” (Ramberg 1949, p. 318).
Ramberg (1949) divided the “Nagssugtoqides” into three main complexes: the “Egedesminde”, the “Isortoq” and the “Ikertoq” gneiss complexes (Fig. 1), according to their degree of regional metamorphism. The central Isortoq gneiss complex is located in granulite facies, and the bordering Ikertoq and Egedesminde gneiss complexes are located in amphibolite facies of presumed Nagssugtoqidian age.
It is clear that the Kangâmiut dykes played a crucial role in the early identification of what we now call the Nagssugtoqidian orogen and in the unravelling of the nature of the border zone between the ‘older’ southern block and the ‘younger’ northern complexes.
In this contribution, we briefly review the previous research in the Nagssugtoqidian in West Greenland, and present the results of a recent photo interpretation effort of the Kangâmiut dyke swarm. We discuss their orientation and thickness variations, and finally, present a model for the present geographic distribution of the dykes.
1.1. Early work on the Nagssugtoqidian orogen
In 1965, the Geological Survey of Greenland (Grønlands Geologiske Undersøgelse, GGU) started systematic reconnaissance mapping in the area around and north of Kangerlussuaq with the aim of completing the earlier coastal mapping reported in Noe-Nygaard & Ramberg (1961). Escher (1966) found a major tectonic discordance between the amphibolite facies rocks of the Ikertoq gneiss complex and those of the granulite facies of the Isortoq gneiss complex (Fig. 1). This zone of faulting and shearing was interpreted as a NW-dipping thrust zone, now termed the Ikertooq shear zone (ISZ). This reconnaissance work led to the publication of the 1:500 000 geological map covering the Kangerlussuaq–Nuussuaq region (“Søndre Strømfjord–Nugssuaq region”, Escher 1971) and the recognition of the alternating pattern of ‘linear or straight belts’ and areas without a strong preferred orientation (Escher 1970) which is a key characteristic of the Nagssugtoqidian of West Greenland. Reconnaissance in the area south of 66°45’N (see Fig. 2) was carried out in the late 1970s and included a major part of the Kangâmiut dykes (see Allaart & Jensen 1979) and led to the subsequent publication of the 1:500 000 geological map covering Sioqqap Sermia – Kangerlussuaq (“Frederikshaab Isblink – Søndre Strømfjord”; Allaart 1982). Along with more recent maps, including the compilation by Garde & Marker (2010), these two maps are now part of the seamless 1:500 000 geological map of Greenland (Pedersen et al. 2013) and depict the extent of the Kangâmiut dyke swarm including the generally held view of a northern limit of the swarm along the ISZ.
In addition to the work by GGU, two projects by Aarhus University (Denmark) and the University of Liverpool (UK) and a multi-institution project by the Danish Lithosphere Centre (DLC) led to several detailed studies of Nagssugtoqidian geology. A major result of the work by the Aarhus group, initiated in 1965 by Bondesen (1966), was the recognition of a major shear zone along the Nassuttooq fjord (Bak et al. 1975a). The completed 1:100 000 “Agto” (Attu) map sheet 67 V.1 Nord (Olesen 1984; location in Fig. 3) was another major result (Olesen et al. 1979). As a result of the DLC work, the 1:100 000 Ussuit map sheet 67 V.2 Nord was published (van Gool & Marker 2004; location in Fig. 3). A tectonic model of the Nagssugtoqidian orogen resulting from the work by DLC is summarised in van Gool et al. (2002) and van Gool & Marker (2007).
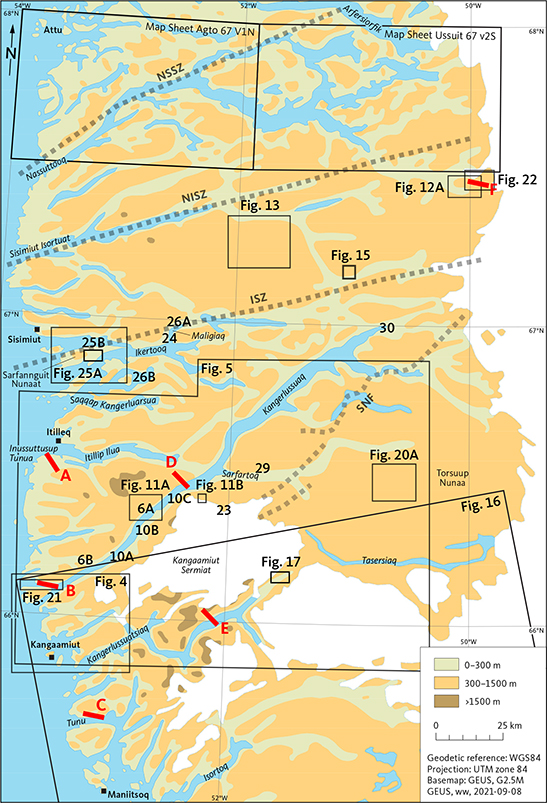
Fig. 3 Index map showing the locations of figures, photos and place names cited in the text. Extents of aerial photos and maps are shown with the prefix ‘Fig’. Location of field photographs and other displays are shown by the figure number. Red lines: trends and lengths of transects A–F are shown schematically. Grey stippled lines: simplified major tectonic boundaries.
The Liverpool Precambrian Boundary Programme (Watterson 1974) aimed to determine the displacements and history of the boundary region (Watterson 1974, p. 33) and focused on the western part of the ISZ (Fig. 2). A joint paper by the Aarhus Attu mapping group and the Liverpool group discusses tectonic implications of the shear zones observed in the Nagssugtoqidian (Bak et al. 1975b).
In an important paper, Kalsbeek et al. (1987) suggested, based on isotopic and elemental geochemistry, that the Arfersiorfik quartz diorite in the eastern part of the Nassuttooq region (see Fig. 2) originated in a subduction-related oceanic arc setting, thus introducing plate tectonic concepts in earnest into the interpretation of Nagssugtoqidian geology. A more detailed tectonic model involving the Arfersiorfik quartz diorite and accompanying lithologies in the same area was proposed by van Gool et al. (2002). More recently Glassley et al. (2007, 2014) presented evidence of ultra-high pressures in rocks near Nassuttooq.
1.2. Previous research on the Kangâmiut dykes
The results of the first phase of regional mapping were compiled in 1956 and published in two map sheets, scale 1:500 000 (Noe-Nygaard & Ramberg 1961). In these maps, observations of dykes and other rocks and structural features were generally restricted to coastal areas. Figure 4 shows a detailed view of the original map covering the southern part of the area reported by Noe-Nygaard & Ramberg (1961) and illustrates the general density and orientation of the dykes.
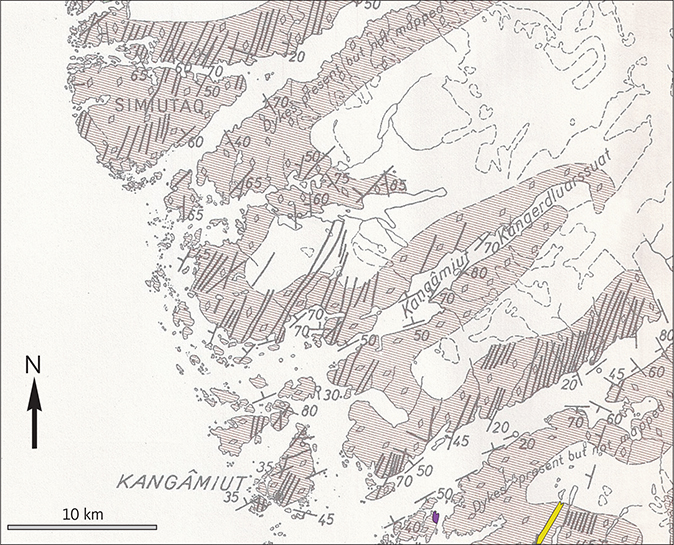
Fig. 4 Original reconnaissance map from Noe-Nygaard & Ramberg (1961), with their place name spellings. Location in Fig. 3. Diagonal shading with diamond symbols: Agmatitic hypersthene-gneiss and pyroxene-gneiss of enderbitic to quartz-dioritic composition. Black lines: observed Kangâmiut dykes. Purple shading: Ultrabasic rocks (lower right of map). Yellow shading: Granulite facies metasediments (lower right of map). Slightly modified from Noe-Nygaard & Ramberg (1961).
The continued reconnaissance mapping by GGU in the 1960s and 1970s of the area between Sioqqap Sermia (62°30’N) and Kangerlussuaq (66°45’N) led to the publication of a 1:500 000 map (Allaart 1982), which was the first depiction of the Kangâmiut dykes as a regionally continuous swarm with a consistent geometry.
The reconnaissance mapping combined with interpretation of aerial photos also led to the publication of the seminal paper on the reorientation of the Kangâmiut dyke swarm by Escher et al. (1975). Their generalised map is reproduced here (Fig. 5). A sharp transition from undeformed to deformed and re-orientated dykes is described to occur along a continuous boundary between the Kangaamiut Sermiat ice cap and the Greenland ice sheet and this was termed the ‘main Nagssugtoqidian boundary’ (here labelled SNF in Fig. 5). In contrast, it was noted that a much more gradual transition is seen W and NW of Kangaamiut Sermiat.
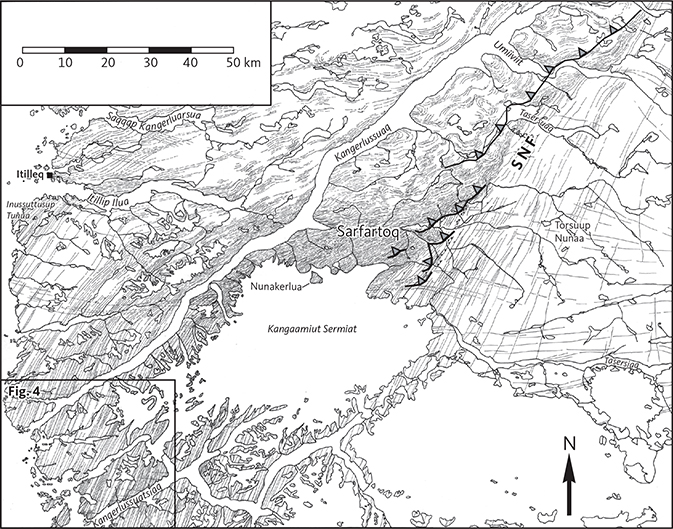
Fig. 5 Original map of Kangâmiut dykes from Escher et al. (1975). Location in Fig. 3. The frame in the SW corner shows the area covered by Fig. 4. SNF: Southern Nagssugtoqidian Front. The trace of the SNF from Escher et al. (1975) and mapping by Hageskov (1995a, 1995b) and Olsen (2000). Modified from Korstgård et al. (2024).
It was observed during the early reconnaissance that in addition to the dominant NNE-trending dykes that appear throughout the region, there appears another set of dykes, also deformed and metamorphosed during the Nagssugtoqidian (Escher 1970). These dykes trend between E and ESE and were referred to as ‘ESE dykes’. For reasons described next, we use the term Kangâmiut dykes for both sets. Scattered dykes of trends deviating from the NNE and ESE directions occur throughout the region but are not numerous.
As part of the Liverpool project, detailed mapping of dykes was carried out by Jack (1978) in an area near Inussuttusup Tunua (Fig. 3) and by Nash (1979) in an area around the mouth of Itillip Ilua (Fig. 3). Also, as part of the Liverpool project, Korstgård (1979, 1980) mapped dykes based on aerial photos and field work in the Ikertooq to Itilleq region (Fig. 3), thus extending the Escher et al. (1975) map (Fig. 5) northwards to include the dyke geometry in the ISZ and its vicinity. Korstgård (1979, 1980) also described the metamorphic and structural changes of the dykes along a transect from Itillip Ilua to Maligiaq in inner Ikertooq fjord (Fig. 3). Along this transect, a transition from low amphibolite facies in the south to granulite facies in the north was documented.
Adjacent to the ‘main Nagssugtoqidian boundary’ of Escher et al. (1975, p. 160), the authors described a transition zone, 10–20 km wide characterised by the presence of “many shear belts affecting both the east–west and Kangâmiut swarms.” In these belts, Escher et al. described brown granulite facies gneisses retrogressed to pale biotite gneisses, and dolerites converted to amphibolites. It is worth emphasising here, that the granulite facies gneisses are of Archaean age, whereas the retrogression to amphibolite facies and the metamorphism of the dykes are the result of Palaeoproterozoic (Nagssugtoqidian) events.
The main Nagssugtoqidian boundary NE of Kangaamiut Sermiat (Fig. 5) was investigated during the DLC project. Fieldwork in 1994 seemed to indicate that the southern part was “… formed by a few NW–NNW-dipping ductile thrusts arranged in a sinistral en echelon array…” Hageskov (1995b, p. 14). Following fieldwork in 1995, Hageskov (1995a, p.10) concluded that the southern Nagssugtoqidian boundary zone includes at least three “en echelon thrusts which from north to south are named the Taserssuaq, the Paradise and the Sarfartoq thrust.” Hageskov also suggested that the individual thrusts cannot have accommodated significant displacement, and observed that some granitic rocks near the Greenland ice sheet occurred within the footwall as well as within the hanging wall.
As a part of the DLC project, Olsen (2000) mapped the vicinity of the Sarfartoq to further refine the delineation of the Nagssugtoqidian ‘structural front’ in that area and showed how multiple thrust segments could be identified. Thrusts mapped by Hageskov (1995a, 1995b, 1997, 1998) and Olsen (2000) are shown in Fig. 5.
Engström & Klint (2014) mapped areas near the head of Kangerlussuaq and while their emphasis was on lineaments of potential interest for the hydraulic properties of the gneisses, they did describe the ‘Nagssugtoqidian structural front’ to be a complex array of thrust faults.
Across the Nagssugtoqidian boundary from south to north, the NNE dykes show a clockwise rotation, whereas the ESE dykes display an anti-clockwise reorientation. This observation was used by Escher et al. (1975) as a tool to identify an overall NNW–SSE-orientated direction of shortening during deformation (Escher et al. 1975, Fig. 7). The intrusive relations of the two sets of dykes in the Inussuttusup Tunua area were described by Escher et al. (1975, 1976) and Jack (1980) who speculated that the two swarms were emplaced syn-kinematically along conjugate shear fractures with the NNE and ESE dykes being largely contemporaneous (Watterson 1974; Escher et al. 1976). In contrast, Korstgård et al. (2024) and the present contribution envisage an overall extensional regime for the emplacement of the Kangâmiut dykes.
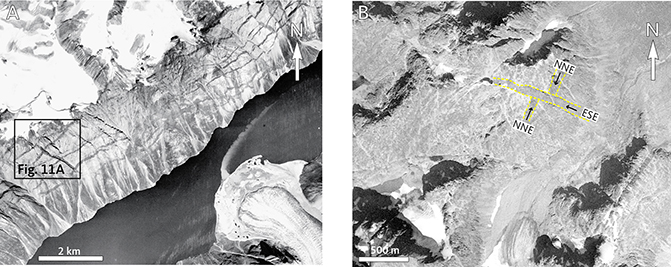
Fig. 6 Aerial photographs of Kangâmiut dykes. Locations in Fig. 3. A: Aerial photo F1946. Kangâmiut dykes hosted by amphibolite facies gneisses in Kangerlussuaq c. 57 km from the mouth of the fjord. Width of the fjord SW of the delta lobe is 2.4 km. The frame indicates the extent of the outcrop shown in Fig. 11A. B: Aerial photo E3116. Kangâmiut dykes in granulite facies host gneiss showing a clear intersection between NNE and a later ESE dyke, north shore of Kangerlussuaq, 20 km from the mouth of the fjord. The ESE-trending dyke is 80 m wide.
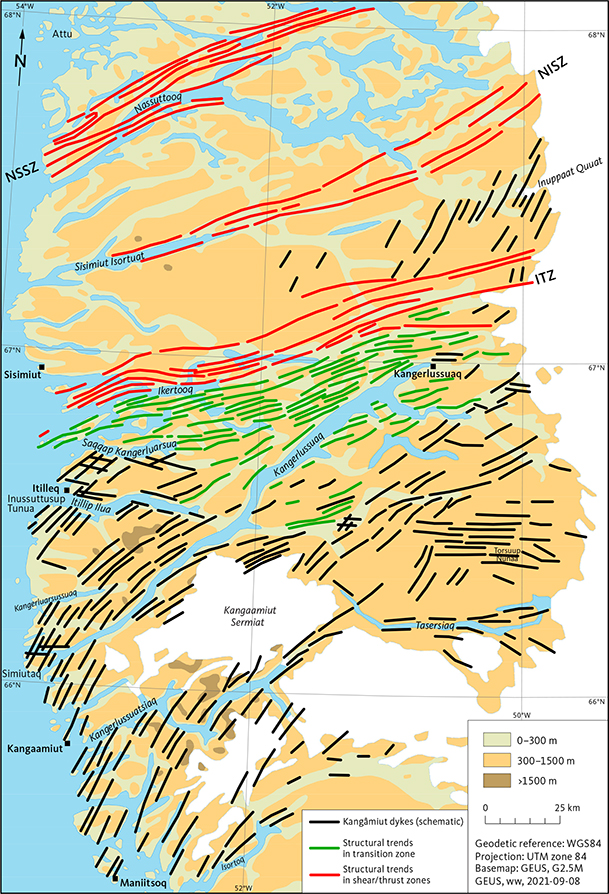
Fig. 7 Major Nagssugtoqidian structures and generalised trends of dykes based on interpretation of aerial photos. This map is a simplified version of Supplementary File S1. Red lines: structural trends in the major shear and thrust zones. Black lines: general trend of dykes where observable as continuous, intrusive bodies. Green lines: gneiss trends in the area south of the Ikertooq shear zone (ISZ), where gneiss structures and highly deformed dykes are parallelised. NSSZ: Nordre Strømfjord shear zone. NISZ: Nordre Isortoq shear zone.
In the region between Maniitsoq and Itillip Ilua (Fig. 2), Mengel et al. (1996) distinguished three sets of dykes based on mutual intersections and inferred that in this area, the E–W dykes are oldest, NNE-trending dykes are younger, and the main swarm of NNE–NE-trending dykes is the youngest. However, the only available age determinations are from the youngest dykes (see Section 1.3), so how much the emplacement of these sets are separated in time remains unknown.
The highest density of Kangâmiut dykes is found across a c. 140 km section from the head of Kangerlussuatsiaq to the mouth of Itillip Ilua (Fig. 5) where, according to Escher et al. (1975), more than 100 dykes wider than 15 m occur and represent a crustal widening of 2–3% (Escher et al. 1975, p.158). Within the central part of the NNE swarm, Allaart & Jensen (1979) found a dyke density reaching up to 7% between Kangaamiut and the mouth of Kangerlussuaq. To address these significantly varying densities, we have also assessed dyke densities in a few key locations within the main swarm (Section 3.2).
The western limit of the Kangâmiut dyke swarm is clearly not exposed, but a petroleum exploration well drilled c. 100 km west of the mouth of Kangerlussuaq by the French oil company Total in 1976 (66°10N, 56°14W, Fig. 2) may well provide some constraints. The Kangâmiut-1 well was drilled to a subsea depth of 3874 m in 180 m deep water. Among the material collected, were what appeared to be remnants of a Kangâmiut dyke, recovered near total depth (TD). Sørensen (1977) described the material collected, and in the report noted that “with the exception of subcalcic clinopyroxene all of the primary features of the Kangâmiut dykes on-land are met with on this site, but on-land many dykes are likewise without primary pyroxene. The full range of secondary features, except for the most extreme, secondary deformation is represented within the material, but the overall picture is of an undeformed Kangâmiut dyke, both between levels 3874 and 3849 and the fragments in the side wall cores. The metamorphic grade of the dykes indicates low amphibolite facies, with bluish green amphibole and secondary plagioclase of oligoclase composition coexisting with epidote” (Sørensen 1977, p. 34). The potential significance of this observation is discussed further in Section 4.
Despite the common assumption that Kangâmiut dykes do not occur north of the ISZ, there are many published accounts of mafic dykes in this area with preserved discordances that bear a strong resemblance to Kangâmiut dykes. A few of these occurrences are summarised next.
Several examples were documented across the Attu (Agto) map sheet covering the western half of Nassuttooq (Fig. 3), including those occurring in the vicinity of Attu (Figs 2, 3) and south of Eqalussuit Tasiat described by Sørensen (1970, 1971) and Glassley & Sørensen (1980) and those centrally in the map sheet north of Nassuttooq (Mengel 1983). During the mapping in the area immediately N and NE of Attu, Árting (2004) encountered several mafic metadykes forming a minor ESE-trending swarm.
Farther east, metadolerites have also been identified in a gneiss panel in the Nordre Strømfjord shear zone exposed in inner Arfersiorfik fjord (Sørensen et al. 2006, fig. 3a). These are affected by Nagssugtoqidian metamorphism but locally preserve intrusive relationships. In gneisses in the Qorlortoq valley (Fig. 2), van Gool & Marker (2007) describe the presence of numerous dykes; however, later work (McIntyre et al. 2021) notes that despite the field similarities, trace element compositions suggest that the Qorlortoq dykes are likely unrelated to the Kangâmiut dykes and are presumably Archaean in age.
Detailed descriptions of field occurrence, geochemistry, petrology and petrogenesis of the Kangâmiut dykes are presented in several papers, among them Windley (1970), Jack (1978), Korstgård (1979, 1980), Zeck & Kalsbeek (1981), Bridgwater et al. (1995), Mengel et al. (1996), Mayborn (2000), Cadman et al. (2001), Mayborn & Lesher (2004, 2006), Mayborn et al. (2008) and most recently by Korstgård et al. (2024).
1.3. Regional geological framework
The Nagssugtoqidian orogen can be traced from west to east across Greenland (e.g. Bridgwater & Gormsen 1968; Bridgwater 1976; Escher & Watt 1976; Bridgwater et al. 1989; Kalsbeek 1989; van Gool et al. 2002; review in Nutman et al. 2008; Kolb et al. 2016) and is part of a collage of Palaeoproterozoic orogens forming the northern margin of the Archaean North Atlantic craton (e.g. Bridgwater et al. 1973). Farther west, in northern Labrador, the Palaeoproterozoic Torngat orogen occurs along the western margin of the Archaean Nain craton (e.g. Korstgård et al. 1987; Hoffman 1989). East of Greenland, the Palaeoproterozoic Laxfordian orogen in NW Scotland borders the Archaean Lewisian complex (e.g. Park 2022). The similarities between these coextensive Palaeoproterozoic orogens in Labrador, Greenland and Scotland have been pointed out by many (e.g. Bridgwater et al. 1989; Park 1995; Mason & Brewer 2004; St-Onge et al. 2009).
Based on the work outlined in sections 1.1 and 1.2, the following framework describes the Nagssugtoqidian orogen in West Greenland in terms of structural, metamorphic and geochronological evolution of its component parts.
Marker et al. (1995) subdivided the orogen into the southern, central and northern Nagssugtoqidian orogen (SNO, CNO and NNO, respectively, Fig. 2). These are broadly similar to Ramberg’s (1949) ‘Ikertoq’, ‘Isortoq’ and ‘Egedesminde’ gneiss complexes (Fig. 1), but are separated by major tectonic breaks of shear or thrust zones. Each subdivision is composed of Archaean rocks variably deformed and metamorphosed during Nagssugtoqidian orogenesis and each also contains layers of supracrustal rocks of both Archaean and Palaeoproterozoic ages (Marker et al. 1999). As mentioned in Section 1.2, Kangâmiut dykes are generally reported to be restricted to the SNO and the southern Archaean foreland.
The southern limit of the SNO is the ‘main Nagssugtoqidian boundary’ described in Section 1.2, but the term ‘Southern Nagssugtoqidian Front’ (SNF) is preferred here. This marks the zone north of which the Kangâmiut dykes and their host gneisses are deformed and rotated into the penetrative ENE structural grain characteristic of the Nagssugtoqidian (Figs 2, 5). The northern boundary of the SNO is the northerly-dipping ISZ, in which Kangâmiut dykes and their host gneisses are deformed into parallelism. This zone separates granulite facies in the north from amphibolite facies rocks in the south and contains metasedimentary panels, strongly deformed along with the gneisses.
The CNO extends northwards up to the Nordre Strømfjord shear zone (Bak et al. 1975a), a major transcurrent structure extending from the coast to the Greenland ice sheet. The CNO includes the central Nordre Isortoq shear zone, which is characterised by several large metasedimentary packages. The CNO contains two juvenile calc-alkaline intrusive bodies, the Arfersiorfik quartz diorite in the east and the Sisimiut charnockite in the west (Fig. 2). Both have been dated at c. 1.9 Ga and are interpreted to represent arc magmatism related to subduction during continent convergence prior to collision (e.g. Kalsbeek et al. 1987; Glassley et al. 2010).
To the north, the NNO is not as strongly reworked as the SNO and CNO. Its northern boundary is poorly defined as a gradual transition to the Rinkian fold belt farther north (e.g. Escher & Pulvertaft 1976; Grocott & Pulvertaft 1990; van Gool & Marker 2007; Grocott & McCaffrey 2017; Grocott et al. 2023).
Most of the Archaean gneisses give published ages around 2.8 Ga and there is geochronological evidence of a major crust-building episode at 2870–2810 Ma and subsequent reworking at 2790–1680 Ma (Kalsbeek & Nutman 1996; Connelly & Mengel 2000; Connelly et al. 2006).
Zircons from Kangâmiut dykes intruding Archaean rocks (near Kangaamiut and Itillip Ilua, Fig. 2) have been dated to 2045–2021 Ma (Kalsbeek & Nutman 1996; Nutman et al. 1999; Connelly et al. 2000; Nilsson et al. 2019).
The high-grade processes associated with Nagssugtoqidian orogeny, specifically collision, thrusting and transcurrent shearing, occurred c. 1870–1780 Ma. Deformation and thrusting across the SNF occurred during the earlier part of this interval, while shearing and thrusting in the main tectonic zones in the orogen took place 50–100 Myr later (e.g. Korstgård et al. 2024). It is notable, that related arc magmatism (Kalsbeek et al. 1987) preceded the early phases of collision by up to c. 50 million years (Kalsbeek & Nutman 1996; Connelly et al. 2000; van Gool et al. 2002). The extent of Nagssugtoqidian metamorphic overprints in the southern foreland has been discussed by Mengel et al. (1995, 1996), Mayborn & Lesher (2006) and Korstgård et al. (2024).
2. New mapping
2.1. Data
The primary source of data for the new map of the Kangâmiut dykes is a collection of aerial photos from the P0886 survey available from the Greenland Portal ( https://maps.greenmin.gl/; GEUS 2023). The aerial survey was acquired in 1985 from high altitude (14 000 m) and presented at 1:150 000 scale. The availability of these images has made it possible to investigate large areas within a more reasonable time frame than would have been possible with the pre-existing aerial photos in 1:40 000 scale. The map produced as part of the Liverpool project (Korstgård 1979, fig. 1) was based on the interpretation of the 1:40 000 data set and used c. 200 photos to map an area of c. 4000 km2, while the new map presented here based on the 1:150 000 data set involved interpretation of c. 125 photos to cover an area of c. 30 000 km2. The scale cited for the aerial surveys applies to the scale of the contact copies made from the photographic plates. The 1:40 000 scale aerial photos were also used by Escher et al. (1975) in their mapping (Fig. 5).
In addition to these aerial photos, 1:20 000 EOX Sentinel-2 cloudless satellite images (EOX 2018) and Google Earth satellite images ( https://earth.google.com) were used. These images are in colour, which can be helpful in the identification of dykes. While the available EOX scenes are of good quality and cover the entire area, they are of restricted resolution. The Google Earth scenes are of variable quality, but in some areas, they are both of good quality and better resolution than the EOX data.
Mapping was done by unaided visual inspection, without using a stereoscope. The transfer of observations from the aerial photos to the map was greatly facilitated by the availability of high quality, shaded topographic maps with many lakes and rivers shown (available on the Greenland Portal). All aerial photos shown here are from the P0886 survey and are referred to by their serial numbers from the Greenland Portal, without the prefix ‘P0886’.
2.2. Mapping objectives
The photo interpretation strategy follows that employed in Korstgård (1979, 1980), in which two linear map features were targeted, both of which were confirmed by field observations where possible. One feature is lineaments that reflect map traces of gneiss and the second feature is mafic dykes. These are especially recognisable where they occur as individual discordant dykes in less deformed areas but can be harder to distinguish in strongly deformed zones where they are parallel with the dominant gneissic structures. Dykes hosted by the darker granulite facies rocks are typically less distinct than those in lighter amphibolite facies gneisses (e.g. Figs 6A, B). In addition, in many inland areas, the degree of exposure is generally poor and here, dykes are more difficult to distinguish.
In the main dyke swarm, where major dykes occur at a typical frequency of c. 3 per km, only a selection of dykes has been mapped, while outside the main swarm ‘coverage’ is higher. Combined with the highly varying nature of exposure and quality of images, this means that the map shows the structural trends of the dykes, not their varying density or thickness.
The results of this mapping are shown in full at scale 1:500 000 in Supplementary File S1 and a simplified version, scaled down for publication here, is shown in Fig. 7. The extent of the dykes has been subdivided into 12 areas (Fig. 8), in which Areas 1–5 represent the general south to north changes in the dyke swarm, while the remaining areas illustrate the slightly more complex variations east and south of Areas 1–5. The orientation data collected during this work are summarised in rose diagrams for each area (Fig. 8). Azimuths of dykes are grouped in 10-degree bins for each area and lengths were summed and represented as percentages of cumulative length.
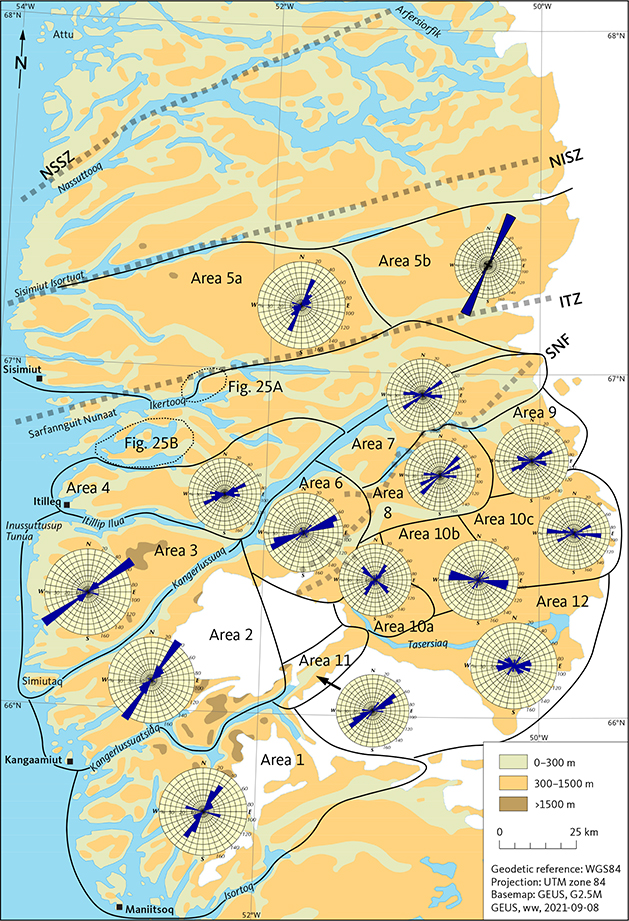
Fig. 8 Map showing the extent of Areas 1–12 with rose diagrams of dyke orientations for each area. Grey stippled lines: simplified major tectonic boundaries. NSSZ: Nordre Strømfjord shear zone, NISZ: Nordre Isortoq shear zone, ISZ: Ikertooq shear zone, SNF: Southern Nagssugtoqidian Front.
3. Description of the dyke map
The area studied covers the central and southern part of the Nagssugtoqidian orogen along with its southern foreland (Figs 2, 7, 8). From south to north, the Kangâmiut dykes are progressively deformed and re-orientated to variable degrees: in the southern Archaean foreland the dykes occur as steeply inclined, NNE-striking, little to moderately deformed continuous bodies. The mapping reported here speculates that dykes with similar geometry occur north of the ISZ in the area shown in Fig. 7 (see Section 3.1.1).
Within the ISZ (Fig. 2), strongly deformed dykes occur in 100–1000 m wide panels of gneisses interleaved with metasediments (10–100 m) in which no dykes are found (see Section 3.3). Throughout the SNO, the magnitude of deformation is highly variable. In this study, we call this the ‘transition zone’. Note that this is quite different from the transition zone defined by Escher et al. (1975, Fig. 2).
3.1. Dykes in the southern foreland and Area 5
3.1.1. Areas 1–4
In Areas 1–4, from south towards north (Fig. 8), and NE along Kangerlussuaq, a gradual change in orientation of the Kangâmiut dykes can be observed. From the southernmost coastal part of Area 1 to the coastal part of Area 3 just south of Itilleq (Figs 8, 9), the Kangâmiut dykes change strike from c. 30° to c. 55° (Fig. 9). The transition from NNE to ENE strike can also be seen from the mouth of Kangerlussuaq and farther NE along the fjord.

Fig. 9 Rose diagrams for Areas 1, 2, 3 and 4 demonstrating gradual clockwise change in orientation of the NNE dykes towards the ‘typical’ Nagssugtoqidian ENE trend. Location of Areas 1–4 shown in Fig. 8. Within each area, azimuths of dykes are grouped in 10-degree bins and lengths of dykes are summed and represented as percentages of cumulative length.
While most dykes in Areas 1, 2 and 3 are subvertical, NE along Kangerlussuaq, the change in strike is accompanied by a change in dip (Fig. 10). This was first described by Ramberg (1949), and likewise we interpret this gradual change in both strike and dip as a result of progressive deformation.
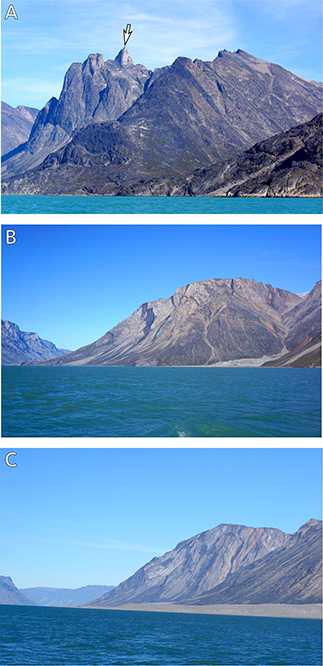
Fig. 10 Field photographs showing the three stages – A to B to C – in the progressive deformation of the Kangâmiut dykes as seen in outcrops along the south shore of Kangerlussuaq. Locations of photos in Fig. 3. A: The arrow points to the peak named ‘Stoppenålen’, the NW face of which (left side in image) is formed by a NNE dyke dipping c. 80° NNW. Viewing direction is ENE. B: Dykes strike NE and dip c. 50 degrees to NW. Viewing direction NE. C: Dykes strike ENE and dip c 45 degrees to the NNW. Viewing direction ENE. In all three photos, the peaks are 1000–1300 m above sea level. Photos courtesy of Simon Mose Thaarup, taken in 2016.
3.1.2. Age relations between NNE and ESE dykes
It has been suggested (e.g. by Escher et al. 1975) that the ESE dykes predate the main swarm of NNE–NE-trending Kangâmiut dykes. However, Escher et al. (1976, p. 533) observed that intersections showed no consistent age relations in the Inussuttusup Tunua area, suggesting that the two dyke sets are effectively of the same age. We have made similar observations, including an example of an ESE dyke cutting an NNE dyke (Fig. 6B), and localities where both relationships are seen (Fig. 11A, B), supporting the claim made for the Inussuttusup Tunua area (Escher et al. 1976). We interpret these observations to indicate that NNE and ESE dykes intruded broadly simultaneously, and use the term ‘Kangâmiut dykes’ to describe both sets of dykes. Age data reported in Section 1.3 came from the main NNE–NE-trending swarm, and at the time of writing none of the ESE dykes have been dated. Several studies (e.g. Hamling et al. 2010) have found that the emplacement of dykes can modify the stress field (especially the minimal compressive stress), such that later dykes preferentially intrude with different orientations. We think something similar may account for the varying orientation of the Kangâmiut dykes.
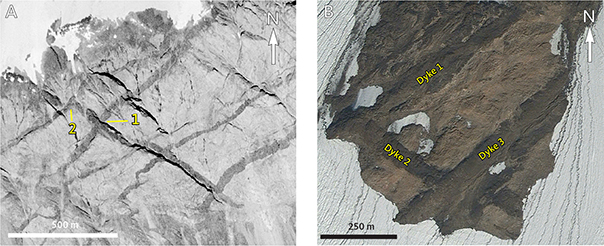
Fig. 11 Examples of mutually intersecting dykes. A: ESE-dyke cutting (at ‘1’) and being cut (at ‘2’) by NNE dykes. Cliff face is c. 1.3 km wide. Width of the widest dyke c. 50 m. Location in Figs 3, 6a. Source: Aerial photo F1946. B: ESE dyke (Dyke 2) cutting as well as being cut by NNE dykes (Dyke 1 and Dyke 3). Image is 1 km wide. Dykes are 50–60 m wide. Location in Fig. 3. Source: Google Earth.
3.1.3. Area 5
Kangâmiut dykes have not been mapped – or previously reported – in Areas 5a and 5b, north of the ISZ. This area is entirely underlain by granulite facies gneisses and supracrustal rocks with an overall ENE-trending structural grain (Figs 2, 7). In this study, we have identified what we interpret to be a population of mafic dykes in both Areas 5a and 5b (Figs 12 and 13). The orientation of these dykes is predominantly NNE in both areas with a small number of ESE dykes (Fig. 14), similar to the distribution in the foreland south of the ISZ. We speculate that these may be contemporaneous with the Kangâmiut dykes south of the ISZ. It should be emphasised at the onset of this discussion, that the presence and nature of these dykes have not been confirmed on the ground and are only interpreted from aerial imagery. A corollary of this interpretation is that this area between the Nagssugtoqidian Nordre Isortoq shear zone and ISZ (Fig. 2) locally escaped the penetrative deformation that characterises much of the CNO, which would require a radical re-interpretation of the nature and extent of Nagssugtoqidian deformation.
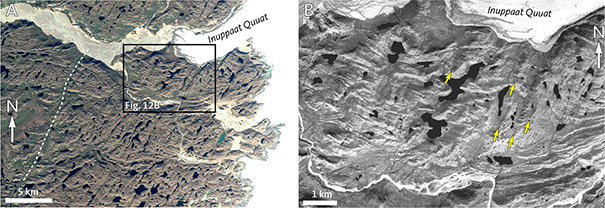
Fig. 12 Dykes in the eastern part of Area 5b (location in Fig. 8). These dykes are informally named the Inuppaat swarm after the Inuppaat Quuat glacier visible in the figure. A: Overview of the area. Stippled white line is a major lineament referred to in the text. EOX image. Box shows the extent of Fig. 12B. B: Aerial photo L0840 showing an enlarged view of several large dykes of the Inuppaat swarm. Dykes that are readily visible at this scale are indicated by arrows. Widest dyke is 120 m.
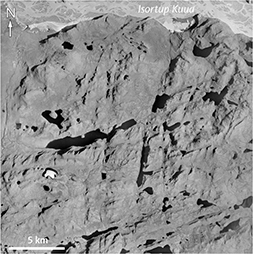
Fig. 13 N–NNE-trending dykes south of the meltwater plain Isortup Kuua. Location in Fig. 3. E–W width of image is 23 km. The nature of exposure does not permit an assessment of dyke density. Only in a few places can a clear colour contrast provide confirmation of a dyke, but terrain lineaments nevertheless suggest the occurrence of a substantial number of dykes. Source: Aerial photo H927.
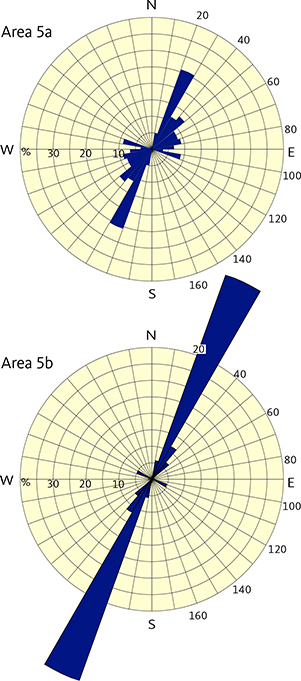
Fig. 14 Rose diagrams showing dyke orientations in Areas 5a and 5b. Locations in Fig. 8. Rose diagram construction described in Fig. 9.
It is noteworthy, that the westernmost interpreted dykes do not overlap with the eastern extent of the Sisimiut charnockite as would be expected and as shown on the 1:500 000 geological map (Garde & Marker 2010).
The NNE dykes in the eastern part of Area 5b (Figs 12 and 13) display a density comparable to that of the NNE-trending Kangâmiut dykes in the coastal area between Kangaamiut and Itilleq (Figs 2, 7). The densest central part of the Inuppaat swarm occurs in the area south and SW of the Inuppaat Quuat glacier (Fig. 12B) and extends as far as c. 30 km west of the ice margin (Figs 7, 12A), possibly coinciding with the prominent terrain lineaments visible on the EOX satellite data (shown on Fig. 12A). Dykes have also been interpreted immediately north of the ISZ (see example in. Fig. 15).
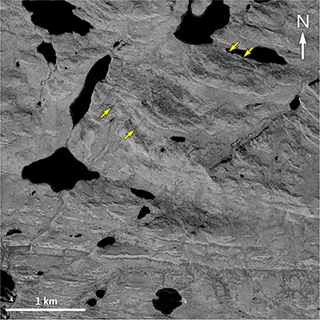
Fig. 15 NNE–NE-trending dykes immediately north of the eastern extension of the Ikertooq shear zone (ISZ). Limited colour contrast between dykes and gneisses suggests that host rocks are in granulite facies. A few dykes are indicated with arrows. The southern part of the image shows the E–W trend of the ISZ. Location in Fig. 3. Source: aerial photo K0349.
3.1.4. Areas 11, 12 and the Aujassoq shear zone
In this section, we consider the structural significance of the topographic lineaments that follows Maniitsup Sermilia (indicated by ‘1’ in Fig. 16), ‘Elephant Foot Valley’ (‘2’ in Fig. 16, informal name) and lake Tasersiaq (‘3’ in Fig. 16).
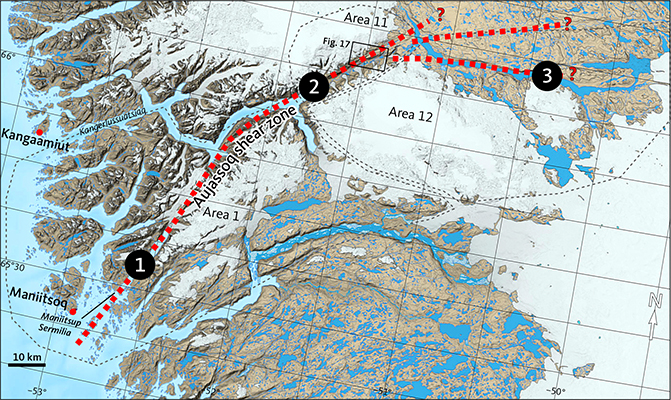
Fig. 16 Location of the Aujassoq shear zone (red dashed lines) relative to the areas and place names cited in the text. 1: Maniitsup Sermilia fjord. 2: Elephant Foot Valley (informal name). 3: lake Tasersiaq. The extent of Areas 1, 11 and 12 is also shown. Location of map shown in Fig. 3. ?: question marks indicate potential continuations of the Aujassoq shear zone.
A shear zone (described variably as a fault, mylonite zone or shear zone) forming a prominent topographic lineament from Maniitsoq through Area 1 and continuing into Elephant Foot Valley (Fig. 16) was observed during GGU reconnaissance mapping in 1976–1978 and was termed the Aujassoq fault zone (Allaart et al. 1977) or Aujassoq-Evighedsfjord shear belt (Allaart & Jensen 1979). It corresponds to the Evighedsfjord shear zone of Bak et al. (1975b). In this zone, granulite facies gneisses are retrogressed to amphibolite facies. Most of the zone of presumed most intense deformation is not exposed but it is visible locally along the shores of Maniitsup Sermillia and Kangerlussuatsiaq (Figs 16 and 17) and has been documented by notes on several field maps resulting from GGU’s reconnaissance mapping from the 1970s. The most complete trace of the Aujassoq shear zone, as we refer to the structure here, is depicted on the field compilation map in scale 1:100 000 by Allaart et al. (1977). The retrogression and associated fabric development in Maniitsup Sermilia (Fig. 16) was noted during reconnaissance by B. Windley (1964–1967).
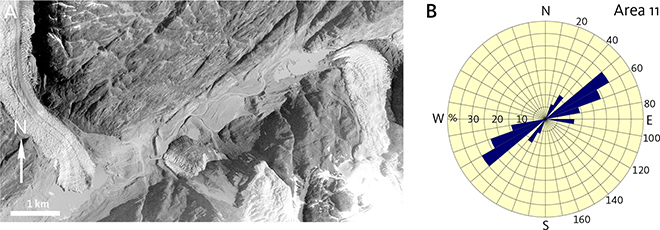
Fig. 17 Dyke orientations in Area 11. A: Aerial photo H0945 showing panels of straight, well-foliated and dyke-bearing gneisses centrally in ‘Elephant Foot Valley’. Extent of image shown in Figs 3 and 16. B: Rose diagram for dykes in Area 11. Location in Figs 8 and 16. Rose diagram construction described in Fig. 9.
Gneisses and dykes exposed along Elephant Foot Valley display a strong, valley-parallel structural grain (Figs 17A, B). On the Escher et al. (1975) map, the dykes are shown as occurring across the entire width of Elephant Foot Valley (Fig. 5). Our aerial photo observations suggest that the valley-parallel shear zone is up to 3 km wide.
The Aujassoq shear zone may continue into Area 12 (Figs 8, 16) as two or three strands striking ENE and E along and north of lake Tasersiaq (Fig. 16). The entire Area 12 is characterised by variably orientated dykes and our observations are mostly of rather short dyke segments due to the nature of exposure. The rose diagram (Fig. 18) therefore conveys the dyke geometry better than the map (Fig. 7). A major part of the identified dykes is the collection of ESE dykes that have been deformed into parallelism with the above-mentioned strands of the Aujassoq shear zone (Fig. 16). A few NNE dykes were also identified, but these were mainly outside the zones of deformation.
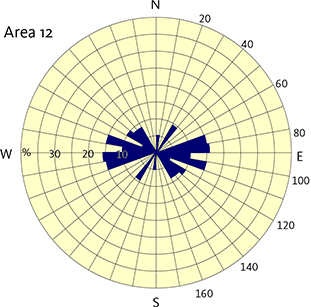
Fig. 18 Rose diagram of dyke orientations from Area 12 just south of lake Tasersiaq (location in Figs 8 and 16). Rose diagram construction described in Fig. 9.
Escher et al. 1975 (p. 159) noted that post-dyke shear belts occur in a few isolated places within the southern zone near the eastern part of lake Tasersiaq (Boellstorff 1968, referenced in Escher et al. 1975). They remarked that most of these shear zones are parallel with and adjacent to the wider dykes of both swarms and result in amphibolitization of dyke margins and retrogression of the country rock. In this area, garnets have been observed in the Kangâmiut dykes (e.g. Loewe et al. 1962) indicating the extent of Nagssugtoqidian metamorphic effects in the foreland region south of the SNF.
Despite the Aujassoq shear zone being a major structural feature, its relative age is currently not known with certainty. Our observations suggest an overall parallelism between dyke orientations and the structural grain in the host gneisses, whereas Allaart & Jensen (1979) describe the dykes as truncating the gneiss structures in this area. A possible scenario is that the shear zone is an original Archaean feature, and that this anisotropy partially controlled the orientation of the Kangâmiut dykes. The area was then thermally overprinted during the Nagssugtoqidian.
3.1.5. Area 10a
In Area 10a, north of Tasersiaq, both NW- and NE-trending dykes were identified (Fig. 19). These give rise to a set of distinct, dyke-parallel topographic lineaments. The relationship between these two sets of dykes is not known and no observations of dyke intersections were made.
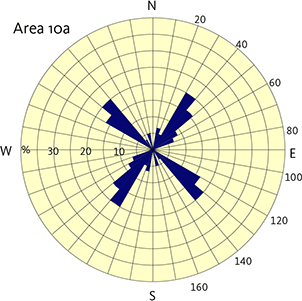
Fig. 19 Rose diagram of dyke orientations from Area 10a just east of Kangaamiut Sermiat. Location in Fig. 8. Rose diagram construction described in Fig. 9.
3.1.6. Areas 10b and 10c
In Areas 10b and 10c – part of the southern Archaean foreland – the ESE dykes are most abundant (Figs 7, 20) and form a minor swarm, which seems broadly parallel to the ESE dykes found farther west (north and NW of Tasersiaq, Fig. 5). This eastern part of the ESE swarm dominates close to Torsuup Nunaa (location in Fig. 3), and we will term it the Torsuup swarm. The dense part of the swarm is c. 15 km wide. Across this width we observed some 50 major dykes (along the N–S extent of Fig. 20A), thus indicating a dyke density comparable to that characterising the central part of the major NNE swarm farther west (e.g. Fig. 5).
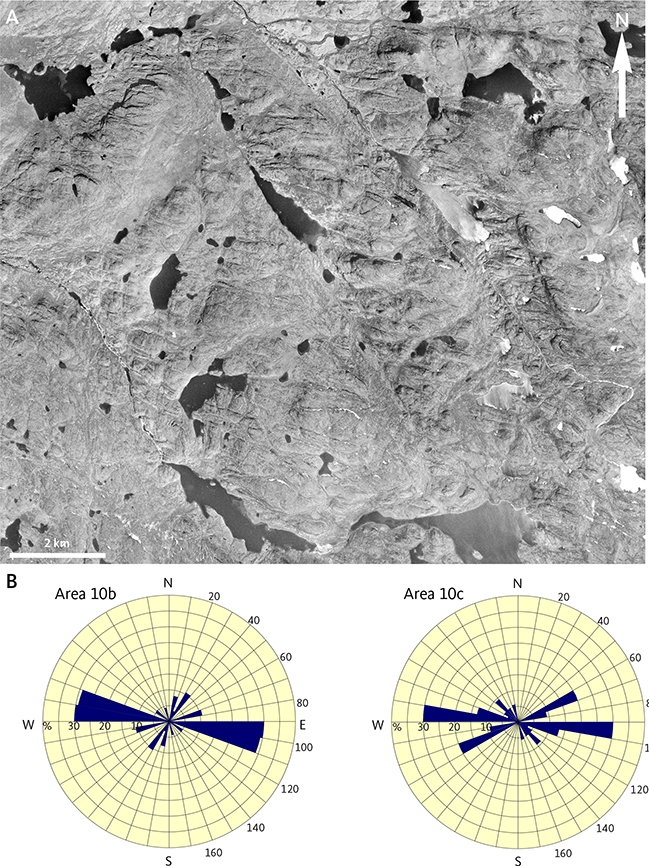
Fig. 20 The Torsuup swarm (informal name) of ESE dykes in Areas 10b and 10c. A: Aerial photo K1477 from the eastern part of Area 10b showing how dykes give rise to ESE-trending lineaments. N–S width of photo c. 13 km. Location in Fig 3. B: Rose diagrams showing dyke orientations in Areas 10b and 10c. Locations in Fig. 8. Rose diagram construction described in Fig. 9.
3.2. Dyke densities in the southern Archaean foreland and in Area 5
The overall highest density of NNE dykes is found across a c. 100 km transect from the head of Kangerlussuatsiaq to the mouth of Itillip Ilua fjord (location in Fig. 3), but as noted earlier, the detailed density – and its variation – has not been quantified (Escher et al. 1975; Allaart & Jensen 1979). Therefore, the subvertical dykes of the main swarm south of Itillip Ilua have been mapped and their widths measured along six selected transects perpendicular to the dominant dyke orientation in the southern Archaean foreland and in the easternmost part of Area 5b. Figure 3 shows the locations of the six transects (A–F) where the exposure and air photo quality were optimal. Results are also summarised in Table 1.
| Profile | Profile location details (Fig. 3) | Profile length (km) | Number of dykes | Cumulative width (m) | % of outcrop |
| A | Inussuttusup Tunua | 5 | 24 | 465 | 9.3 |
| B | Simiutaq (mouth of Kangerlussuaq) | 7 | 17 | 545 | 7.8 |
| C | Akuliaruseq | 8.5 | 31 | 485 | 5.7 |
| D | Kangerlussuaq (60 km from mouth) | 3 | 10 | 315 | 10.5 |
| E | Kangerlussuatsiaq (20 km from head) | 4 | 11 | 410 | 10.3 |
| F | Inuppaat Quuat | 6 | 30 | 595 | 9.9 |
| Total: | 33.5 | 123 | 2815 | 8.1 | |
| Average number of dykes per km = 3.7. Average width of dykes = 25 m. Location and orientation of profiles shown in Fig. 3. | |||||
3.2.1. Inussuttusup Tunua (transect A)
This area is the same as that covered by the map in Escher et al. (1976, fig. 2), where the focus is the relationship between dykes and shear zones. Along this transect (‘A’ in Fig. 3), 24 dykes wider than 10 m were recognised across a distance of 5 km. These 24 dykes make up 9.3% of the exposure (Table 1).
3.2.2. North of Simiutaq (transect B)
A total of 17 NNE dykes wider than 10 m occur along a distance of 7 km, as measured perpendicular to their strike (Fig. 21). In addition, a few ESE dykes occur. The NNE dykes make up 7.8% of the outcrop (Table 1).

Fig. 21 Aerial photo D3208 showing NE-trending dykes for profile ‘B’ (location in Fig. 3) along the coast north of Simiutaq (lower left) at the mouth of Kangerlussuaq. Yellow dashed lines indicate the outline of a dyke, c. 80 m wide.
3.2.3. Tunu (transect C)
Along a distance of 8.5 km on the north shore of Tunu (‘C’ in Fig. 3), 31 NNE dykes occur, making up 5.7% of the outcrop. Additionally, a few ESE dykes also occur. The dykes here are slightly more numerous but not as wide as dykes along the coast north of Simiutaq (transect B). The dyke densities derived for Simiutaq and Tunu (Table 1) are comparable to the 7% observed by Allaart & Jensen (1979) and significantly higher than the 2–3% observed by Escher et al. (1975). In these profiles, maximum widths are in the range 40–50 m. While seven dykes in the Simiutaq transect are 40 m wide, only one 40 m wide dyke occurs within the Tunu transect.
3.2.4. Kangerlussuaq (transect D)
Transect D is located 60 km from the mouth of Kangerlussuaq. In this area, 10 major dykes occur across a distance of 3 km, with a cumulative width of 315 m, giving a dyke density of 10.5% (Table 1).
3.2.5. Kangerlussuatsiaq (transect E)
Approximately 20 km SW of the head of Kangerlussuatsiaq, we observe 11 dykes across a distance of 4.1 km, with a cumulative width of 410 m, giving a dyke density of 10.3% (Table 1).
3.2.6. Inuppaat Quuat (transect F)
In the area north of the ISZ, dyke densities have been assessed in Area 5b just south of the glacier Inuppaat Quuat (location in Fig. 3; Figs 8, 22). The length of the transect is 6 km with a dyke density of 9.9%. Almost half of this is due to three exceptionally wide dykes (50, 80 and 120 m) in the western part of the transect (Figs 12, 22; Table 1).
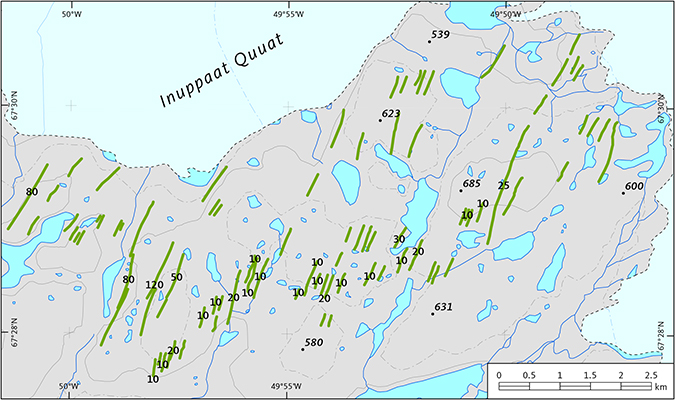
Fig. 22 Dyke swarm (green lines) mapped for profile F (location in Fig. 3) south of Inuppaat Quuat. Thicknesses are measured in metres indicated for the dykes included in Table 1. Numbers in italics indicate selected elevations in metres.
3.2.7. Summary
Of the 123 dykes tabulated in Table 1, only 11 are wider than 40 m, only six wider than 50 m and the widest dyke encountered is 120 m. The widest dyke reported in the literature from this area is 140 m wide (Mayborn 2000) and occurs in the Kangerluarsussuaq fjord c. 20 km N of the mouth of Kangerlussuaq (Supplementary File S1, Figs 3, 7). Dykes less than 50 m wide account for 80% of the dyke volume, while the six dykes wider than 50 m make up the remaining 20%.
In the foreland region, we have only observed local dyke densities significantly exceeding those listed here adjacent to the nunatak Nunakerlua, situated at the northern margin of Kangaamiut Sermiat south of Sarfartoq (‘23’ in Fig. 3). In this area, c. 20 dykes with an average width of c. 20 m make up 20% of a c. 0.8 km wide outcrop, part of which is shown in Fig. 23.
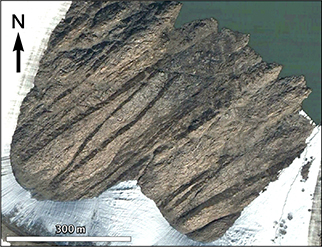
Fig. 23 ‘Extreme’ dyke density of c. 20% is visible on (part of) the nunataq Nunakerlua in the northern border zone of Kangaamiut Sermiat. Location in Fig. 3. Source: Google Earth.
From transects A–E, we conclude that the exposed central part of the dyke swarm in the southern Archaean foreland is characterised by densities of 5–10% with a maximum density of c. 20% on and adjacent to Nunakerlua. Extrapolating the numbers in Table 1 (on average 3.7 dykes/km in transects A to E) to the entire swarm (c. 100 km from Inussuttusup Tunua to the head of Kangerlussuatsiaq) would suggest the number of dykes in the central swarm exposed onshore to be c. 370.
3.3. Dykes in the ISZ
The ISZ contains multiple panels of juvenile Palaeoproterozoic metasediments in which dykes are absent (e.g. Fig. 24). Detrital zircons in a sample of these metasediments yielded maximum ages of c. 2100 Ma (sample 413840 in Nutman et al. 1999). The metasediments are tectonically interleaved with gneisses containing strongly deformed and metamorphosed Kangâmiut dykes parallel to the gneiss fabric (Fig. 24). In the southern foreland described so far, similar juvenile metasediments have not been identified.
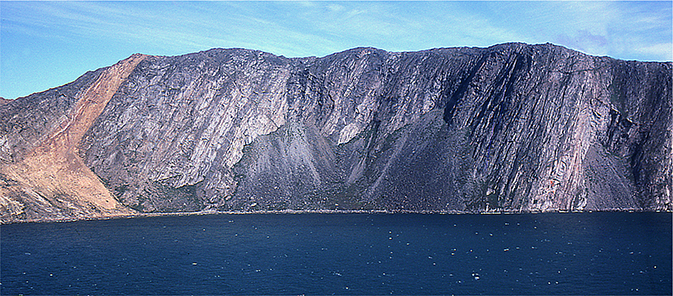
Fig. 24 Panel of rusty weathering metasediments (graphite- and sulphide-bearing) interleaved with gneisses containing deformed Kangâmiut dykes parallel with the Nagssugtoqidian fabric of the gneisses. View towards the east, height of cliff c. 400 m, full width of exposure 1.3 km. Location in Fig. 3.
3.3.1. Dyke densities in the ISZ, Sarfannguit Nunaat
We have evaluated dyke densities as close to the coast as exposure permits, near Utoqqaat, across Sarfannguit Nunaat and the westernmost part of Sallersua (locations in Figs 3, 25). According to Grocott (1979), Kangâmiut dykes extend northwards near the south coast of Maniitsorsuaq, which was suggested to mark the northern limit of the swarm. The southern boundary of the Sisimiut charnockite is a several kilometres wide transition zone with panels of charnockite intercalated with Kangâmiut dyke bearing gneisses. Rocks in the transition zone are strongly deformed and metamorphosed and can be hard to distinguish. High densities of dykes extend for at least 10 km south of this limit.
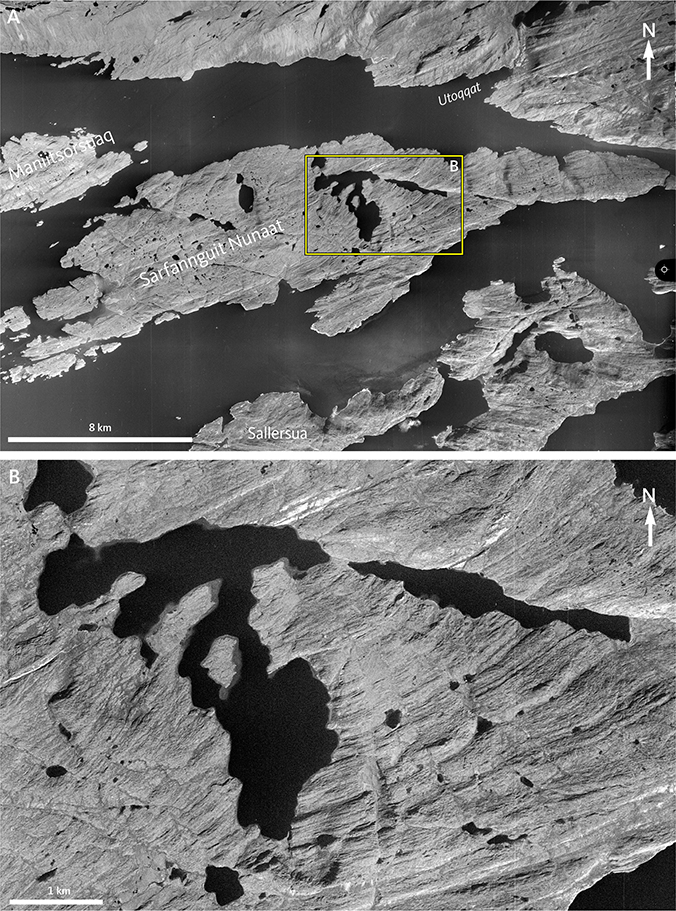
Fig. 25 Dykes on the island of Sarfannguit Nunaat, SE of Sisimiut as seen in aerial photo E3128. Location in Fig. 3. A: Zoomed out view. Area covered in panel B marked in yellow. B: High dyke density is visible in the central part of Sarfannguit Nunaat (width of image 7 km).
It has been possible to estimate dyke densities in these areas, which are assumed to represent the deformed equivalents of the part of the dyke swarm submerged in the Davis Strait to the west. From the coast at Utoqqaat southwards and across the island of Sarfannguit Nunaat, high dyke densities occur across a distance of c. 8 km. Where densities can be evaluated in this part of the profile, we observe up to 40 dykes per km. This is an order of magnitude larger than the density calculated for the swarm in the foreland while the number of dykes (8 × 40) is comparable to those in the foreland in the 100 km transect from the mouth of Itilip Ilua to the head of Kangerlussuatsiaq (Section 3.2). We therefore conclude that dyke densities comparable to that onshore in the foreland are expected to extend offshore. This is likely to be a minimum estimate of the dyke density since some thin dykes identified in the foreland may not be visible on the imagery used in the Utoqqaat to Sallersua area.
3.4. Dykes in the transition zone
In the area SE of the ISZ, deformation is highly variable. Here, we term this the ‘transition zone’ (Fig. 7). It is the area between the ISZ, the SNF (Fig. 2) and Itillip Ilua fjord. This transition zone encompasses parts of Areas 4 and 6, all of Area 7 and parts of Areas 8 and 9 (Fig. 8). Folding is conspicuous in parts of the transition zone. The structural changes from the ISZ and the area to the south are illustrated in Fig. 26, demonstrating the contrast between ISZ (Inner Maligiaq, Figs 3, 26a) and the transition zone (Kangerluarsuk; Saqqap Kangerluarsua; Figs 3, 26b) as mapped by Korstgård (1980).
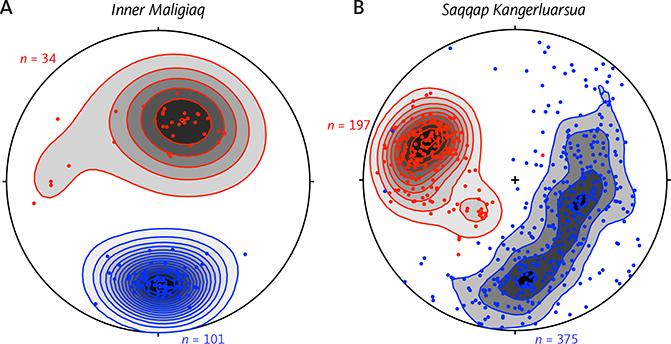
Fig. 26 Stereographic plots (lower hemisphere projection) show both the poles of planar (blue) and linear (red) structures in the Saqqap Kangerluarsua – Ikertooq region. Structural orientation data covers the Ikertooq shear zone (ISZ) and the transition zone to the south. A: Data from the inner part of Ikertooq (Inner Maligiaq, ‘26A’ in Fig. 3). B: Data from the transition zone to the south of the ISZ (Saqqap Kangerluarsua, ‘26B’ in Fig. 3). The complete girdle in B reflects the pervasive and consistent folding in the transition zone. Structural measurements are further contoured, using Stereonet v. 11 software (Allmendinger et al. 2012; Cardozo & Allmendinger 2013). Kamb contouring, interval 2 sigma. Data from Korstgård (1980).
3.4.1. Areas 4, 6 and 7
North of Itillip Ilua, ENE dykes are dominant and likely to be reorientated NNE dykes (Fig. 27, Area 4). However, ESE dykes are also present.
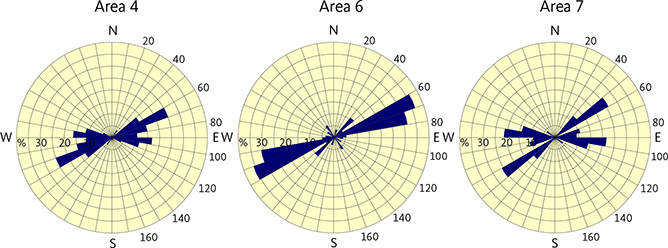
Fig. 27 Rose diagrams showing typical Nagssugtoqidian orientations of dykes in Areas 4, 6 and 7 representing the zone south of the corridor of highly parallelised dykes and gneiss structures in the Ikertooq shear zone and north of the Southern Nagssugtoqidian Front. The extent of these areas is shown in Fig. 8. Rose diagram construction described in Fig. 9.
Dykes from Area 1 to Area 4 thus represent a transition from the original NNE orientation in the foreland to an ENE-trending Nagssugtoqidian orientation. This transition occurs across a narrow zone extending eastwards along Itillip Ilua, across Kangerlussuaq and along Sarfartoq valley (Fig. 5). The relationship between dyke orientation and lineament geometry is discussed in detail elsewhere (Korstgård et al. 2024).
The Nagssugtoqidian trend observed towards the east in Area 4 continues into Areas 6 and 7 (Figs 8, 27), thus collectively outlining a zone of predominant Nagssugtoqidian trends between the southern foreland and the northern corridor of highly parallelised dykes and gneiss structures in the ISZ.
3.4.2. Areas 8 and 9
In Areas 8 and 9 (Figs 8, 28), Nagssugtoqidian deformation is less intense than in the adjacent Area 7 where zones of stronger deformation are prevalent. On the original Escher et al. (1975) map, shown here as Fig. 5, the NNE dykes in Areas 8 and 9 were marked as undeformed. However from our mapping it appears that the NNE and ESE dykes have been significantly deformed (see Figs 7, 28). The boundary between Areas 6 and 7 and Areas 8 and 9 corresponds to the “Southern Nagssugtoqidian Boundary” or “Main Nagssugtoqidian boundary” of Escher et al. (1975, 1976), “Southern Nagssugtoqidian Structural Front” of Hageskov (1995a) or our preferred “Southern Nagssugtoqidian Front” (SNF) of van Gool et al. (2002). Escher et al.’s (1975) illustration of this boundary (their figs 8 & 10) features the north side of Sarfartoq valley (Fig. 29) showing the strongly parallelised dykes and host rock structures in what Hageskov (1995a, 1995b) calls part of a ‘Paradise thrust segment’.
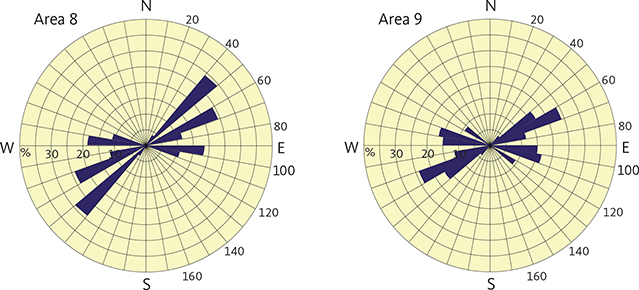
Fig. 28 Rose diagrams of dyke orientations for Areas 8 and 9 in the foreland immediately south of the Southern Nagssugtoqidian Front. The extent of these areas is shown in Fig. 8. Rose diagram construction described in Fig. 9.
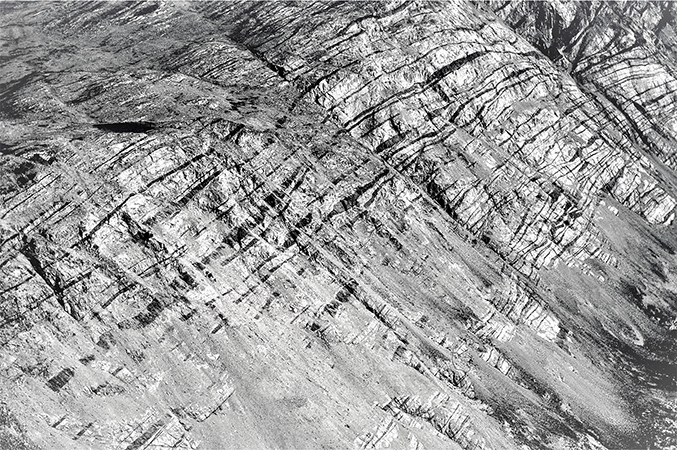
Fig. 29 Extremely deformed dykes are visible in the northern wall (height of section c. 700 m) of Sarfartoq valley (‘Escher’s wall’). This exposure is part of the Paradise thrust segment of Hageskov (1995b) and Olsen (2000). In this wall, c. 50 dykes are visible, and detailed measurements indicate they make up 22% of the exposure. Location in Fig. 3. Valley trends E–W, viewing direction towards the NE.
As a participant in the DLC project, Olsen (2000) mapped in the area from Sarfartoq to c. 10 km east of the SNF. This mapping included the complex geometry of the SNF and added some detail to the southern part of Hageskov’s generalised segmentation model and is shown in Fig. 5. Olsen (2000) noted the marked increase in deformation from Kangerlussuaq south-eastwards in Sarfartoq valley. The presence of undeformed NNE-trending and E–W-trending Kangâmiut dykes with metamorphic mineral assemblages was also observed.
It is clear that structural heterogeneity characterises this zone and that it is a distinctive feature of the entire SNF with weakly deformed dykes interspersed with zones of intense deformation.
3.4.3. The transition zone near the head of Kangerlussuaq
A spectacular example of the structural transition across the SNF is visible to those entering Greenland via Kangerlussuaq airport. An area near the airport has been described by Engström & Klint (2014), who report two generations of post-dyke ductile shear zones, the oldest of which is dextral. One of these is shown here (Fig. 30A). The density of dykes in this shear zone is comparable to the density of dykes in the ISZ described earlier. This is in contrast to the area SE of the runway where weakly deformed ESE dykes can be seen (Fig. 30B). These features are also evident in Supplementary File S1 and in figs 6b & 6c of Engström & Klint (2014).

Fig. 30 Dykes visible near Kangerlussuaq airport. A: Strongly deformed dykes north of the runway. View towards NE, exposure is c. 525 m long. B: Weakly deformed subvertical 15–20 m wide E–W trending dykes SSE of runway (similar to the relationships in fig. 6B of Engström & Klint 2004). Major dykes indicated by arrows. Locations in Fig. 3. Source: Google Earth.
The areas described by Engström & Klint (2014) near the head of Kangerlussuaq are situated within the transition zone. They perfectly summarise the variability of structures in this zone (p. 326) as a change in deformation style of the Kangâmiut dykes, which they observed along a regional N–S transect from a “folded area in the north” and through “the strongly sheared system 1 shear zones in the central area, towards the generally undisturbed area south of the Sandflugtdalen thrust fault.” For reference, the ‘system 1 shear zones’ are E–W-trending and an example is shown in Fig. 30A. The ‘Sandflugtdalen thrust fault’ trends ENE–WSW and is located between the areas shown in Figs. 30A and B.
4. Discussion
The main Nagssugtoqidian structural features and a schematic representation of the Kangâmiut dykes interpreted in this study are shown in Fig. 7 (and in full in Supplementary File S1). A significant new observation resulting from our mapping of these dykes is that mafic dykes – specifically members of the Kangâmiut dyke swarm – may occur north of the ISZ. This interpretation is open to conjecture. However, considering the potential implications, we will discuss possible consequences for the nature of the ISZ and for the evolution of the SNO. If future work shows that alternative interpretations are more likely, the tectonic implications discussed here will need to be adjusted.
In the ISZ, the intercalation of dyke-bearing gneiss panels with juvenile sediments (see Fig. 24) leaves no doubt that this structure is of prime tectonic significance. It has been interpreted as a ductile zone of S- to SSE-directed thrusting (Korstgård et al. 1987). The ISZ separates areas characterised by distinctly different distributions of Kangâmiut dykes.
In the zone between the ISZ and the Nordre Isortoq shear zone (Fig. 2), the approximate western limit of the dense part of the NNE swarm is suggested (Section 3.1.3) to be located either c. 100 km west of the Greenland ice sheet (including the area shown in Fig. 13) or to the west of the Inuppaat Quuat area (Fig. 12A) c. 30 km west of the Greenland ice sheet. The eastern limit is presumably covered by the Greenland ice sheet.
This contrasts with the area south of the ISZ where an approximate eastern limit is visible, but a western limit is not exposed. South of Itillip Ilua (Fig. 7), a high density of dykes is seen southwards to Maniitsoq. The eastern limit of this high-density core of the swarm can be traced towards the NNE and NE in the vicinity of the Aujassoq shear zone. As discussed in Section 3.3, the western limit to the swarm must lie c. 100 km offshore if the density of dykes offshore is comparable to that onshore. That the Kangâmiut-1 well is situated 100 km offshore may be seen as evidence that this suggested extent of the swarm offshore is not unreasonable.
It is our hypothesis that the dykes north and south of the ISZ constituted a continuous swarm prior to Nagssugtoqidian tectonism, and that crustal shortening across the ISZ brought a northern and southern segment into their present relative positions.
To assess the amount of shortening across the ISZ, some simplifications are needed. The ISZ is reduced to a discrete line, X–Y–Z in Fig. 31 with ‘X’ representing the western limit of the swarm south of the ISZ. Line X–Y*–Z* represents the western limit of the swarm prior to thrusting (Fig. 31). The X–Y*–Z* trend is parallel to the average trend of Kangâmiut dykes in the southern Archaean foreland.
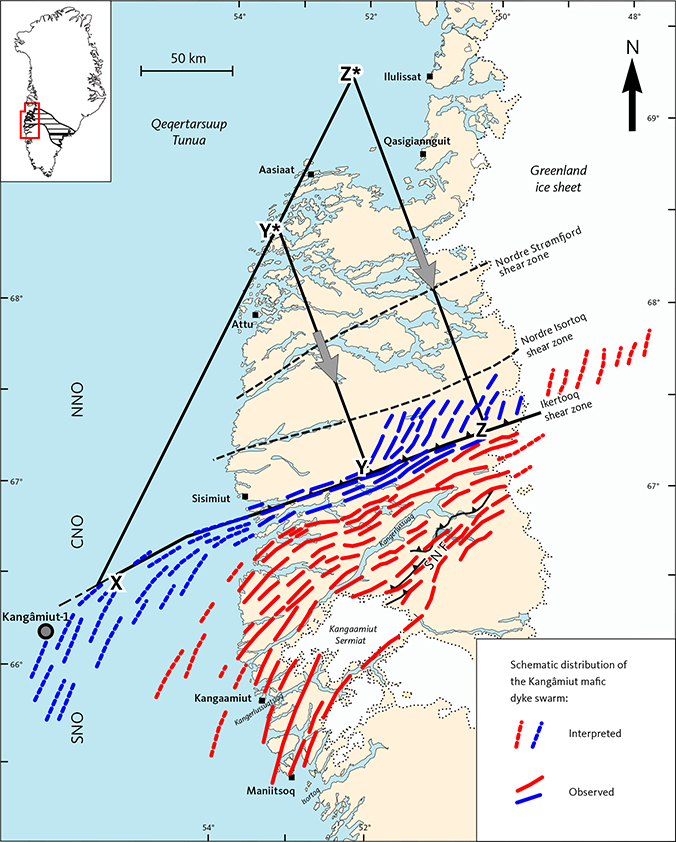
Fig. 31 Proposed model to explain the distribution of Kangâmiut dykes in the central and southern Nagssugtoqidian orogens (CNO, SNO). X marks the proposed westernmost occurrence of Kangâmiut dykes south of Ikertooq shear zone (ISZ). Y and Z mark the westernmost extent of Kangâmiut dykes north of the ISZ, depending on whether this margin is interpreted to be 100 km (Y) or 30 km (Z) west of the Greenland ice sheet. If the dykes at Y were once co-extensive with the western margin of the swarm south of the ISZ, they would have originated near Y* assuming translation perpendicular to the ISZ. Similarly, if the dykes at Z represented the western limit of the swarm north of the ISZ, they would necessarily have come from near Z*. Kangâmiut-1: exploration well. Solid dykes are generalised from observations shown in Fig. 7. Stippled dykes are extrapolated. Blue dykes are from in or near to the ISZ and their extrapolated equivalents. Red dykes are those observed south of the ISZ and their extrapolated equivalents. Grey arrows: direction of shortening in the two scenarios described in the text (Y*→Y and Z*→Z).
North of the ISZ, the western limit of the dykes was suggested to be either c. 30 km or c. 100 km west of Inuppaat Quuat (Section 3.1.3). In the former case, the eastward shift of the swarm is c. 230 km (X–Z in Fig. 31), while in the latter scenario (X–Y), the shift would be c. 150 km.
To explain these shifts as a result of southward thrusting in a direction perpendicular to the ISZ (as illustrated by grey arrows in Fig. 31), we arrive at distances between 160 km (Y*–Y in Fig. 31) and 260 km (Z*–Z), depending on how the western extent of the swarm north of ISZ is interpreted.
It should be noted that this magnitude of thrusting agrees with the extent of crustal loading southwards from Ikertooq inferred independently by Korstgård et al. (2024) from metamorphic overprinting of the Kangâmiut dykes. One of the consequences of this model is that the crustal segments now juxtaposed across the ISZ (CNO and SNO, Fig. 2) at the time of dyke emplacement were separated by 160–260 km of intervening, dyke-bearing continental crust.
If the Nordre Strømfjord shear zone and Nordre Isortoq shear zone likewise represent the loci of significant crustal shortening, the present-day width of the CNO (c. 100 km from the northern margin of the Nordre Strømfjord shear zone to the southern margin of the ISZ) represents only a small fraction of the pre-Nagssugtoqidian continental crust in West Greenland.
5. Conclusions
The Kangâmiut dyke swarm has in many studies been shown to be a sensitive monitor of the structural and metamorphic changes occurring across the southern margin of the Nagssugtoqidian orogen. With that in mind, the present effort set out to quantify the change in orientation and density of dykes across the extent of the swarm. This was accomplished via publicly available aerial imagery and involved careful visual inspection of c. 125 aerial photos in 1:150 000 scale, locally complemented with EOX and Google Earth satellite images.
The SNF is marked by a zone of south-directed thrusts in which dykes and their host gneisses are strongly parallelised. South of the SNF – in the foreland – the swarm is NNE-trending and contains a minor subset of dykes with other orientations, dominantly E–W to ESE–WNW. From the south towards the SNF, the orientation of the dykes gradually rotates from NNE to the characteristic ENE-orientated Nagssugtoqidian trend. Notably, NNE dykes are rotated clockwise, whereas E and ESE dykes are rotated counterclockwise, thus indicating an overall NNW-orientated shortening direction.
In several profiles both south and north of the SNF, we made detailed measurements of dyke orientation, density and thickness. In these profiles, dykes were found to make up 6–11% of the outcrop, thus indicating the magnitude of crustal extension accompanying dyke emplacement. Of the 123 dykes observed, the average dyke width is 25 m, with 80% of these being less than 50 m wide.
While the Kangâmiut dyke swarm is generally believed to not extend northwards beyond the ISZ, the aerial images studied here of the eastern area between the ISZ and the Nordre Isortoq shear zone revealed what appears to be a group of NNE- to NE-trending dykes. Their belonging to the Kangâmiut dyke swarm is at this point speculative, however should this be confirmed, it has interesting implications for the tectonic evolution of the ISZ.
The western extent of the dyke swarm south of the ISZ is not exposed and must be somewhere in the Davis Strait. If our assumptions about the extent of the Kangâmiut dyke swarm are correct, the calculated shortening across the ISZ is in the order of 150–300 km, which is the same order of magnitude proposed by recent studies based on metamorphic overprints and geochronological data from the southern Nagssugtoqidian orogen and its foreland.
Acknowledgements
The authors extend their appreciation to Jeroen van Gool and Kyle Mayborn for careful, critical and constructive reviews of earlier versions of this manuscript. It is also their pleasure to acknowledge GEUS’ editorial staff for their patience and help.
Additional Information
Author contributions
KS, JK: conceptualization, investigation, writing. FCM: writing, editing. WW: maps.
Additional files
Supplementary File S1 contains the revised map of Kangâmiut dykes and major structures of the Nagssugtoqidian orogen and is available at https://doi.org/10.22008/FK2/SOMUF1
