DATA ARTICLE | SHORT  |
Open access nationwide data sets for drinking water hardness at public waterworks and their water supply areas in Denmark
Denitza D. Voutchkova*1 , Charlotte T. Thomsen2, Niels Claes3, Lars A. Olsen2, Lærke Thorling1, Bjarni Pjetursson2, Birgitte Hansen1
Abstract
Three spatiotemporal data sets of drinking water hardness in Denmark (version 1) are presented here: (1) annual drinking water hardness at public waterworks (1905–2023); (2) annual drinking water hardness at their water supply areas (1978–2023) and (3) the latest drinking water hardness at the water supply areas (1980–2023). Raw data were extracted from the Jupiter database for groundwater and drinking water data in Denmark, and were quality-assured. Hardness was calculated after semi-automatic outlier exclusion based on Ca and Mg, or if not available, the reported total hardness. Data were further aggregated at the waterworks level by the annual mean and at the supply area level by the weighted mean (weighted to waterworks annual abstraction volumes). Temporal and spatial gaps were filled prior to these aggregations. Various stakeholders could benefit from these open access data. They provide a societal service in response to increased public interest in drinking water hardness. The research community could use the data in environmental, exposure or epidemiological assessments. Finally, the water supplies and the public sector could benefit from these data as they provide a nationwide overview of current and past drinking water hardness in Denmark and highlight the geographic areas that lack recent data, most probably due to de-regulation.
Citation: Voutchkova et al. 2024: GEUS Bulletin 57. 8374. https://doi.org/10.34194/geusb.v57.8374
Copyright: GEUS Bulletin (eISSN: 2597-2154) is an open access, peer-reviewed journal published by the Geological Survey of Denmark and Greenland (GEUS). This article is distributed under a CC-BY 4.0 licence, permitting free redistribution, and reproduction for any purpose, even commercial, provided proper citation of the original work. Author(s) retain copyright.
Received: 05 Mar 2024
Revised: 07 May 2024
Accepted: 12 May 2024
Published: 05 Sept 2024
Competing interests and funding: The authors declare no competing interests.
This study was supported by internal funding from the Geological Survey of Denmark and Greenland (GEUS).
*Correspondence: [email protected]
Keywords: drinking water hardness, calcium, magnesium, public waterworks, water supply areas
Abbreviations:
DW: drinking water
GEUS: Geological Survey of Denmark and Greenland
LOD: limit of detection
SD: standard deviation
WSA: water supply area
Edited by: Adam Hambly (DTU, Denmark)
Reviewed by: Mayumi Hori (University of Tokyo, Japan), Ronnie Levin (Harvard University, USA), Camilla Tang (NIRAS, DK)
Tabular abstract
| Geographical coverage | Denmark |
| Temporal coverage | 1905–2023 |
| Subject(s) | Engineering and environmental geology, Geochemistry, cosmochemistry and geochronology, Geoscience history and policy |
| Data format(s) | Analysed data (shape files and csv files). |
| Sample collection & analysis | Public waterworks metadata and drinking water analyses of Ca, Mg and total hardness from the Jupiter database extracted on 6 September 2023. The water supply areas are from Schullehner (2022, https://doi.org/10.34194/geusb.v49.8319). Data were quality assured, filtered, aggregated and linked together. |
| Parameters | Drinking water hardness in German degrees (°dH), drinking water hardness class, unique identification number for the water supply areas (WSAID) and for the public waterworks (ANLAEGID), as well as sampling year, based on the sampling date (PROEVEDATO). |
| Data availability | All data files are available at https://doi.org/10.22008/FK2/NLX5SX |
| Potential application(s) for these data | Data set 1 (annual hardness at the waterworks level for the period 1905–2023) allows for in-depth spatiotemporal analyses at different scales – from time-series analysis at single waterworks to national status overviews and spatial pattern analysis. Data set 2 (annual hardness data at the water supply areas, WSAs for the period 1978–2023) allows for exposure and epidemiological studies on a national scale by spatial link with geocoded household addresses or patients residential history. Data set 3 (latest hardness at WSA level) can be used for mapping the current drinking water hardness in Denmark and for visualising current data availability. These three data sets have many other potential applications spanning research, education, outreach and public decision support. |
Data collection
Background information
The main purpose of this work is to update the national drinking water (DW) hardness map for Denmark produced by the Geological Survey of Denmark and Greenland (GEUS 2010). The previous map was based on data from 2010, now outdated, and was aggregated and presented at the municipality level. This approach is problematic for at least two reasons. Firstly, some municipalities are supplied by waterworks located outside of the municipality borders (e.g. in the Copenhagen area and Odense). This results in both gaps in the map for these municipalities and miscalculations for the municipalities where the waterworks are located (but do not supply water locally). Secondly, some of the large municipalities in Jylland and on Sjælland have DW with three different hardness-classes, so if municipality-level averaging is used, the resulting DW hardness would be significantly different from that experienced by consumers. Interpolation based on waterworks location is equally problematic because it assumes that the DW is supplied locally in the surroundings of the waterworks, which is not necessarily the case. Therefore, we decided that the optimal way to represent DW hardness is currently at the water supply area (WSA) level, using the open access data set by Schullehner (2022). The WSA data were collected at the municipality level, digitised and linked to the waterworks they are supplied by Schullehner (2022). The data cover the period 1978–2019 (Schullehner 2022).
DW quality data, including data on calcium (Ca), magnesium (Mg) and total hardness, is collected to comply with DW quality regulations (Council of the European Union 2020; Miljøministeriet 2022, 2023a). All compliance samples are taken, analysed and reported to the national well database Jupiter (Hansen & Pjetursson 2011) by accredited chemical laboratories in Denmark. The legal requirements for the quality of environmental samples (Miljøministeriet 2023b) must be followed, according to which, the relative uncertainty for Ca and Mg must be ≤ 15% (for high concentrations) and the absolute uncertainty (for low concentrations) must be ≤ 3 or 1 mg/L, respectively. These requirements have been in force since their introduction in 2002. Method M069 of the Danish Environmental Protection Agency Reference Laboratory for Chemical and Microbiological Measurements provides further information on the appropriate pre-treatment, storage and laboratory methods (Miljøstyrelsen 2023).
The legal requirements for compliance sampling for Ca, Mg and total hardness have changed over the years and this is reflected in data availability in Jupiter. Since the end of 2017 (Miljøministeriet 2017), there is only a requirement to provide a general description of the DW quality to the consumer, including the water hardness (§ 33(6), Miljøministeriet 2023a) but there are no longer DW quality standards for Ca, Mg and total hardness, and thus no required sampling frequency based on the waterworks’ capacity (m3 of produced DW). This is in fact a de-regulation, as for the period 2001–2017, Ca, Mg, and total hardness were included in the extended Danish DW control list (Miljøministeriet 2001, Appendix 5). Hence, they were sampled once every year or every second year, depending on the waterworks’ capacity. In this period, there was a quality standard for Mg (50 mg/L), a remark that Ca should not exceed 200 mg/L and that the total hardness should be 5–30 German degrees (°dH; Miljøministeriet 2001, Appendix 1a). Before that (1988–2001) Ca, Mg, and total hardness were also in the extended DW control (Miljøministeriet 1988, Appendix 5), but the sampling frequency was once a year irrespective of waterworks’ capacity. There was no explicit standard for Ca, only a note referring to the standard for total hardness (5–30 °dH) and next to the standard for Mg (50 mg/L) there was also a provisional guideline value (30 mg/L; Miljøministeriet 1988, Appendix 1).
There is considerable public interest in the DW hardness, as it is an important technical characteristic of tap water in relation to precipitation of carbonates (i.e. scaling) in water pipes, boilers and other hot water household appliances, as well as in relation to increased soap use. The data have also potential relevance to the public health sectors and various industry sectors.
Data sources
Raw data were extracted from the Jupiter database (Hansen & Pjetursson 2011) on 6 September 2023. Field (column) names and codes are capitalised, italicised and provided in parentheses, where relevant. A list of field names used in these data sets and their corresponding field name in the Jupiter database with their PC Jupiter XL naming format is provided in Table S1 (Supplementary File S1). Figure 1 summarises the processing steps used in creating the data sets.

Fig. 1 Flowchart summarising the data preparation and statistical analyses used here. QA/QC: quality assurance and quality control. WSA: water supply area. For the contents of Data sets 1, 2, and 3, see Section ‘Data description and main features’. Hardness calculated by Eq. (3). Field names: ANLAEGID: unique identification number (ID) of the waterworks. PLANTID: waterworks ID used in Schullehner (2022), same as ANLAEGID. PROVEID: sample ID. PROEVEAAR: sample year. WSAID: ID of the WSA (Schullehner 2022). Full list of field names in Supplementary Files S1, S2.
Database tables containing information on the DW samples, their chemical analyses and waterworks were all joined together by the unique sample identification number (ID) and the waterworks ID (fields PROEVEID and ANLAEGID, respectively). Only waterworks with chemical analyses were retained in the data set. Annual groundwater abstraction volumes (ESTIMMAENGDE) were joined to the data set using the waterworks ID and the sampling year (fields ANLAEGID and PROEVEAAR, respectively). Data-quality checks and filtering procedures described here were executed before combining the input tables (provided in Supplementary Files S3).
Data preparation
Quality checks and filtering procedures used for preparing the data sets are similar to those used by Voutchkova et al. (2021). Only public waterworks were included. Public waterworks supply more than 10 households and are registered in Jupiter as ‘company type’ (VIRKSOMHEDSTYPE field) as follows:
- municipality-owned public water supplies (V01)
- privately owned public water supplies (V02)
- water supply (M42) – a code used in the past for public water supplies.
The most recently registered value for ‘company type’ (VIRKSOMHEDSTYPE) was used.
Only the analyses for Ca, Mg and total hardness were retained in the data set (STOFNR = 280, 321, 70, where STOFNR is the field name referring to the chemical parameter, according to Stancode). The reported total hardness was used to fill gaps where Ca or Mg were unavailable for the hardness calculation and for comparison purposes. Hardness was calculated based on Ca and Mg, due to their overall higher spatiotemporal data coverage than total hardness (see section on Statistical analysis and data processing).
The units for Ca and Mg (field name ENHED = 1, i.e. mg/L) and total hardness (ENHED = 22, German degrees, °dH) were checked. Data without a reported unit were excluded.
Flagged data were excluded based on the ATTRIBUT field unless the field was empty or contained ‘<’ (i.e. below the limit of detection, LOD). Samples not approved by the owner were indicated in the KVALITETSSIKRING field and excluded from the data sets.
All samples from treatment processes (process waters, indicated by PROJEKT = ‘PROCV’) were excluded, as they are not representative of the finished treated DW.
Depending on the sampling purpose, only DW samples were kept in the data set where they had the following FORMAAL values: 0, 6, 7, 9, 10, 11, 12, 34, 35, 39, 40, 41, 42 (definitions for these codes are available in the documentation of PC Jupiter XL; GEUS 2024). A FORMAAL of nine refers to samples taken for the purpose of pollution assessments, however since the sampling location was either at the exit waterworks or at the tap, they are none-the-less DW samples. So, 79 samples with this code were retained. Samples with no value entered for FORMAAL were excluded (n = 319). As a result, only samples taken at exit waterworks, the supply network and at the end-consumers’ tap affiliated with a specific waterworks were retained in the data set.
Ca and Mg reported as 0 were treated as reporting errors and excluded. Concentrations in field MAENGDE must be reported to Jupiter as > 0. For analyses below the LOD, the LOD must be provided in the MAENGDE field, and the ATTRIBUT field must contain ‘<’. The other Jupiter LOD field often contains incomplete and contradictory information, so it was not used here.
A check for unreasonably high LODs was also performed. For Ca, two samples with LOD = 97.8 mg/L and 132 mg/L were most probably a result of erroneously used ATTRIBUT ‘<’ and were excluded from the data set. Subsequently, LODs for Ca ranged from 0.005 to 5 mg/L and only 10 samples were below the LOD. For Mg, LOD ranged from 0.005 to 9.4 mg/L (n = 44) with the most frequent LOD = 1 mg/L (n = 18). No samples were excluded for Mg based on high LOD. The ATTRIBUT ‘<’ was further ignored, i.e. < LOD = LOD.
Data with erroneous sampling dates (field name PROEVEDATO; e.g. 0001, 0208, 1894 or 1897) were excluded. Only samples in the period 1900–2023 were kept in the data set.
Jupiter contains spatial information about the location of the waterworks. Projected coordinates (UTM 32, EUREF 89) were used here (field names XUTM32EUREF89 and YUTM32EUREF89). In 2019, Schullehner (2022) checked, corrected and geocoded missing coordinates of public waterworks where an address was available. These adjusted coordinates were used here (also in Supplementary Files S3). Zero coordinates were substituted with missing values. There were 64 waterworks with missing X or Y coordinates (17 861 individual Ca and Mg analyses). An address was provided for 24 of these waterworks, but geocoding was not done. For waterworks without X or Y coordinates, but with an overlying waterworks (i.e. where the OVERANLAEG field was not empty), the waterworks ID was overwritten with the ID of the overlying waterworks. In this way, the reported chemical analyses for the waterworks without coordinates were transferred to the overlaying waterworks with coordinates. In addition, seven waterworks (ANLAEGIDs 106730, 193235, 189193, 190517, 191992, 192278, 192302) had erroneous coordinates outside Denmark, determined after mapping in QGIS. For two of those (ANLAEGIDs 192278 and 192302) there was a value in the OVERANLAEG field, so their analyses were transferred to the specific OVERANLAEG field. We recommend addressing issues with missing or wrong coordinates in future updates of these data sets.
Identical replicates were removed from the data and outliers in the Ca, Mg and total hardness time series were excluded by the semi-automated outlier detection procedure.
Statistical analysis and data processing
Semi-automated outlier detection procedure
The detection and removal of outliers was deemed necessary based on cumulative distribution plots (see Fig. S1, Supplementary File S1). A semi-automated outlier detection procedure was implemented for each parameter separately (Ca, Mg and reported total hardness). The outliers were evaluated based on the time series for the specific waterworks. Laboratory analyses were flagged as outliers where they were different from their surrounding values. Potentially high outliers had a percentage difference ≥200% as calculated in Eq. (1), from the two previous and two following analyses:
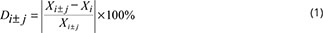
where, Xi is the chemical analysis in the timeseries of a specific waterworks that is evaluated for being an outlier, i is the time index for that chemical analysis, and j is equal to 1 or 2, as it indicates the position of the preceding or following chemical analyses. For example, when j = 1, Xi−1 is the chemical analysis before Xi , and when j = 2, Xi−2 is the laboratory analysis before Xi−1 Therefore, the percent difference from the previous one, two, or next one, two analyses were calculated (Di±j). Values were flagged as potential outliers as follows:

When Xi appeared at the beginning or end of the time series, the corresponding Di±j could not be calculated, so only the rest of the conditions were used. For example, for the first analysis in the time series, the difference was calculated based solely on the following two samples.
It was assumed that a change in treatment (e.g. softening) would result in a step change followed by a relatively stable period, and thus not all four conditions in Eq. (2) would be satisfied simultaneously. However, there could be other reasons for false detection of outliers, for example if the waterworks blends groundwaters or treated DW with very different quality and the mix is not consistent in time. Therefore, to validate the outlier detection all time series with flagged potential outliers were plotted and visually examined.
While visually examining the time series, outliers in the low concentration or hardness range were discovered. Equation (1) flagged the values surrounding them (but not all four conditions from Eq. (2) were simultaneously fulfilled). So, to pinpoint the low outliers, the flags were shifted back or forward once, or twice, depending on the specific condition. Outlier detection at the end of the time series (the most recent one or two analyses) was not implemented as there was a higher chance that outliers here were due to (1) changes in treatment, (2) introducing new wells with different water quality or (3) due to other operational changes, which could not be evaluated currently. Therefore, there were at least two analyses following a potential low outlier. All validated outliers (both high and low) were excluded from the data set, see ‘Outlier detection and validation’ section in Supplementary File S1 for details. Future work could focus on developing a fully automated outlier detection and removal method and testing the performance of different thresholds.
DW hardness calculation and classification
After outlier removal, the data were considered clean. A sample mean for each parameter was calculated (using fields PROEVEID and STOFNR) as sampling replicates with different concentrations were not treated as individual samples.
DW hardness was calculated at the sample level by Eq. (3) following Hansen & Thorling (2018):

where °dH is the DW hardness in German degrees, and Ca2+ and Mg2+ are the concentrations of Ca and Mg in mg/L. The °dH is defined as 10 mg/L CaO. It can be converted to American degrees of hardness (i.e. ppm or 1 mg/L CaCO3) with a conversion factor of 17.848.
It was decided to use Eq. (3), because overall, Ca and Mg have a better spatiotemporal coverage over the reported total hardness. Figure S6 (in Supplementary File S1) shows a comparison between reported and calculated hardness. The DW hardness was calculated based on Eq. (3) for 91 673 samples (3939 waterworks). In addition, 2980 samples reported total hardness but no Ca and/or Mg, and Eq. (3) could not be used (Fig. S7, Supplementary File S1). These were added to the data set to ensure maximum data coverage. Thus, DW hardness was either calculated or reported directly for 94 653 samples at 3963 waterworks in the period 6 February 1905–28 August 2023.
DW hardness in Denmark is traditionally classified in seven hardness classes from very soft to extremely hard (Table 1). Various classifications are used internationally (Rygaard & Albrechtsen 2020), so here we report both the hardness classes and the hardness in °dH. We recommend using the colour palette in Table 1, because it is (1) suitable for people with deuteranomaly, protanopia, deuteranopia and tritanopia (tested with the tool developed by Nichols n.d.) and (2) neutral, without implicit negative associations for danger or bad quality.
Data aggregation at the waterworks level
Annual mean DW hardness was calculated for each waterworks and rounded to one decimal (based on the PROEVEAAR and ANLAEGID fields). This aggregation was necessary because the sample frequency varied from once each 4 or 5 years to multiple times a year. To some extent, this heterogeneity is caused by the legal requirements for sampling frequency (see Section ‘Background information’). Data set 1 contains the resulting annual DW hardness (n = 76 570) for 3963 public waterworks between 1905 and 2023.
Link between waterworks and WSAs
Data set 1 was joined to the WSA data set (Schullehner 2022) with the waterworks ID (‘ANLAEGID’ in our data set or ‘PLANTID’ in Schullehner 2022). Some WSAs are supplied by multiple waterworks, thus the join type was one-to-many. It was also specified that the sampling year (PROEVEAAR) should be within the period of validity of the WSA (PROEVEAAR = [start, end]). The WSAs were last updated in 2019 (Schullehner 2022), so here we assumed that they have remained unchanged (i.e. for PROEVEAAR > max(end), the WSAs with corresponding end = 2019 was used). This assumption may not hold after 2019 where there has been (1) introduction of new waterworks or (2) consolidation of waterworks (closing of small waterworks) or (3) expansion of WSAs due to newly built areas, previously outside WSAs. Joining the data sets resulted in 3827 waterworks (96.6% of those from Data set 1) being linked to 3571 WSAs. We recommend that the data set by Schullehner (2022) should continue to be updated for use in future assessments.
Estimating the DW hardness at WSAs
The annual DW hardness at the WSA level (°dHWSA) was calculated as a volume-weighted mean using Eq. (4):
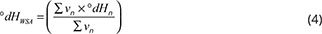
where n is index for the waterworks within a specific WSA, Vn is the groundwater abstraction volume for the specific waterworks and year, and °dHn is the annual DW hardness for the specific year from Data set 1. When n = 1, the annual DW hardness at the WSA was equal to the annual DW hardness at that waterworks. In total, 660 WSAs were supplied by more than one waterworks. The volume-weighted mean was used to account for the different capacities of waterworks, because there could be a few orders of magnitude difference in the estimated annual abstraction. This approach was also used in GEUS (2010), where the volume-weighted mean was calculated on a municipality level. The abstraction volume data were incomplete (see Section ‘Estimating annual production volumes’), so calculating a volume-weighted mean introduces uncertainty in the annual DW hardness estimation.
For purposes of comparison, an arithmetic mean and standard deviation (SD) were calculated for each WSA (where n > 1) and included in Data set 2 together with °dHWSA and n. Figure S8 (in Supplementary File S1) compares the arithmetic and volume-weighted means.
Estimating annual production volumes
Field ‘ESTIMMAENGDE’ contains an estimated annual groundwater abstraction for the waterworks (ANLAEGID) or, if not available, for the groundwater wells belonging to the specific waterworks. When annual groundwater abstractions were reported for both waterworks and their well screens, the largest value was used.
Zero volumes were treated as reporting errors and substituted with ‘missing value (NA)’. It was assumed that if there has been a compliance sampling in a specific year, DW must have also been produced – however, the volume was wrongly reported to Jupiter.
Time series for volume (annual resolution) were arranged by waterworks ID and year. For each waterworks, the missing values were filled using the ‘downup’ method, which first looked for values down, then up in the specific time series (Wickham et al. 2023b). Filling missing values in the time series was only possible when there was at least one value in the entire period.
For the waterworks without any reported volumes in the period, and for WSAs with multiple waterworks, a mean volume was calculated based on the information from the other waterworks in the WSA (max. n = 7) and assigned to the waterworks with a missing volume for the specific year. This resulted in either under- or over-estimating the actual volumes, but it was preferred over excluding waterworks from the volume-weighted mean calculation, Eq. (4), where it would have otherwise left a missing value. It was important to retain information on DW hardness at a waterworks, even when there was no information on the volume. Even after that, there were waterworks with missing volumes for some years, so another round of gap filling was done at the waterworks level following the same procedure.
To summarise, missing annual volumes were imputed by (1) time-series gap-filling at the waterworks level, followed by (2) spatial averaging at WSAs for the specific year, followed by (3) time-series gap-filling at the waterworks level. This left 74 missing values for 7 WSAs, so arithmetic mean hardness at the WSAs was used there instead.
Estimating the current DW hardness at the WSA
The final data product (Data set 3) contains the latest DW hardness at the WSA based on the data from Data set 2. It was assumed that the current DW hardness at a WSA is equal to the latest estimated annual hardness at the WSA. This was done to maximise the spatial data coverage while still showing the most recent available data. The latest annual hardness was linked to the current WSA polygons (end = 2019).
Software
All described procedures were implemented in R (v. 4.2.1; R Core Team 2022), using the R packages: tidyr (v. 1.3.0; Wickham et al. 2023b), dplyr (v. 1.1.0; Wickham et al. 2023a), data.table (v. 1.14.8; Dowle & Srinivasan 2023). All graphs were produced with ggplot2 (v. 3.4.1; Wickham 2016). The maps were made with QGIS (v. 3.22.10; QGIS Development Team 2021).
Data description and main features
Data set 1
Data set 1 (Fig. 2) contains information about the annual DW hardness at the public waterworks in Denmark (n = 3963) between 1905 and 2023 (see Supplementary File S2 for a description of the contents). Reporting of DW quality by the Danish counties became mandatory in 1986 and digitising of old laboratory records was not uniform throughout Denmark. This is reflected in the data availability (Fig. 2). Data set 1 can be used to study the temporal changes in DW hardness at individual waterworks. Overall, there has been a decrease in the proportion of public waterworks supplying extremely hard, very hard and hard water, and an increase in the proportion of medium hard and fairly hard DW (Fig. 2). Following the de-regulation (see Section ‘Background information’), there were on average 1540 waterworks with DW hardness data (2018–2022), which is c. 200 waterworks less than in the period 2013–2017 (n = 1765).

Fig. 2 Drinking water hardness at public waterworks in Denmark. Vertical dashed line shows when Ca, Mg and total hardness were de-regulated (see text for details). X-axis is limited to 1950–2023 as there are very few waterworks with data in the period 1900–1950. Sampling and reporting of data for 2023 was incomplete because the data were downloaded in September 2023. Data available in Supplementary Files S4 (Annual_hardness_public_waterworks.csv).
Data set 2
Data set 2 (Fig. 3) contains annual DW hardness at the WSAs of public waterworks in Denmark (n = 3571) between 1978 and 2023 (see Supplementary File S2 for a description of the contents). The period is limited due to WSA availability from 1978. Data set 2 can be used in exposure assessments by spatially linking it to geocoded households to estimate the proportion of households in each hardness class and how these proportions have changed through time. Figure 3 shows change in WSAs per hardness class. Note that the WSAs are of different sizes, and the number of households within WSAs is not equal. In the 5-year period following the de-regulation (2018–2022), there were on average 1490 WSAs with hardness estimates, while in the preceding period (2013–2017) there were 1779 WSAs. However, there were still WSAs with missing annual DW hardness estimates in the period 2013–2017.

Fig. 3 Drinking water hardness at the water supply area (WSA) of public waterworks (1978–2023). The vertical dashed line shows when Ca, Mg and total hardness were de-regulated (see text for details). Data available in Supplementary Files S4 (Annual_hardness_WSA.csv).
Data set 3
Data set 3 (Fig. 4) contains the most recent available information about DW hardness at the WSAs of public waterworks (see Supplementary File S2 for a description of the contents). These data can be used for visualisation purposes in GIS or in online viewers. Data set 3 differs from Data set 2 because it only includes one value per WSA – the most recent one – while Data set 3 includes all annual data at the WSA. Figure 5 shows the corresponding year for each WSA. The most recent annual hardness estimates for 66% (n = 1677) of WSAs are for 2022 or 2023, and 34% (n = 883) for the period between 1980 and 2021. The distribution of WSAs in each hardness class is as follows: very soft 0.6%, soft 9.5%, medium hard 25.7%, fairly hard 43.1%, hard 18.8%, very hard 2.1% and extremely hard 0.1%. This shows that most Danish WSAs (by number) are supplied with fairly hard to hard water. There is substantial uncertainty in the abstraction volumes due to the gap-filling procedures used, but roughly 65% of the abstracted water (by volume) falls into fairly hard to hard categories. More meaningful results could be obtained if the proportion of supplied households were used instead, but that was out of the scope of this article.

Fig. 4 Drinking water hardness at the water supply area (WSA) of public waterworks in Denmark, according to the most recently available data between 1980 and 2023. Data extracted from the Jupiter database 6 September 2023. Data available in Supplementary File S6.

Fig. 5 Most recently available drinking water (DW) hardness estimates at the water supply area (WSA) of public waterworks in Denmark. (A) map of data distribution in Denmark. (B) histogram showing the number of WSAs and the latest year when DW hardness data are available. Data available in Supplementary File S7.
Summary
DW hardness may vary locally and temporally. The three aggregated data sets reported here are meant to be used for regional or national scale overviews and assessments. The chosen methodology is currently the optimal way to make an overview of DW hardness at different scales in Denmark. However, due to the limitations listed here and in Schullehner (2022) concerning the actual WSAs, DW quality and abstraction volumes, we recommend contacting the water utility companies if current information is needed about the hardness of the tap water for a specific consumer.
Acknowledgements
The authors would like to acknowledge the feedback about de-regulation of Ca, Mg and total hardness, which we received at the Danish Water Forum 2024.
Additional information
Authors’ contributions
DDV: Data curation, Formal analysis, Software, Methodology, Visualization, Writing – original draft, Writing – review & editing
CTT: Data curation, Methodology, Software, Writing – review & editing
LAOL: Data curation, Software, Writing – review & editing
NC: Formal analysis, Software, Writing – review & editing
LTS: Funding acquisition, Methodology, Validation, Writing – review & editing
BPJ: Funding acquisition, Methodology, Project administration, Writing – review & editing
BGH: Methodology, Validation, Writing – review & editing
Additional files
A collection of seven files and 3 compressed data set files are available to download with this article at https://doi.org/10.22008/FK2/NLX5SX. Supplementary File S1 – Supplementary_Materials.docx. Supplementary File S2 – Readme.txt. Supplementary Files S3 (set of files containing input data: input1.csv, input2.csv). Supplementary Files S4 (set of csv files containing data sets 1, 2, and 3: Annual_hardness_public_waterworks.csv, Annual_hardness_WSA.csv, Latest_hardness_WSA.csv). Supplementary Files S5 (set of files containing shape file for data set 1). Supplementary Files S6 (set of files containing shape file for data set 2). Supplementary Files S7 (set of files containing shape file for data set 3).
Data set disclaimer
GEUS shall not be held liable for any loss or damage, whether direct or indirect, because of the use of the hardness data sets. It is recommended that users obtain additional information from the relevant utilities before taking decisions regarding water hardness.