RESEARCH ARTICLE
Transport of nitrate-containing groundwater to coastal areas through buried tunnel valleys, Denmark
Peter B.E. Sandersen*1 , Hyojin Kim2, Rasmus Jacobsen2, Jesper B. Pedersen3, Birgitte Hansen2
1Department of Near-Surface Land and Marine Geology, Geological Survey of Denmark and Greenland, Aarhus, Denmark. 2Department of Geochemistry, Geological Survey of Denmark and Greenland, Copenhagen, Denmark. 3HydroGeophysics Group, Department of Geoscience, Aarhus University, Aarhus, Denmark
Citation: Voutchkova 2023: GEUS Bulletin 53. 8351. https://doi.org/10.34194/geusb.v53.8351
Copyright: GEUS Bulletin (eISSN: 2597-2154) is an open access, peer-reviewed journal published by the Geological Survey of Denmark and Greenland (GEUS). This article is distributed under a CC-BY 4.0 licence, permitting free redistribution, and reproduction for any purpose, even commercial, provided proper citation of the original work. Author(s) retain copyright.
Received: 17 Apr 2023; Revised: 31 July 2023; Accepted: 10 Aug 2023; Published: 27 Nov 2023
Competing interests and funding: The authors declare no competing interests
The Mapfield Project ‘Field scale mapping for targeted N-regulation and management’ was funded by the Danish Innovation Fund (Award number 8855-00025).
*Correspondence: [email protected]
Keywords: submarine groundwater discharge, redox modelling, buried tunnel valleys, nitrate in groundwater, nitrogen flux to the marine environment
Abbreviations
a.s.l.: above sea level
b.l.s.: below land surface
b.s.l.: below sea level
C–Q: nitrate concentration–discharge
DOI: depth of investigation
GEUS: Geological Survey of Denmark and Greenland
N: nitrogen
OFG: offshore fresh groundwater SGD: submarine groundwater discharge
TEM: Transient Electromagnetic tTEM data: towed Transient Electromagnetic
Edited by: Julian Koch (GEUS, Denmark)
Reviewed by: Theis R. Andersen (VIA University College, Denmark) and Erwin Racasa (University of Rostock, Germany)
Abstract
Nitrogen impact on the aquatic environment, including coastal areas, is too high in many countries worldwide, particularly in areas with intensive agriculture. Efficient mitigation initiatives demand that important pathways and the fate of nitrate in the hydrological cycle are known. In this study, we focus on groundwater nitrate contamination in two near-shore catchment areas in north-west Denmark. Groundwater in the area is mainly located in buried tunnel valleys, which are subsurface structures eroded by meltwater during Pleistocene glaciations in former glaciated areas. Groundwater samples from the aquifers inside the buried valleys reveal the presence of up to 120 mg/l nitrate down to 10 m below sea level and about 1 km down from the stream outlet towards the coast. We interpret the complex tunnel-valley infill to be responsible for the spatial heterogeneity of the groundwater geochemistry, where sandy geological windows create localised hydraulic pathways and complex redox structures. Groundwater and stream water chemistry in the study area clearly demonstrate the role of groundwater in nitrate transport within the catchment as well as the direct pathway to the coast bypassing the stream and riverine systems. Our results show that the buried tunnel valleys potentially contribute to submarine groundwater discharge and therefore could be responsible for a hitherto unaccounted input of nitrogen to the marine environment.
1. Introduction
Eutrophication of sea waters is a global phenomenon, due to nitrogen (N) enrichment that mainly stems from inland riverine systems (e.g. DEFRA 2016). Anoxic dead zones, which are considered a key stressor on marine ecosystems, can be the consequence (Diaz & Rosenberg 2008). Nitrogen pollution to coastal zones around the world originates from different terrestrial sources, such as waste water, atmospheric fixation and deposition, livestock manure and fertiliser application (Erisman et al. 2011). The implementation of Danish national action plans since the mid-1980s for the reduction of N losses has successfully reduced the impact of N on the aquatic environment (Dalgaard et al. 2014; Hansen et al. 2017). However, Denmark still has a relatively high level of agricultural N loss, surpassed only by a few areas in Europe, such as in the Netherlands and the Po Valley in Italy (De Vries et al. 2011).
To achieve the goals of the EU water framework directives, losses of N must be reduced, especially to coastal areas. This is true for the case study presented in this paper where mitigation actions are needed to considerably reduce the N impact on Skive Fjord, Denmark, according to the recently published Water Plans for 2021–2027 (Danish Environmental Protection Agency 2023).
Nitrate (NO3–) in groundwater, surface water, the riparian zone and the sea floor can be reduced or retained (Lutz et al. 2020). Especially the long-term capacity of riparian zones in regulating groundwater nitrate fluxes is not well understood (Hill et al. 2014). Nitrate removal in some riparian zones may be absent or minimal because deeper groundwater flow paths may not interact with nitrate-reducing minerals and organic matter (Hill 2019). However, N flux to the marine environment might not be limited to output via streams and rivers. Several studies suggest that transport of N to the marine environment via submarine groundwater discharge (SGD) can be substantial (e.g. Bishop et al. 2017; Duque et al. 2019; Taniguchi et al. 2019; Szymczycha et al. 2020), and its contribution to the local N budget may be much greater in geologically complex settings where fractures or preferential flow pathways can create hotspots or point sources of N fluxes (Santos et al. 2021). A quantification of the amount of SGD under such geological settings, therefore, is challenging because in addition to direct measurements of groundwater flow, it requires detailed geological and hydrological models for both onshore and offshore (e.g. Haider et al. 2015). Likewise, assessments of the subsurface redox conditions are needed to determine where nitrate reduction takes place (Hansen et al. 2021; Kim et al. 2021). Therefore, modelling of geology, hydrology and geochemistry, along with calculations of the magnitude of the SGD and the amount of N transported to the coast is needed to evaluate the impact on the coastal environment.
Because the landscape and the near-surface geology of Denmark are highly affected by the ice sheets and their meltwater during the Pleistocene (e.g. Houmark-Nielsen 2011), the complex geological setting generally calls for advanced hydrogeological and redox modelling in order to map the groundwater flow paths and the fate of N (Kim et al. 2019, 2021). Buried tunnel valleys are structures that have a high impact on the geological architecture of the subsurface (Jørgensen & Sandersen 2006; Sandersen & Jørgensen 2017). Most of these structures were formed as tunnel valleys eroded by high-pressure meltwater underneath the Pleistocene glaciers. After formation, the valleys were filled with predominantly glacial tills and meltwater sediments (Sandersen & Jørgensen 2003). Being up to 400 m deep and on average 1–1.5 km wide, buried valleys have been found to significantly impact the groundwater flow (e.g. Sandersen & Jørgensen 2003; Andersen et al. 2013). Several valleys are found close to the coastline (see Sandersen & Jørgensen 2022) and a few have been interpreted to cross the coastline (e.g. Haider et al. 2015; Andersen et al. 2016). In one example, it has been shown that groundwater in inferred buried onshore channels connects with shoreface sediments carrying nitrate to the coastal zone (Andersen et al. 2007). In combination, these studies show a potential for buried valleys in enabling or enhancing preferential flow of groundwater across the coast, bypassing nitrate reduction zones in, for example, the riparian zones and thus transporting nitrate directly to the marine environment.
In this paper, we present results from a multidisciplinary study on nitrate transport in the uppermost 40 m of the subsurface in a near-shore area on the Salling peninsula, north-west Denmark. Here, large and deep as well as narrow and shallow buried tunnel valleys close to the shore are mapped in high detail. Our study hypothesises that these mainly sand-filled and gravel-filled tunnel valleys play an important role as preferential pathways of nitrate to the coastal ecosystem, thereby increasing the risk of eutrophication.
2. Site description
2.1. Topography
The study area comprises the two adjacent catchments of the streams Hulebro Bæk (study site 1; 11.3 km2) and Hagens Møllebæk (study site 2; 27.6 km2) located on the Salling peninsula in the north-western part of Jylland (Fig. 1). The topography is highest to the north and in the south-west with elevations up to 40–50 m above sea level (a.s.l.), sloping down to below 20 m a.s.l. in the central and southern parts of the study area (Fig. 1a). The two streams cut through the terrain in an overall south-easterly direction towards Skive Fjord (Fig. 1) – a fjord that is generally 3 to 4 km deep, but up to 5 m deep in places and that constitutes a southern branch of the larger Limfjorden farther north. Limfjorden has connections to the Kattegat to the east and the North Sea to the west (Fig. 1).

Fig. 1 Overview of the study area catchments. The northern catchment of Hulebro Bæk (study site 1, 11.3 km2) and the southern catchment of Hagens Møllebæk (study site 2, 27.6 km2) are shown. a: Elevation in m a.s.l. b: Surface geology (from Jakobsen et al. 2022). c: Location of geochemical sampling points (P1, P1a, P4, P4a, P5, P6 and P7). d: Areas covered by the tTEM soundings survey.
2.2. Geological setting
The pre-Quaternary sedimentary succession relevant for this study consists of Palaeogene clays with thin layers of Miocene mica sand, overlain by silt (Rasmussen et al. 2010). The overlying Quaternary succession varies in thickness from less than 10 m to more than 120 m and is dominated by tills and meltwater deposits. The study area is characterised by a clay-dominated moraine landscape from the Weichselian glaciation with occurrences of postglacial freshwater deposits in low-lying areas. Several ice advances have previously covered the area, resulting in a complex Quaternary succession (Houmark-Nielsen 2011).
The valley system previously mapped in the study area comprises two valleys with a N–S- and NNE–SSW-orientation and an older generation of valleys with a WNW–ESE-orientation (Fig. 2a). The valleys are mainly eroded into Palaeogene clay-dominated sediments (down to 100 to 150 m below sea level [b.s.l.]). According to borehole data, the buried valleys are filled with successions of Quaternary clay tills, meltwater sand and meltwater clays. All valleys are now completely buried and not directly recognisable in the present-day landscape (Sandersen & Jørgensen 2016b).

Fig. 2 Geophysical data and geological interpretations. (a) Buried valleys mapped prior to the present study (Sandersen & Jørgensen 2016a, b, 2017). (b) Buried valleys mapped using the tTEM method. Interpreted from tTEM 3D grid slices, with mean resistivity slices at 2 m a.s.l. (see resistivity scale in figure legend). (c) A south–north-orientated cross-section through the 3D tTEM resistivity grid superimposed with geological interpretations from boreholes. BV: buried valley.
2.3. Climate and agriculture
The agricultural area in Denmark spans about 61% (2022) of the country’s total area of 42 951 km2. The climate is costal temperate with a mean temperature of 9.1°C, and an average precipitation of 781.7 mm per year as reported by the Danish Meteorological Institute for the years 2011–2020 (DMI 2023). The study area is dominated by agricultural fields (c. 88%), whilst buildings (c. 10%) and nature (c. 2%) occupy smaller parts of the area (Levin et al. 2014). Both sandy and clay-rich soil types are found within the study area (Adhikari et al. 2013) with a relatively low content of organic matter (<6%; Adhikari et al. 2014). The crop types are mainly cereals and to a lesser extent permanent grass, and dairy, pig and arable farming types are abundant (Danish Agricultural Agency 2018).
3. Data and methods
3.1. Drillings and lithological descriptions
In this study, a drilling campaign operated by the Ejlskov company was carried out to collect lithology and water chemistry samples at seven locations in November 2021. The lithology samples were collected using a Geoprobe direct push method (DT-22), and the groundwater samples were collected using a modified Geoprobe SP16 groundwater sampler (shorter screen, i.e. 0.25 m) and a peristaltic pump.
Older borehole data have been extracted from the freely accessible National Borehole Archive Jupiter hosted by GEUS (GEUS 2022; Hansen & Pjetursson 2011).
3.2. Geophysical surveys
Two types of geophysical TEM (Transient Electromagnetic) data were used in this study: (1) tTEM (towed TEM) soundings data (Auken et al. 2019; Aarhus University 2021) with a line spacing of 25 to 60 m shown in black on Fig. 1d, and (2) TEM40 (ground-based TEM) soundings data (Christiansen et al. 2006). The TEM40 data are not included in Fig. 1d. The TEM method uses a transmitter coil to emit a current, which gives rise to a magnetic field. The current is then rapidly turned off, resulting in a decrease of the magnetic field, which, in turn, gives rise to a secondary magnetic field decaying over time. The rate of decay is measured in a receiver coil, which provides the resistivity of the subsurface. Clay deposits are characterised by slow decays due to the conductive nature of the material, whereas sand or gravel layers, which are characterised by a high resistivity, will have fast decays.
The two systems have different spatial resolutions and depths of investigation: tTEM provides high-resolution images of the uppermost 70 m (Auken et al. 2019), whereas the depths of investigation for the TEM40 system range from 200 to 300 m. As a result of this and in combination with the generally denser data coverage, highly detailed mapping of the near-surface geology is possible (Sandersen et al. 2021). All TEM systems are based on the time-domain electromagnetic method and measurement of the conductivity of the subsurface layers (Danielsen et al. 2003). The method therefore provides information of the resistivity distribution of the sedimentary succession (Sørensen & Auken 2004).
3.3. Stream discharge and water chemistry
The stream discharge and nitrate concentrations were extracted from the public database ODA (https://odaforalle.au.dk). For streams, water chemistry monitoring focuses only on nutrient compounds, such as nitrate, nitrite and phosphate. In both catchments, discharge and stream chemistry were monitored at the outlet of the catchment (Fig. 1a). In Hulebro Bæk, stream discharge has been measured daily since 1989, and nitrate concentration has been monitored at monthly (dry season) to bi-weekly (wet season) intervals since 1984. In Hagens Møllebæk, discharge and stream water chemistry were monitored since 2020 (daily) and 2017 (bi-weekly to monthly), respectively.
3.4. Groundwater chemistry
The groundwater chemistry data were extracted from the Jupiter database. In this study, the focus is on major cations (Ca2+, Mg2+ and Na+), anions (Cl–, NO3– and SO42–), pH and the groundwater alkalinity. Groundwater chemistry information was available from 48 boreholes (Fig. 1c) within a depth range from 3 to 157 m b.l.s. (below land surface). The groundwater chemistry in these boreholes has been monitored periodically since 1951, and the data availability varied from 1 to 5 measurements per borehole. This study includes all the available measurements. Except for nitrate, concentrations of major cations and anions are expressed in mM. Stoichiometric ratios of these elements are used to infer underlying processes. Nitrate, however, is shown in mg/l because the standard for groundwater and drinking water is 50 mg/l of nitrate according to Danish and European legislation (vs. 0.8 mM), and nitrate concentrations below 1 mg/l (vs. 0.016 mM) are considered reduced conditions. Thus, it is more intuitive to express nitrate in mg/l.
3.5. Visualisation and interpretation of data
The tTEM soundings are visualised with low resistivities being blue to green and high resistivities being red to purple (see Fig. 2). The DOI (depth of investigation) shown in Fig. 2c illustrates the maximum depth at which the tTEM models can be considered reliable (Christiansen & Auken 2012). Based on the tTEM data, a 3D grid and a series of horizontal 2 m mean resistivity slices were made. The map in Fig. 2b shows a selected resistivity slice at 2 m a.s.l., and Fig. 2c shows a selected vertical cross-section through the 3D resistivity grid and selected boreholes. The TEM40 data were used as single soundings to support the geological interpretations of the tTEM data and are not visualised on the profile.
The borehole data and the geophysical data were imported into the 3D geological modelling tool GeoScene3D, enabling joint interpretations of the geological and geophysical data within the 3D model space (see Figs 2b and c).
4. Results
4.1. Geology
4.1.1. The pre-Quaternary succession
The tTEM mapping has confirmed the widespread presence of low resistive sediments with resistivities below 10–12 ohm-metre, in boreholes described as Palaeogene clay. On top of this clay, sporadic sandy and clayey Neogene sediments are found. The elevation of the top of the pre-Quaternary sediments varies from 20 m a.s.l. to deeper than 100 m b.s.l. (Fig. 2c), mainly due to erosion during the Quaternary.
4.1.2. The Quaternary succession and buried valleys
The tTEM survey has added more detail to the uppermost 50 to 70 m of the subsurface and has especially enhanced the picture of the buried valleys in the area (Sandersen & Kallesøe 2021). The deep and broad buried valleys that were earlier mapped primarily with TEM40 and boreholes (see Fig. 2a) were confirmed with the tTEM survey. In addition to these valleys, several narrow and shallower valleys are mapped with tTEM (Figs 2b and c).
A large N–S-orientated buried valley is seen on the horizontal mean resistivity slice 2 m a.s.l. in Fig. 2b (labelled BV-E) as generally high resistivities (mainly red to yellow colours) surrounded by low resistivities (blue colours). The valley is clearly seen to the right on the cross-section in Fig. 2c, where sandy and clayey Quaternary sediments represent the infill of the c. 2 km wide structure eroded to depths below 100 m b.s.l. The valley is surrounded by the Palaeogene clays showing very low resistivities. The presence of the valley below the tTEM DOI is confirmed by TEM40 and boreholes. The data show that the deep parts of the valley (below c. 10 m b.s.l.) are divided into two parts, one dominated by clay and the other by sand, represented by low and high resistivities, respectively (Fig. 2c). According to borehole data, the sediments consist of meltwater sands and clays. Between c. 10 m b.s.l. and c. 30 m a.s.l., the tTEM shows a 10–20 m thick low-resistive layer. The clay, generally interpreted as meltwater clay in borehole data, has a wavy appearance and is apparently confined to the valley. Above the clay, there is a succession of meltwater sand or gravel irregularly covered with clayey till. According to previous investigations, the buried valley structure continues southwards to the coast of Skive Fjord (Fig. 2a).
A WNW–ESE-orientated buried valley in the central part of the study area is also around 2 km wide eroded no deeper than c. 60 m b.s.l. (labelled BV-C in Fig. 2). The infill is dominated by high resistivities representing meltwater sand and gravel. Above sea level, clay layers are found occasionally. Along sections of the northern valley flank, a 500–700 m wide high-resistivity structure can be observed from the terrain surface and down to c. 10 m b.s.l. The structure is split into a NW–SE segment and a WSW–ENE segment (BV-D in Fig. 2b). At elevations higher than the resistivity slice shown in Fig. 2b, another narrow high-resistivity structure is present above and with the same orientation as the deep, broad valley. Both valleys are labelled BV-D on the cross-section in Fig. 2c. According to previous investigations, the buried valley structure continues eastwards to the coast of Skive Fjord (Fig. 2a).
To the south, two narrow high-resistive structures with an overall WSW–ENE orientation can be seen (Fig. 2b). The northern of the two, BV-B, is 200–400 m wide, eroded down to 20 m b.s.l. and generally filled with high resistivity layers corresponding to sand. The deepest parts of the valley are eroded down to 50–60 m b.s.l. into the low-resistive Palaeogene clays. The southern valley, BV-A (Fig. 2b and c), appears to be two to three separate erosions, just 200 to 300 m wide, which merge eastwards to create a single valley trace. The tTEM soundings map the southernmost valleys (BV-A) all the way to the coastline of Skive Fjord, whereas the valley BV-B, just to the north, is mapped as close as 800 m from the coast.
Most of the buried valleys in Denmark are formed as buried valleys eroded by meltwater flow underneath the Pleistocene ice sheets (Jørgensen & Sandersen 2006). The valleys mapped in this study area are no exception. The tTEM mapping has revealed an additional system of younger, narrower and shallower buried valleys in the upper part of the subsurface (Fig. 2b; valleys BV-A, BV-B and BV-D). As seen on the cross-section in Fig. 2c, these valleys are filled with high-resistive sediments dominated by meltwater sand and gravel, which are only sporadically covered by low-resistive clayey sediments.
All of the buried valleys in the area are several kilometres long and have been mapped very close to the shore of Skive Fjord to the east.
4.2. Nitrate concentration–discharge relationships
The nitrate concentration–discharge (C–Q) relationships of both catchments show positive slopes up to a specific discharge of 1 mm/day and then negative slopes at higher discharge, likely due to dilution at extreme rainfall events (Fig. 3). However, the nitrate concentrations at baseflow were much higher in Hulebro Bæk (c. 2.0 mg/l) than in Hagens Møllebæk (c. 5 mg/l). In addition, the positive slope of the C–Q relationship was much steeper in Hulebro Bæk compared to that of Hagens Møllebæk (Fig. 3). At Hulebro Bæk, the long-time series of nitrate data (1984–2020) reveals a clear reduction in stream nitrate concentrations, likely due to N regulation of agriculture since the 1980s.

Fig. 3 Nitrate concentration–discharge (C–Q) relationships of the study catchments. The sampling year of the stream chemistry is shown in colour.
4.3. Groundwater chemistry
The boreholes holding groundwater chemistry data were divided into groups representing the individual buried tunnel valleys (Fig. 4). In all the valleys, groundwater is reduced (i.e. nitrate concentration <1 mg/l) at around 30 m b.l.s., roughly corresponding to sea level, except for groundwater in BV-C. At shallow depths (<30 m b.l.s.), nitrate concentrations in the BV-E valley showed the largest variability (0–100 mg/l) compared to concentrations elsewhere (Fig. 4). Groundwater nitrate in BV-C and BV-A increased with increasing depth (Fig. 4). For instance, nitrate concentrations in groundwater from valley BV-C displayed 120 mg/l at around 30 m b.l.s. or at sea level, which is the highest concentration amongst all the groundwater chemistry measurements. Groundwater from valley BV-D showed moderately high nitrate concentrations, which decreased with increasing depth.

Fig. 4 Nitrate concentration in groundwater. On the map (a), the average of all existing data of each borehole is shown in colour. Nitrate concentrations of groundwater are shown as a function of sampling depth (b) and elevation (c).
The concentrations of Ca2+ + Mg2+ in all groundwater samples varied between 2 and 4 mM, and those of HCO3– were 0.2–5 mM (Fig. 5). The SO42– concentrations ranged between 0.1 and 1.8 mM (Fig. 5). Those of Na+ and Cl– were 0.6–3.2 mM and 0.7–2.4 mM, respectively. Groundwater pH varied between 7 and 8 (Fig. 5), except for one case in valley BV-C (pH = 5.77, not shown in the figure).

Fig. 5 Major cation and anion concentration of groundwater in buried tunnel valleys. Valleys BV-A, BV-C, BV-D and BV-E are shown as triangles, circles, diamond, and squares, respectively. The colours of the markers represent nitrate concentrations.
5. Discussion
5.1. Nitrate pathways from land to coast via streams
The C–Q relationships provide valuable information about stream water and solute transport at the catchment scale (Godsey et al. 2009; Kim et al. 2017, 2021; Bieroza et al. 2018). The differing C–Q relationships in the two catchments indicate that nitrate is transported via different pathways from the agriculture fields to the stream outlets. The lower nitrate concentration at baseflow and the steeper slope of C–Q in Hagens Møllebæk compared to those of Hulebro Bæk can be interpreted as a limited contribution of groundwater to outlet (Fig. 3). During baseflow, the stream Hagens Møllebæk may be fed by the groundwater in the riparian zone; thus, it likely contains very low nitrate. The steep slope of the C–Q relationships of Hagens Møllebæk implies that nitrate is primarily transported via shallow subsurface pathways such as drains, interflow or overland flow in this system. The surface geology of the Hagens Møllebæk catchment, which is predominantly clayey till, supports this interpretation (Fig. 1b).
In Hulebro Bæk, groundwater appears to be significant in transporting nitrate to the stream. Valley BV-C intersects with the Hulebro Bæk outlet (Fig. 2), and the groundwater in this buried valley is oxic with nitrate concentrations exceeding 100 mg/l (Fig. 4). This oxic, nitrate-containing groundwater may discharge into the stream year-round, resulting in higher nitrate concentration during baseflow and also the gentle slope of the C–Q relationship shown in Fig. 3. In addition, this catchment is covered with sandy till, and the subsurface contains meltwater sand and gravel, which explains the deeper percolation of nitrate containing groundwater directly discharging to the stream (Figs 1b and 2). Thus, in this catchment, shallow subsurface flow appears to play a minor role in delivering nitrate to the stream.
5.2. Nitrate pathways from land to coast bypassing the stream outlets: the role of buried tunnel valleys
The groundwater and stream chemistry observations of Hulebro Bæk clearly demonstrate an important role of groundwater for nitrate transport within the catchment. This implies that groundwater may be a direct pathway to the near-coast waters, bypassing the stream as well. Along valley BV-C, for instance, groundwater containing up to 120 mg/l of nitrate was found far from any stream outlet and very near the coast, and this groundwater is present 2–10 m b.s.l. The biogeochemical evolution of nitrate discharging via groundwater to the sea floor is spatially complex and temporally dynamic (e.g. Kroeger & Charette 2008); however, various studies have documented that SGD should be part of the nitrate budget of the coastal ecosystems (Andersen et al. 2007; Luijendijk et al. 2020; Brookfield et al. 2021).
The spatial heterogeneity of SGD is one of the biggest challenges in quantifying its contribution to biogeochemistry of coastal ecosystems (Kroeger & Charette 2008; Luijendijk et al. 2020). In this study, we found a high degree of spatial heterogeneity. In valleys BV-C and BV-D, groundwater chemistry showed a signature of pyrite oxidation by oxygen as in Eq. (1), coupled with carbonate dissolution by sulfuric acid as in Eq. (2). This results in SO42–/(Ca2+ + Mg2+) of c. 0.5 and HCO3–/( Ca2+ + Mg2+) of c. 1 (Fig. 6; Appelo & Postma 2005):

Fig. 6 Ratios of HCO3– / (Ca2+ + Mg2+) vs. SO42– / (Ca2+ + Mg2+) and Na+ / Cl– of groundwater in the buried tunnel valleys. Nitrate concentrations of each groundwater sample are shown as colours.


The pyrite content, however, may be insufficient to reduce nitrate. These two buried valleys are primarily filled with sand without protective clay layers (Fig. 2), and therefore, it is possible that the infill of these buried valleys is more weathered and thus depleted of reduced compounds, that is, pyrite or reactive organic matter, than those of the other buried valleys.
In valley BV-E, which is the largest and deepest buried valley in the study catchment, the groundwater chemistry varies widely. The nitrate containing groundwater of BV-E shows similar signatures as those of valleys BV-C and BV-D, except for two cases of high nitrate concentrations (SO42–/(Ca2+ + Mg2+) of c. 0.1), which probably represent young oxic groundwater with a relatively low sulphate content due to a decrease in atmospheric deposition and absence of pyrite oxidation (Fig. 5). We conclude that the upper oxic part of valley BV-E does not contain reduced compounds reactive enough to remove all the oxygen and initiate nitrate reduction.
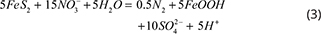
However, many, mostly deeper, groundwater samples were nitrate-free in valley BV-E (Fig. 4). This groundwater shows a high variability: SO42–/(Ca2+ + Mg2+) ranges between 0.1 and 0.5, and HCO3–/(Ca2+ + Mg2+) ranges between 1 and 3 (Fig. 6). Complete pyrite oxidation by nitrate reduction is defined in Eq. (3). Followed by carbonate dissolution, this will result in SO42–/(Ca2+ + Mg2+) = 2 and HCO3–/( Ca2+ + Mg2+) = 1 (Appelo & Postma 2005):
These stoichiometric ratios were not observed in our catchments; thus, we conclude that pyrite oxidation may not be responsible for the nitrate-free conditions. Instead, we attribute these conditions to the complex geological structure of valley BV-E. In BV-E, the clay layers protect the groundwater from nitrate contamination, but because they are deformed, sandy geological windows most likely result in localised hydraulic pathways resulting in complex redox structures. The nitrate-free groundwater in valley BV-E may be well protected by the clay layers, whilst the oxic groundwater in BV-E may be related to sandy geological windows. The increase of HCO3–/(Ca2+ + Mg2+) above 1, which is positively correlated to Na+/Cl–, may support this hypothesis (Fig. 6). We attribute this positive correlation to cation exchange between Ca2+ in groundwater and Na+ in the salt-saturated marine sediments. The sediments of the protected areas may not be in equilibrium with the fresh groundwater because they have not been exposed to influx of enough fresh groundwater.
Especially in areas where buried valleys are eroded into high-lying, clay-dominated substrata and filled with coarse-grained sediments, groundwater flow will predominantly take place within the buried valleys. Several deep and shallow buried valleys are mapped within the study area. Infill ranges from disturbed layers of heterogeneous sandy, gravelly and clayey layers to an apparently homogeneous infill of sand and gravel (Fig. 2). Because the Palaeogene clays outside the valleys can be found very close to the terrain surface, the groundwater flow will be focused in the hydraulically transmissive infill of the buried valleys. To the east in the study area where the valleys are very close to the coast, the groundwater flow will be towards the coast within the buried valleys. The focused flow results in high local fluxes implying that the groundwater emanates through the seabed with relatively high velocities so that nitrate reduction in the seabed may not be fast enough to remove all nitrate before it enters the sea. If the valleys terminate at the coast, for instance, due to later erosion, groundwater discharge will take place along the shore. However, if the valleys continue underneath the seabed, SGD may take place at some point offshore, depending on the transmissivity of the seabed. Due to a lack of offshore data, the extension of the buried valleys underneath Skive Fjord is unknown. However, the onshore geophysical mapping and the general knowledge of buried valleys in Denmark make it highly likely that the valleys have continuations under the fjord.
For SGD to occur, the valley aquifers need to be ‘leaky’. Where, on the other hand, deep groundwater within the buried valley has a clayey seal that prevents salinisation, fresh groundwater within the valley infill could potentially form an overlooked resource of offshore groundwater (referred to as offshore fresh groundwater, OFG; Micallef et al. 2020; Zamrsky et al. 2022).
5.3. Buried valley occurrence and impact on the subsurface architecture
The map in Fig. 7 shows the current knowledge of the location of buried valleys in Denmark based on interpretations of TEM data primarily in combination with borehole data (Sandersen & Jørgensen 2022). Although only c. 50% of the onshore area is mapped with TEM, Fig. 7 shows many valleys close to the coast. Based on comparisons between onshore and offshore tunnel valleys in the Danish North Sea, Andersen et al. (2012) concluded that valley morphologies on both sides of the shoreline were comparable, and as today’s coastline does not constitute a natural limit for the extension of the buried valleys, it is highly likely that many of the Danish onshore valleys extend offshore.

Fig. 7 Buried valleys in the Danish subsurface mapped 2021 (data from http://buriedvalleys.dk/; Sandersen & Jørgensen 2022). Green lines mark the location and orientation of the mapped valleys.
Buried valleys in Denmark are infilled with mainly tills and meltwater sediments. Rough calculations based on borehole lithologies show that around 40–75% of the infill is composed of meltwater sand and gravel, with the remaining part of the infill consisting of silty and clayey meltwater sediments and tills (Sandersen & Jørgensen 2003). Because the tunnel valleys are eroded deeply into the subsurface and generally have heterogeneous infill, the impact on the architecture of the subsurface is generally significant (Sandersen & Jørgensen 2017). The coarse-grained meltwater sediments often constitute important, deep-seated aquifers, but due to the erosive nature of the valleys and the typically heterogenic infill, the groundwater resources are generally vulnerable to contaminants from the surface (Sandersen & Jørgensen 2003).
5.4. Structural analogies and perspectives
The buried valleys represent geological structures that are expected to expand beyond the coastline, and the aquifers contained within them therefore constitute a part of the present-day hydrological cycle. This implies a continuous flow of fresh groundwater and a flux of dissolved compounds to coastal areas through the valley sediments. Potential flow of nitrate-containing groundwater directly to the coastline and the sea floor, by-passing the riparian zone, is currently not considered in Danish nitrogen budgets in the water plans for the protection of the aquatic environment. Nitrate is the major form of N in groundwater. However, it might be converted to reduced forms when discharging through the seabed depending on the balance between flow rates and nitrate reduction rates (Andersen et al. 2007). Measurement of the total N content in the bottom water column below the halocline of the inner fjord has shown that this could be a considerable source of N for biological production creating oxygen deficiency in the summer period (Gertz et al. 2018). Direct contributions of nitrate to the near-coastal environment via groundwater could be significant and might therefore be important for the choice of the right mitigation measures in agricultural areas to reduce the N impact on the marine environment.
Buried tunnel valleys are common both onshore and offshore in former glaciated areas (van der Vegt et al. 2012). Since many are found close to the coastline, their inferred continuations are obvious targets for both SGD and OFG investigations. Other geological structures, which in equal ways may enable or enhance groundwater flow across the coastline, could be fault zones, graben structures and offshore continuations of large aquifers in porous rocks and sediments (e.g. Edmunds et al. 2001; Hinsby et al. 2001; Cantarero et al. 2019; Santos et al. 2021). Outside Denmark, the number of investigations of both SGD and OFG is increasing (see Taniguchi et al. 2019; Micallef et al. 2020). Pertaining to the conditions in Denmark, widespread near-surface chalk and limestone aquifers could also be potential targets for further investigations. In relation to OFG, the buried tunnel valleys potentially represent a renewable groundwater resource that has not previously been considered. This contrasts with the potential OFG resources described by Zamrsky et al. (2022) who regard most fresh offshore groundwater as likely non-renewable resources. This is because, at a global scale, they are mostly located far from the shore and thus interpreted as being detached from inland aquifers.
6. Conclusions
The near-surface geology in the study area is dominated by buried tunnel valleys. New detailed geological mapping has revealed near-surface valleys that are narrower and less deeply eroded in comparison to the previously known valleys. All buried valleys are found very close to the shore of Skive Fjord, indicating that the valleys most likely extend offshore.
Groundwater and stream water chemistry observations in the study area clearly demonstrate the important role of groundwater in nitrate transport within the catchment, and that groundwater in buried valleys may constitute a direct pathway to the coast, bypassing the stream and riverine systems. Groundwater samples from the valley infills revealed that nitrate is present below the sea level within the buried valley infill. Samples with as high as 50–120 mg/l of nitrate were found far from the stream outlet down to 10 m b.s.l. close to the coastline. The complex geological structure of the buried tunnel valleys appears to be responsible for the spatial heterogeneity of the groundwater geochemistry in this area, where sandy geological windows result in localised hydraulic pathways, resulting in complex redox structures. In addition to this, the buried valleys generally control the groundwater flow towards the coast.
Consequently, there is a high risk that N will discharge to the coastal waters of Limfjorden via buried valleys. As such, this flux will represent a N contribution to the environment that is usually not included in estimates of N transported to the inner Danish marine environment. Based on our findings, we therefore suggest that direct groundwater discharge to the coast is included in the N management plans in areas such as these and in comparable geological settings. We also stress the importance of producing subsurface models, which include detailed delineation of geology and geochemistry. Otherwise, calculations of the flux of N to the marine environment will not encompass all sources.
The number of investigations of both SGD and OFG is rising internationally, and with the large number of buried tunnel valleys found in Denmark, there appears to be a potential for further studies, here. To calculate and evaluate actual N fluxes to the shallow marine environment, joint investigations should include detailed onshore and offshore mapping of buried tunnel valleys, groundwater modelling and geochemical investigations of both groundwater and sea water.
Apart from the buried tunnel valleys in former glaciated areas, fault zones, graben structures and offshore continuations of porous sediments with high flow rates and presumably low nitrate reduction rates would also be potential targets for further investigations.
Acknowledgements
We wish to acknowledge the Mapfield Project (Field scale mapping for targeted N-regulation and management), funded by the Danish Innovation Fund (Award number 8855-00025), for allowing us to publish project results. We also acknowledge the Geological Survey of Denmark and Greenland (GEUS) for supporting the publication of the paper. We are grateful for the comments and suggestions provided by the two reviewers. Their suggestions greatly improved the manuscript.
Additional information
Author contributions
PS, HK and BH conceptualised and designed the study. HK, RJ and BH performed the fieldwork and interpretations related to geochemistry. JP performed fieldwork and data processing related to the geophysical data, and PS performed joint interpretations of geophysical and geological data. PS wrote the first draft, and all co-authors contributed with text and/or comments to subsequent versions of the manuscript.
Additional files
None
References
Aarhus University 2021: tTEM Mapping Salling, HydroGeophysics Group, Unpublished Report, 19042021, March 2021.
Adhikari, K., Hartemink, A.E., Minasny, B., Kheir, R.B., Greve, M.B. & Greve, M.H. 2014: Digital mapping of soil organic carbon contents and stocks in Denmark. PLoS One 9(8), e105519. https://doi.org/10.1371/journal.pone.0105519
Adhikari, K., Kheir, R.B., Greve, M.B., Bøcher, P.K., Malone, B.P., Minasny, B., McBratney, A.B. & Greve, M.H. 2013: High resolution 3-D mapping of soil texture in Denmark. Soil Science Society of America Journal 77(3), 860–876. https://doi.org/10.2136/sssaj2012.0275
Andersen, M.S., Baron, L., Gudbjerg, J., Gregersen, J., Chapellier, D., Jakobsen, R. & Postma, D. 2007: Discharge of nitrate-containing groundwater into a coastal marine environment. Journal of Hydrology 336, 98–114. https://doi.org/10.1016/j.jhydrol.2006.12.023
Andersen, T.R., Huuse, M., Jørgensen, F. & Christensen, S. 2012: Seismic investigations of buried tunnel valleys on- and offshore Denmark. In: Huuse, M. et al. (eds): Glaciogenic Reservoirs and Hydrocarbon Systems. London: Geological Society, Special Publications 368. https://doi.org/10.1144/sp368.12
Andersen, T.R., Jørgensen, F. & Christensen, S. 2016: Delineation of tunnel valleys across the North Sea coastline, Denmark based on reflection seismic data, boreholes, TEM and Schlumberger soundings. ASEG Extended Abstracts 2016 1, 1–10. Extended Abstract. https://doi.org/10.1071/aseg2016ab122
Andersen, T.R., Poulsen, S.E., Christensen, S. & Jørgensen, F. 2013: A synthetic study of geophysics-based modelling of groundwater flow in catchments with a buried valley. Hydrogeology Journal 21, 491–503, https://doi.org/10.1007/s10040-012-0924-5
Appelo, C.A.J. & Postma, D. (eds) 2005: Geochemistry, Groundwater and Pollution. Second Edition. London: CRC Press. https://doi.org/10.1201/9781439833544
Auken, E., Foged, N., Larsen, J.J., Lassen, K.V.T., Maurya, P.K., Dath, S.M. & Eiskjær, T.T. 2019: tTEM – A towed transient electromagnetic system for detailed 3D imaging of the top 70 m of the subsurface. Geophysics 84(1), https://doi.org/10.1190/geo2018-0355.1
Bieroza, M.Z., Heathwaite, A.L., Bechmann, M., Kyllmar, K. & Jordan, P. 2018: The concentration-discharge slope as a tool for water quality management. Science of the Total Environment 630, 738–749. https://doi.org/10.1016/j.scitotenv.2018.02.256
Bishop, J.M., Glenn, C.R., Amato, D.V. & Dulai, H. 2017: Effect of land use and groundwater flow path on submarine groundwater discharge nutrient flux. Journal of Hydrology: Regional Studies 11, 194–218. https://doi.org/10.1016/j.ejrh.2015.10.008
Brookfield, A.E., Hansen, A.T., Sullivan, P.L., Czuba, J.A., Kirk, M.F., Li, L., Newcomer, M.E. & Wilkinson, G. 2021: Predicting algal blooms: Are we overlooking groundwater? Science of the Total Environment 769, 144442. Elsevier B.V. https://doi.org/10.1016/j.scitotenv.2020.144442
Cantarero, D.L.M., Blanco, A., Cardenas, M.B., Nadaoka, K. & Siringan, F.P. 2019: Offshore submarine groundwater discharge at a coral reef front controlled by faults. Geochemistry, Geophysics, Geosystems 20, 3170–3185. https://doi.org/10.1029/2019GC008310
Christiansen, A.V. & Auken, E. 2012: A global measure for depth of investigation. Geophysics 4, 77. https://doi.org/10.1190/geo2011-0393.1
Christiansen, A.V., Auken, E. & Sørensen, K.I. 2006: The transient electromagnetic method. In: Kirsch, R. (ed.): Groundwater Geophysics. A Tool for Hydrogeology, 179–224. Berlin: Springer Verlag. https://doi.org/10.1007/3-540-29387-6_6
Dalgaard, T. et al. 2014: Policies for agricultural nitrogen management—trends, challenges and prospects for improved efficiency in Denmark. Environmental Research Letters 9, 115002. https://doi.org/10.1088/1748-9326/9/11/115002
Danielsen, J.E., Auken, E., Jørgensen, F., Søndergaard, V.H. & Sørensen, K.I. 2003: The application of the transient electromagnetic method in hydrogeophysical surveys. Journal of Applied Geophysics 53, 181–198. https://doi.org/10.1016/j.jappgeo.2003.08.004
Danish Agricultural Agency 2018: Internet Field Maps, 2018. https://lbst.dk/landbrug/kort-og-markblokke/markkort-og-markblokke/ (accessed April 2023).
Danish Environmental Protection Agency 2023: Water management plans 2021–2027; The Danish Environmental Protection Agency. https://eng.mst.dk/nature-water/aquatic-environment/water-and-management-plans/ (accessed April 2023).
DEFRA 2016: Implementation of the Nitrate Pollution Regulations 2015 in England. Method for designating Nitrate Vulnerable Zones for waters affected by eutrophication. December 2016. Department for Environment, Food & Rural Affairs Report, 59 p. www.gov.uk/government/publications (accessed April 2023).
De Vries, W. et al. 2011: Geographical variation in terrestrial nitrogen budgets across Europe. In: Sutton, M.A. et al.: The European Nitrogen Assessment 317–344, Cambridge: Cambridge University Press. https://doi.org/10.1017/CBO9780511976988.018
Diaz, R.J. & Rosenberg, R. 2008: Spreading dead zones and consequences for marine ecosystems. Science 321, 926–929. https://doi.org/10.1126/science.115640
DMI 2023: Klimanormaler for Danmark. Referenceværdier (2011–2020). https://www.dmi.dk/vejrarkiv/normaler-danmark/ (accessed April 2023).
Duque, C., Jessen, S., Tirado-Conde, J., Karan, S. & Engesgaard, P. 2019: Application of stable isotopes of water to study coupled submarine groundwater discharge and nutrient delivery. Water 11(9), 1842. https://doi.org/10.3390/w11091842
Edmunds, W.M., Hinsby, K., Marlin, C., Condesso de Melo, M.T., Manzano, M., Vaikmaee, R. & Travi, Y. 2001: Evolution of groundwater systems at the European coastline. In: Edmunds, W.M. & Milne, C.J. (eds): Palaeowaters in Coastal Europe: evolution of groundwater since the late Pleistocene. London: Geological Society, Special Publications 189, 289–311. https://doi.org/10.1144/gsl.sp.2001.189.01.17
Erisman, J.W., van Grinsven, H., Grizzetti, B., Bouraoui, F., Powlson, D., Sutton, M.A., Bleeker, A. & Reis, S. 2011: The European nitrogen problem in a global perspective. In: Sutton, M.A. et al. (eds): The European Nitrogen Assessment 9–31, Cambridge: Cambridge University Press. https://doi.org/10.1017/CBO9780511976988.005
Gertz, F., Thostrup, L.K., Zacho, S.P., Jensen, M.L. & Piil, K. 2018: Miljøtilstanden i Skive Fjord, Lovns Bredning og Risgårde Bredning. SEGES Report, 58 pp. https://www.landbrugsinfo.dk/-/media/landbrugsinfo/public/1/3/1/rapport_miljotilstand_skive_fjord.pdf (accessed December 2018).
GEUS (Geological Survey of Denmark and Greenland) 2022: Jupiter boringsdatabasen. Data set. GEUS Dataverse, V2. https://doi.org/10.22008/FK2/8YYXXN (accessed May 2022).
Godsey, S.E., Kirchner, J.W. & Clow, D.W. 2009: Concentration-discharge relationships reflect chemostatic characteristics of US catchments. Hydrological Processes 23(13), 1844–1864. https://doi.org/10.1002/hyp.7315
Haider, K., Engesgaard, P., Sonnenborg, T.O. & Kirkegaard, C. 2015: Numerical modeling of salinity distribution and submarine groundwater discharge to a coastal lagoon in Denmark based on airborne electromagnetic data. Hydrogeology Journal 23, 217–233. https://doi.org/10.1007/s10040-014-1195-0
Hansen, B., Thorling, L., Schullehner, J., Termansen, M. & Dalgaard, T. 2017: Groundwater nitrate response to sustainable nitrogen management. Scientific Reports 7(1), 8566. https://doi.org/10.1038/s41598-017-07147-2
Hansen, B. et al. 2021: Assessment of complex subsurface redox structures for sustainable development of agriculture and the environment. Environmental Research Letters 16, 025007. https://doi.org/10.1088/1748-9326/abda6d
Hansen, M. & Pjetursson, B. 2011: Free, online Danish shallow geological data. Geological Survey of Denmark and Greenland Bulletin 23, 53–56. https://doi.org/10.34194/geusb.v23.4842
Hill, A.R. 2019: Groundwater nitrate removal in riparian buffer zones: A review of research progress in the past 20 years. Biogeochemistry 143, 347–369. https://doi.org/10.1007/s10533-019-00566-5
Hill, A.R., Devito, K.J. & Vidon, P.G. 2014: Long-term nitrate removal in a stream riparian zone. Biogeochemistry 121, 425–439, https://doi.org/10.1007/s10533-014-0010-2
Hinsby, K., Harrar, W.G., Nyegaard, P., Konradi, P.B., Rasmussen, E.S., Bidstrup, T., Gregersen, U. & Boaretto, E. 2001: The Ribe Formation in western Denmark – Holocene and Pleistocene groundwaters in a coastal Miocene sand aquifer. In: Edmunds, W.M. & Milne, C.J. (eds): Palaeowaters in Coastal Europe: Evolution of groundwater since the late Pleistocene. London: Geological Society, Special Publications 189, 29–48. https://doi.org/10.1144/gsl.sp.2001.189.01.04
Houmark-Nielsen, M. 2011: Pleistocene glaciations in Denmark: A closer look at chronology, ice dynamics and landforms. Developments in Quaternary Science 15, 47–58. https://doi.org/10.1016/b978-0-444-53447-7.00005-2
Jakobsen, P.R., Tougaard, L. & Anthonsen, K.L. 2022: Danmarks digitale jordartskort 1:25000. Version 6.0. Danmarks og Grønlands Geologiske Undersøgelse Rapport 2021/68. https://doi.org/10.22008/gpub/34628
Jørgensen, F. & Sandersen, P. 2006: Buried and open tunnel valleys in Denmark – Erosion beneath multiple ice sheets. Quaternary Science Reviews 25, 1339–1363. https://doi.org/10.1016/j.quascirev.2005.11.006
Kim, H., Dietrich, W.E., Thurnhoffer, B.M., Bishop, J.K.B. & Fung, I.Y. 2017: Controls on solute concentration-discharge relationships revealed by simultaneous hydrochemistry observations of hillslope runoff and stream flow: The importance of critical zone structure. Water Resources Research 53(2), 5375–5377. https://doi.org/10.1002/2016WR019722
Kim, H., Høyer, A.-S., Jakobsen, R., Thorling, L., Aamand, J., Maurya, P.K., Christiansen, A.V. & Hansen, B. 2019: 3D characterization of the subsurface redox architecture in complex geological settings. Science of the Total Environment 693, 133583. https://doi.org/10.1016/j.scitotenv.2019.133583
Kim, H., Sandersen, P.B.E., Jakobsen, R., Kallesøe, A.J., Claes, N., Blicher-Mathiesen, G., Foged, N., Aamand, J. & Hansen, B. 2021: A 3D hydrogeochemistry model of nitrate transport and fate in a glacial sediment catchment: A first step toward a numerical model. Science of The Total Environment 776, 146041. https://doi.org/10.1016/j.scitotenv.2021.146041
Kroeger, K.D. & Charette, M.A. 2008: Nitrogen biogeochemistry of submarine groundwater discharge. Limnology and Oceanography 53(3), 1025–1039. https://doi.org/10.4319/lo.2008.53.3.1025
Levin, G. et al. 2014: Estimating land use/land cover changes in Denmark from 1990 – 2012. Technical report no. 38. DCE – Danish Center for Environment and Energy. ISBN: 978-87-7156-075-6; ISSN: 2245-019X
Luijendijk, E., Gleeson, T. & Moosdorf, N. 2020: Fresh groundwater discharge insignificant for the world’s oceans but important for coastal ecosystems. Nature Communications 11, 1260. https://doi.org/10.1038/s41467-020-15064-8
Lutz, S.R., Trauth, N., Musolff, A., Van Breukelen, B.M., Knöller, K. & Fleckenstein, J.H. 2020: How important is denitrification in riparian zones? Combining end–member mixing and isotope modeling to quantify nitrate removal from riparian groundwater. Water Resources Research 56, e2019WR025528. https://doi.org/10.1029/2019WR025528
Micallef, A. et al. 2020: Offshore freshened groundwater in continental margins. Reviews of Geophysics 58, e2020RG000706. https://doi.org/10.1029/2020RG000706
Rasmussen, E.S., Dybkjær, K. & Piasecki, S. 2010: Lithostratigraphy of the upper Oligocene – Miocene succession of Denmark. Geological Survey of Denmark and Greenland Bulletin 22, 1–92. https://doi.org/10.34194/geusb.v22.4733
Sandersen, P. & Jørgensen, F. 2003: Buried Quaternary valleys in western Denmark – Occurrence and inferred implications for groundwater resources and vulnerability. Journal of Applied Geophysics 53(4), 229–249. https://doi.org/10.1016/j.jappgeo.2003.08.006
Sandersen, P.B.E. & Jørgensen, F. 2016a: Kortlægning af begravede dale i Danmark. Opdatering 2010–2015. Bind 1: Hovedrapport. (Særudgivelse). In Danish. Copenhagen: Geological Survey of Denmark and Greenland. Special publication. https://www.begravededale.dk/2015-rapport.htm (accessed April 2023).
Sandersen, P.B.E. & Jørgensen, F. 2016b: Kortlægning af begravede dale i Danmark. Opdatering 2010–2015. Bind 2. Lokalitetsbeskrivelser In Danish. Copenhagen: Geological Survey of Denmark and Greenland. Special publication. https://www.begravededale.dk/2015-rapport.htm (accessed April 2023).
Sandersen, P.B.E. & Jørgensen, F. 2017: Buried tunnel valleys in Denmark and their impact on the geological architecture of the subsurface. Geological Survey of Denmark and Greenland Bulletin 38, 13–16. https://doi.org/10.34194/geusb.v38.4388
Sandersen, P.B.E. & Jørgensen, F. 2022: Tectonic impact on Pleistocene and Holocene erosional patterns in a formerly glaciated intra-plate area. Quaternary Science Reviews 293, 107681. https://doi.org/10.1016/j.quascirev.2022.107681
Sandersen, P.B.E. & Kallesøe, A.J. 2021: Geological mapping in MapField LOOP-areas and demo sites. Danmarks og Grønlands Geologiske Undersøgelse Rapport 2021(36). https://doi.org/10.22008/gpub/34596
Sandersen, P.B.E, Kallesøe, A.J., Møller, I, Høyer, A.-S., Jørgensen, F., Pedersen, J.B. & Christiansen, A.V. 2021: Utilizing the towed Transient ElectroMagnetic method (tTEM) for achieving unprecedented near-surface detail in geological mapping. Engineering Geology 288, 106125. https://doi.org/10.1016/j.enggeo.2021.106125
Santos, I.R. et al. 2021: Submarine groundwater discharge impacts on coastal nutrient biogeochemistry. Nat Rev Earth Environ 2, 307–323. https://doi.org/10.1038/s43017-021-00152-0
Sørensen, K.I. & Auken, E. 2004: SkyTEM – A new high-resolution helicopter transient electromagnetic system. Exploration Geophysics 35, 194–202. https://doi.org/10.1071/EG04194
Szymczycha, B., Kłostowska, Ż., Lengier, M. & Dzierzbicka-Głowacka, L. 2020: Significance of nutrient fluxes via submarine groundwater discharge in the Bay of Puck, southern Baltic Sea. Oceanologia 62(2), 117–125. https://doi.org/10.1016/j.oceano.2019.12.004
Taniguchi, M., Dulai, H., Burnett, K.M., Santos, I.R., Sugimoto, R., Stieglitz, T., Kim, G., Moosdorf, N. & Burnett, W.C. 2019: Submarine groundwater discharge: Updates on its measurement techniques, geophysical drivers, magnitudes, and effects. Frontiers in Environmental Science 7, 141. https://doi.org/10.3389/fenvs.2019.00141
van der Vegt, P., Janszen, A. & Moscariello, A. 2012: Tunnel valleys: Current knowledge and future perspectives. In: Huuse, M. et al. (eds): Glaciogenic Reservoirs and Hydrocarbon Systems. London: Geological Society, Special Publications 368, 75–97. https://doi.org/10.1144/SP368.13
Zamrsky, D., Essink, G.O., Sutanudjaja, E.H., van Beek, L.P.H. & Bierkens, M.F.P. 2022: Offshore fresh groundwater in coastal unconsolidated sediment systems as a potential fresh water source in the 21st century. Environmental Research Letters 17(1), 014021. https://doi.org/10.1088/1748-9326/ac4073