RESEARCH ARTICLE | SHORT
Scaling the Danish national water resources model for a pan-European quasi-3D groundwater resources model
Lærke Therese Andersen*1  , Anne-Sophie Høyer1
  , Mette Hilleke Mortensen1
  , Lars Troldborg2
  , Klaus Hinsby2
1Department of Near Surface Land and Marine Geology, Geological Survey of Denmark and Greenland (GEUS), Copenhagen, Denmark. 2Department of Hydrology, Geological Survey of Denmark and Greenland (GEUS), Copenhagen, Denmark
Citation: Andersen et al. 2023: GEUS Bulletin 53. 8335. https://doi.org/10.34194/geusb.v53.8335
Copyright: GEUS Bulletin (eISSN: 2597-2154) is an open access, peer-reviewed journal published by the Geological Survey of Denmark and Greenland (GEUS). This article is distributed under a CC-BY 4.0 licence, permitting free redistribution, and reproduction for any purpose, even commercial, provided proper citation of the original work. Author(s) retain copyright.
Received: 23 Nov 2022; Revised: 14 July 2023; Accepted: 3 Aug 2023; Published: 16 Oct 2023
Competing interests and funding: None
The work was co-funded by the European Union’s Horizon 2020 research and innovation programme under grant agreement no. 731166 and Innovation Fund Denmark under agreement no. 8055-00073B.
*Correspondence: [email protected]
Keywords: aquifers, Europe, groundwater resources, quasi-3D groundwater resource model, upscaling hydrostratigraphic layer model
Abbreviations:
DK-model: Danish national water resources model
INSPIRE: Infrastructure for Spatial Information in Europe
RESOURCE: Pan-EU Groundwater Resources Map
Edited by: Julian Koch (GEUS, Denmark)
Reviewed by: Ioannis Trichakis (European Commission Joint Research Centre, Italy) and one anonymous reviewer
Abstract
In this study, we upscale and simplify hydrostratigraphic information from a detailed model for Denmark to a pan-European scale. This is part of a larger project to develop a harmonised overview of the volume and depth of groundwater resources in a quasi-3D European groundwater resource model. A 10 km grid and a maximum of c. 10 hydrostratigraphic layers were chosen as the common scale for the European database. The Danish information is based on the national water resources model (the DK-model), where the information is significantly more detailed (100 m grid and up to 26 layers). Information was transferred from the DK-model to the quasi-3D model by a method involving computations of mean volumes and expert assessment to reduce layers in each cell. In this process, detailed hydrostratigraphic information is lost, which could otherwise be used for local groundwater flow modelling in Denmark. However, the strength of the quasi-3D model is that it still contains the volumes of all hydrostratigraphic units, both the saturated and unsaturated parts. Hence, the upscaled model can contribute to a relatively precise calculation of European groundwater resources for the quantitative assessment of groundwater status across Europe at a 10 × 10 km scale.
Introduction
In a changing climate, there is an increasing need for a 3D pan-European harmonised overview of European groundwater resources that includes supplementary information on the depth and volume of exploitable groundwater resources, as well as water balance and groundwater mean residence time of the aquifers. The aim of this study was, therefore, to upscale the Danish national water resources model (referred to as the DK-model) to contribute to a pan-European quasi-3D groundwater resources model developed as part of the European project RESOURCE (Pan-EU Groundwater Resources Map). The DK-model is significantly more detailed than the required input for the European model. Hence, the information in the DK-model had to be simplified and upscaled. Upscaling models is a challenging task, which has been managed in different ways by the many researchers dealing with this task (Zhang et al. 2021). These studies have typically been conducted to simulate flow and transport processes in oil or groundwater studies to reduce computational time and power. However, in this first approach of upscaling local models to create a pan-European model, the focus is only on groundwater resources and not on flow or transport processes.
In this study, hydrogeological information was transferred from a 100 m grid to a 10 km grid, and from 26 to 13 layers, using a mean-volume approach. The results are discussed and exemplified by one of the 10 × 10 km cells in Denmark.
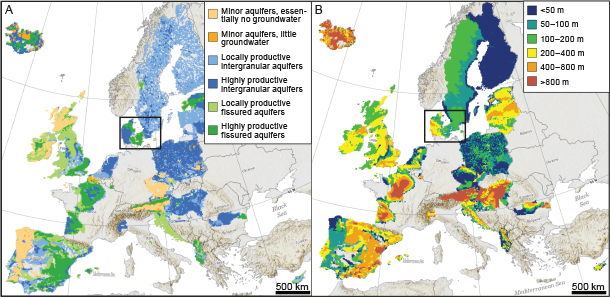
The RESOURCE (Pan-EU Groundwater Resources Map) project was part of the European programme GeoERA, in which hydrogeologists and groundwater scientists from more than 30 European geological surveys developed a pan-European harmonised overview of the volume and depth of groundwater resources (Hollis et al. 2022). Two examples of the harmonised pan-European groundwater resources map (Kivits et al. 2021) are shown in Figs 1A and B. The examples show the aquifer types and the total depths of the freshwater systems in the contributing areas of Europe (EGDI 2022). Both parameters show great variation not only across Europe but also within Denmark.

Fig. 1 Examples of mapped features from the pan-European groundwater resources map (EGDI 2022). (A) Aquifer types. (B) Total depth of aquifers below the surface. The blank areas (grey shading) reflect the countries or regions that did not participate or finalise the grid. Denmark is situated within the black square.
Geological setting
The pre-Quaternary surface in Denmark dips stratigraphically towards the north-east, such that the pre-Quaternary is composed of the youngest sediments (Pliocene, Miocene and Palaeogene) in the south-west and oldest (Danian and Upper Cretaceous limestone) in the north-east. The aquifer type (Fig. 1A) and the total depth of aquifers across Denmark (Fig. 1B) are closely related to the setting of the pre-Quaternary layers.
Overlaying these layers, the Quaternary deposits are mainly composed of clayey and sandy tills, interglacial deposits and meltwater sand and clay deposits. The Quaternary sequence is generally highly complex due to glacial tectonism (e.g. Høyer et al. 2013) and buried glacial valleys (Sandersen & Jørgensen 2017).
Danish drinking water supply is almost entirely sourced from groundwater and, due to the geology, is extracted from different types of deposits across Denmark. In the south-west, groundwater is primarily extracted from Miocene sand deposits (highly productive intergranular aquifers; Fig. 1A); in central areas, it is primarily from Pleistocene meltwater sand deposited in buried valleys; and in the east and north, it is primarily from chalk and limestone of Maastrichtian and Danian age, respectively. The hydraulic characteristics of the upper part of the chalk and limestone are strongly affected by fissures, brecciation and other features caused by glacial overpressure and glaciotectonics (Pedersen et al. 2018), which increase the permeability and hence make them important carbonate aquifers (highly productive fissured aquifers; Fig. 1A).
The DK-model
The main information for the map of the European groundwater resources was derived from the DK-model (Stisen et al. 2019). The DK-model is based on four individual models for Jylland (Jutland), Fyn (Funen), Sjælland (Zealand) and Bornholm. Together, these models represent the aquifers and aquitards in the majority of Denmark.
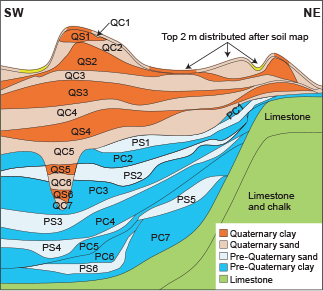
The DK-model has been developed to provide a nationwide overview of groundwater resources, defined on a grid of 100 × 100 m. The number of layers vary according to hydrogeology, such that most layers are present in Jylland (26 layers; see Fig. 2). The number of pre-Quaternary layers on top of the limestone increases from the north, where limestone is present close to the surface, and towards the south-west, where limestone is situated at great depth. The model encompasses up to six sandy aquifers in the pre-Quaternary and six sandy aquifers in the Quaternary deposits. Some of the layers appear regionally extensive, whereas others, such as the uppermost pre-Quaternary clay layer (PC1, Fig. 2), only have a local appearance. In the Quaternary layers, valley deposits (QC7, QS6, QC6 and QS5, Fig. 2) primarily occur locally in individual valleys, whereas layers in the plateaus are regionally extensive. Each of the layers in the DK-model is associated with distinct lithology types.

Fig. 2 Principal sketches for the layers in the DK-model for Jylland, modified from Stisen et al. 2019. QS: Quaternary sand. QC: Quaternary clay. PS: Pre-Quaternary sand. PC: Pre-Quaternary clay.
The DK-model is used for dynamic simulation of all major parts of the hydrological system, using a Mike She/Mike1D engine for groundwater calculations. The estimated hydrological parameters for each of the hydrostratigraphic units are optimised during the calibration of the model (Stisen et al. 2019).
Methods
Our goal was to upscale and simplify the 100 × 100 m DK-model with 26 layers to a 10 × 10 km quasi-3D groundwater resources model with 10 layers without losing information. For example, important aquifers in Denmark, such as the buried Quaternary valleys, are elongate erosional features (much less than 10 km wide) that cut the prevailing stratigraphy filled with younger sediments (Sandersen & Jørgensen 2017). The buried valleys are challenging to recreate when upscaling the model to a grid wider than the extent of the valleys, hence a special method is developed (see Figs 3 and 4).

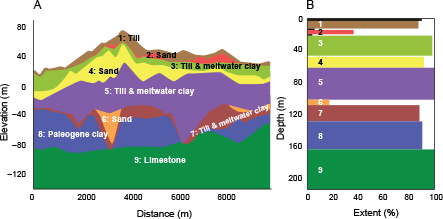
Fig. 3 Example results from a representative cell (cell no. 433_358, for location see Fig. 4). (A) Representative 2D profile through the DK-model in the cell. (B) Extent and calculated mean thicknesses of the saturated and unsaturated part (black bars) of each layer in the cell – here seen in 2D but representing the entire 3D cell (10 × 10 km).

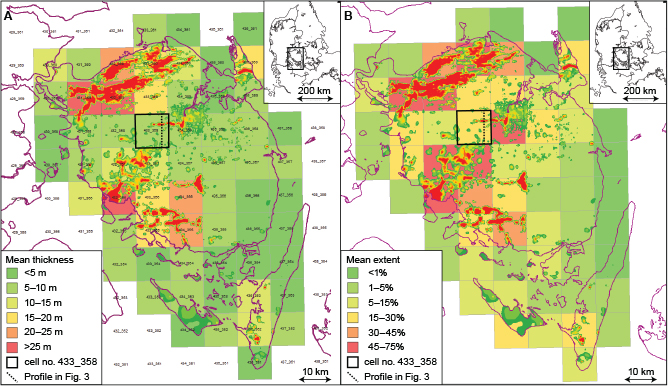
Fig. 4 Calculated mean thicknesses (A) and mean extents (B) for layer 6 (corresponding to valley sand) in 10 × 10 km cells covering the island of Fyn. Overlaying this are the exact position and thickness of the valley sand layer extracted from the DK-model, shown as a coloured contour map (colour scale in A). The position of the profile in Fig. 3A and the cell in Fig. 3B are marked on the map.
The quasi-3D model is based on an INSPIRE (Infrastructure for Spatial Information in Europe) grid from the European Environment Agency, consisting of cells each with a unique cell ID. Several geological and hydrological parameters were applied to each cell, such as total depth of active layers, boundary definition of the active depth and surface level altitude. Other layer information included thickness and extent of the unsaturated and saturated zones, hydrogeofacies, geological age, type of layer (aquitard or aquifer) and indications of the presence of palaeo-, artesian- or thermal groundwater. Hydrological parameters included porosity and horizontal and vertical conductivities for a maximum of c. 10 layers (Kivits et al. 2020).
Simplification of the information in the DK-model was initially performed in Jylland, by grouping near-surface Quaternary layers (QS1, QC2, QS2; Fig. 2) and deeper Quaternary layers (QS5, QC6, QS6; Fig. 2). This was based on experience with modelling of groundwater mapping in Denmark where layers of similar hydraulic properties are grouped together in the DK-model. For both Sjælland and Jylland, the lower most Quaternary till unit (QC7; Fig. 2) was grouped together with the top pre-Quaternary clay unit (PC1; Fig. 2). To further reduce the number of layers, a threshold for the mean thickness (3 m) and the mean extent (5%) of each layer in each cell was defined, as this was considered to be the minimum volume of interest at the European scale. Even after this reduction, 190 cells still had more than 10 layers. It was therefore decided to allow for up to 13 layers to reduce the number of cells that should be handled manually. Layers in the remaining 88 cells that had more than 13 layers were manually reduced by expert judgement. Where possible, layers were grouped to ensure only a limited impact on the final resource evaluation, for example, in areas where two aquifers or aquitards were situated directly on top of each other. Hydrological parameters were defined based on optimised parameters from the calibrated DK-model (Stisen et al. 2019). However, the hydrological parameters had to be adjusted to the new layer grouping. Generally, most grouping was performed between aquifers and aquitards, respectively. In these cases, the hydraulic parameters were calculated as a mean value if the parameters were not identical. The other type of grouping was performed in areas with thin layers which have been neglected in the final model result. This is the case, for example, where thick Miocene clay layers surround thin Miocene sand layers. In these cases, the hydraulic conductivity of the sand layer has not been considered because the final conductivity was dominated by the thick clay layers.
Next, a Python script in ArcGIS was programmed to extract the mean thickness and extent from the layers in the DK-model to the cells in the quasi-3D model. The unsaturated and, hence, the saturated parts were calculated using 500 × 500 m simulations of depth to the phreatic surface from the DK-model.
The total depth of the groundwater system in Denmark was defined as the depth to a hydrogeological base, a layer with very low vertical hydraulic conductivity. The top of the hydrogeological base in the western part of Denmark was defined as the Palaeogene clay, and in the northern and eastern parts was defined as the depth to the compact (non-fissured) Cretaceous limestone, estimated to be present at depths below 50 m of the top of the limestone (Fig. 1B). Metadata and methods used for upscaling the DK-model in the rest of Denmark are described by Andersen et al. (2021).
Results
The results of the conversion of the DK-model from a hydrostratigraphic layer model to a quasi-3D groundwater resources column model can be seen in Fig. 3. A profile crossing one of the 10 × 10 km grid cells on the island of Fyn shows nine layers in the DK-model numbered in chronostratigraphic order (Fig. 3A). In Fig. 3B, the same cell is shown in the quasi-3D model. Here, the calculated mean thickness and extents of each layer are also arranged in chronostratigraphic order. The unsaturated parts of the layers are shown with black bars on top of the layers – only the three topmost layers are partly unsaturated. In the final quasi-3D model, layers 7 and 8, which are both clay layers, have been joined. Note that layers in Fig. 3B represent the entire 3D cell. For instance, layer 4 occurs in the entire profile length (10 km; Fig. 3A), but not in the entire cell (10 × 10 km; Fig. 3B) where the extent is less than 100%. Naturally, the mean thicknesses are typically most representative for layers of great extent and little thickness variation (e.g. layer 4) compared to layers of little extent and great thickness variation (e.g. layer 6, a sand layer in a buried glacial valley with a mean thickness less than 10 m; Fig. 3B). In practice, though, the thickness of the valley sand varies up to 40 m along the profile (Fig. 3A, approx. distance 3000 m). However, the strength of the pan-European quasi-3D groundwater resources model is that the volume of all layers is equally well represented, no matter how extensive the layers are in the 10 × 10 km cell.
In Fig. 4 we zoom out and see the quasi-3D model for the entire island of Fyn with the mean thickness (Fig. 4A) and extent (Fig. 4B) of layer 6. The two maps are overlaid by the actual occurrence and thickness of the valley sand layer (layer 6 in Fig. 3A). The figure illustrates how the local occurrence and thickness of a layer in the DK-model is extrapolated to the entire cell in the quasi-3D model. For example, layer 6 in the DK-model has a local maximum (>25 m, red) where the profile crosses the cell (Fig. 3A). However, in the entire cell in the quasi-3D model, it is green, as the thickness when extrapolated to the entire cell is only 5–10 m.
Because the layer numbering is individual for each 3D cell (Kivits et al. 2020), the stratigraphy of layer 6 might vary within the map. However, the stratigraphy is relatively uniform at Fyn, and layer 6 therefore almost corresponds to the valley sand in the entire area.
Discussion
The upscaled hydrostratigraphy has been constructed to gather an overview of the groundwater resources on a pan-European scale. But simplifying the hydrogeology from a 100 m grid to a 10 km grid does have implications on the use for hydrological simulations, as the flow resolution from the DK-model is likely to be sensitive to hydrogeological structures at scales less than 10 km. Because the layer numbering is individual in each cell (Kivits et al. 2020), the quasi-3D model cannot be used directly for groundwater flow and recharge across all cell boundaries. The method of numbering layers is, however, important for all volumes to be represented in the model and placed in the right chronostratigraphic order, regardless of different geological regions and structures. The saturated parts of the aquifer volumes were used in the calculation of the groundwater resource (Schoonderwoerd et al. 2021).
The most challenging part of the upscaling has been to reduce the number of layers from 26 to 13 in each cell. The decision of 13 layers was based on our definition of ‘the minimum volume of interest on a European scale’ – a definition that will be more consolidated when the pan-European model has actually been used for decision-making in the EU. In the process of reducing the layers, expert judgement played an important role. As this was manually assessed, it was the most time-consuming part of the process, which could have been reduced by increasing the minimum volume.
The quasi-3D model cannot be used for detailed groundwater flow simulations. However, simulations of water balance and groundwater mean residence time and assessments of water stresses and climate change impacts are likely to make reasonable sense at a 10 km scale.
Conclusions
We have upscaled and simplified the hydrostratigraphy of the DK-model from the current 100 m grid to 10 km grid for use in a pan-European quasi-3D model. If we had used a traditional hydrostratigraphic model, all details about geological structures smaller than 10 × 10 km would have been lost. However, the upscaled model used here is a groundwater resources column model, showing the extent and thickness of each layer in the cell. Therefore, the volumes of features of a small extent, but large thickness, for example, the buried Quaternary valleys in Denmark, are still represented.
Further, since the structure of the model has changed from a hydrostratigraphic layer model to a quasi-3D resource model, the upscaling most likely has implications for the types of detailed groundwater flow simulations that the DK-model was originally used for, for example, in groundwater models when analysing contaminant transport or groundwater travel time distributions.
As the quasi-3D model considers both the saturated and unsaturated parts of the aquifers, it contributes to a relatively precise calculation of the European groundwater resources and the quantitative status across Europe in a 10 × 10 km grid.
Acknowledgements
We would like to thank Tano Kivits for reading and commenting on the manuscript. We also thank the reviewers for being thorough and giving constructive remarks to the manuscript. The work was co-funded by the European Union’s Horizon 2020 research and innovation programme under grant agreement no. 731166 and Innovation Fund Denmark under agreement no. 8055-00073B.
Author contributions
LTA: Conceptualisation, formal analysis, methodology, resources, validation, visualisation.
ASH: Writing original draft, visualisation.
MHM: Formal analysis, methodology, resources.
LT: Conceptualisation, formal analysis, methodology, resources.
KH: Funding acquisition, conceptualisation, project administration, supervision, validation.
Additional files
None
References
Andersen, L.T., Mortensen, M.H., Troldborg, L. & Hinsby, K. 2021: GeoERA RESOURCE GROUNDWATER Deliverable 6.6. Justification of the Choices to Compile the Pan-EU Groundwater Resources Maps by All Participating Countries – Metadata Denmark. 52–62. https://repository.europe-geology.eu/egdidocs/resource/geoera%2Bresource%2Bdeliverable%2B66%2Bjustification%2Bof%2Bc.pdf (accessed September 2023)
EGDI (European Geological Data Infrastructure) 2022: Pan-European Groundwater Resource Map: Volumes and Depths of Prime European Aquifers. https://data.geus.dk/egdi/?mapname=egdi_new_structure#baslay=baseMapGEUS&extent=-710780,1211800,6797980,5204710&layers=resource_netcdf11 (accessed November 2022)
Hollis, J. et al. 2022: Pan-European geological data, information, and knowledge for a resilient, sustainable, and collaborative future. European Geologist 53, 5–19. https://doi.org/10.5281/zenodo.6883282
Høyer, A.S., Jørgensen, F., Piotrowski, J.A. & Jakobsen, P.R. 2013: Deeply rooted glaciotectonism in western Denmark: Geological composition, structural characteristics and the origin of Varde hill-island. Journal of Quaternary Science 28(7), 683–696. https://doi.org/10.1002/jqs.2667
Kivits, T., Janza, M. & Broers, H.P. 2020: GeoERA RESOURCE GROUNDWATER Deliverable 6.2. Database with information on volumes and depths at 10x10 and/or 25x25 km grids, 28 pp. https://repository.europe-geology.eu/egdidocs/resource/geoera%2Bresource%2Bdeliverable%2B62%2Bdatabase%2Bwith%2Binfo.pdf (accessed September 2023)
Kivits, T., Rasmussen, V. & Broers, H.P. 2021: GeoERA RESOURCE GROUNDWATER Deliverable 6.4. Dataset to be included in the Information platform, 10 pp. https://repository.europe-geology.eu/egdidocs/resource/geoera%2Bresource%2Bdeliverable%2B64%2Bdataset%2Bto%2Bbe%2Bincl.pdf (accessed September 2023)
Pedersen, S.A.S., Gravesen, P. & Hinsby, K. 2018: Chalk-glacitectonite, an important lithology in former glaciated terrains covering chalk and limestone bedrock. Geological Survey of Denmark and Greenland Bulletin 41, 21–24. https://doi.org/10.34194/geusb.v41.4333
Sandersen, P.B.E. & Jørgensen, F. 2017: Buried tunnel valleys in Denmark and their impact on the geological architecture of the subsurface. GEUS Bulletin 38, 13–16. https://doi.org/10.34194/geusb.v38.4388
Schoonderwoerd, E., Essink, O.G., Bos-Burgering, L., Kivits, T., Zaadnoordijk, W.J. & Broers, H.P. 2021: GeoERA RESOURCE GROUNDWATER – Deliverable 6.5. Water balance terms for the EU fresh groundwater grid. 32 pp. https://repository.europe-geology.eu/egdidocs/resource/geoera%2Bresource%2Bdeliverable%2B65%2Bwater%2Bbalance%2Bterm.pdf (accessed September 2023)
Stisen, S., Ondracek, M., Troldborg, L., Schneider, R.J.M. & John van Til, M. 2019: National Vandressource Model – Modelopstilling og kalibrering af DK-model 2019. Danmarks og Grønlands Geologiske undersøgelse Rapport 2019/31, 1–125. https://doi.org/10.22008/gpub/32631
Zhang, X. et al. 2021: Application of upscaling methods for fluid flow and mass transport in multi-scale heterogeneous media: A critical review. Applied Energy 303, 117603. https://doi.org/https://doi.org/10.1016/j.apenergy.2021.117603