 |
RESEARCH ARTICLE  |
Organic geochemistry of an Upper Jurassic – Lower Cretaceous mudstone succession in a narrow graben setting, Wollaston Forland Basin, North-East Greenland
Abstract
The Oxfordian–Ryazanian was a period of widespread deposition of marine organic-rich mudstones in basins formed during the early phases of the rifting that heralded the formation of the present-day North Atlantic. Occasionally, uninterrupted deposition prevailed for 20 million years or more. Today, mudstones of this time interval are found on the shelves bordering the North Atlantic and adjacent areas from Siberia to the Netherlands. Here, we report data on two fully cored boreholes from Wollaston Forland (North-East Greenland, approx. 74° N), which represent an uninterrupted succession from the upper Kimmeridgian to the Hauterivian. The boreholes record basin development at two different positions within an evolving halfgraben, located at the margin of the main rift, and thus partially detached from it. Although the overall depositional environment remained an oxygen-restricted deep-shelf setting, rifting-related changes can be followed through the succession. The Kimmeridgian was a period of eustatic highstand and records the incipient rifting with a transgressive trend straddling the transition to the lower Volgian by a gradual change from deposits with high levels of total organic carbon (TOC) and kerogen rich in allochthonous organic matter to deposits with lower TOC and a higher proportion of autochthonous organic matter. This is followed by a slight regressive trend with lower TOC and increased proportions of allochthonous organic matter until rifting culminated in the middle Volgian–Ryazanian, indicated by increasing autochthonous organic matter and higher TOC, which prevailed until basin ventilation occurred towards the end of the Ryazanian. The properties of the reactive kerogen fraction remained rather stable irrespective of TOC, underlining the effect of terrigenous matter input for TOC. These variations are also captured by biological markers and stable carbon isotopes. The deposits are very similar to equivalent successions elsewhere in the proto-North Atlantic region, albeit the proportion of terrigenous kerogen is greater.
Citation: Bojesen-Koefoed et al. 2023: GEUS Bulletin 55. 8320. https://doi.org/10.34194/geusb.v55.8320
Copyright: GEUS Bulletin (eISSN: 2597-2154) is an open access, peer-reviewed journal published by the Geological Survey of Denmark and Greenland (GEUS). This article is distributed under a CC-BY 4.0 licence, permitting free redistribution, and reproduction for any purpose, even commercial, provided proper citation of the original work. Author(s) retain copyright.
Received: 20 Apr 2022; Revised: 06 Jan 2023; Accepted: 10 Jan 2023; Published: 21 Dec 2023
Competing interests and funding: The authors declare that they have no competing interests
The present work was funded by GEUS and a consortium of different companies of the international petroleum industry, who are all partners in a long-lasting collaborative effort, run by GEUS, concerning the geology of North-East Greenland.
*Correspondence: [email protected]
Keywords: North-East Greenland, organic geochemistry, paleogeography, source rock, Upper Jurassic
Abbreviations:
b. rfl.: below reference level
GC: gas chromatography
GEUS: Geological Survey of Denmark and Greenland
HI: Hydrogen Index
HIlive: average HI of the live kerogen fraction
MS: mass spectrometry
mmboe: million barrels of oil equivalent
NSO: nitrogen, sulphur and oxygen
PI: Production Index
SRA: Source Rock Analyzer
TC: total carbon
TD: total depth
Tmax: temperature at maximum rate of pyrolysate generation during Rock-Eval or SRA analysis (°C)
TOC: total organic carbon
TS: total sulphur
UEG: Ultimate Expulsion Gas
UEO: Ultimate Expulsion Oil
UEP: Ultimate Expulsion Potential
Edited by: Jon R. Ineson (GEUS, Denmark)
Reviewed by: Erdem Idiz (University of Oxford, UK), Iain Scotchman (Scotchman Geochemistry Services Ltd, UK)
1. Introduction
Marine shales of Oxfordian–Ryazanian age constitute the most important source rocks for petroleum in the prospective basins of the North Atlantic region, which include the basins of the greater North Sea area, the Barents Shelf, and the basins west of Ireland and the Shetland Islands as well as the basins of western Siberia. On the western side of the Atlantic this also includes the Jeanne d’Arc and Flemish Pass basins off eastern Canada, and probably untested basins off East and North-East Greenland. These deposits have been extensively studied (e.g. Von der Dick et al. 1989; Miller 1990; Chakhmakhchev et al. 1994; Klemme 1994; Telnæs et al. 1994; Fowler & McAlpine 1995; Isaksen & Ledje 2001; Ineson et al. 2003; Justwan & Dahl 2005; Justwan et al. 2005, 2006a,b; Petersen et al. 2010; Scotchman et al. 2016). Age- equivalent deposits crop out onshore North-East Greenland. However, irrespective of their importance for the general understanding of the most important petroleum system of Northwest Europe, published in-depth studies of the nature and petroleum potential of the equivalent North-East Greenland succession are scarce. Exceptions include papers by Requejo et al. (1989), Christiansen et al. (1992), Strogen et al. (2005) and Bojesen-Koefoed et al. (2018).
Over the years 2008–2010, the Geological Survey of Denmark and Greenland (GEUS) drilled three fully cored boreholes to depths of more than 200 m to penetrate the Upper Jurassic – Lower Cretaceous mudstone succession in East and North-East Greenland. The successions drilled are partially time equivalents of the Kimmeridge Clay Formation of the Wessex Basin, UK, as well as of the Upper Jurassic – Lower Cretaceous petroleum source-rock successions of the North Sea and North Atlantic basins, where they are known under a variety of different local names, see for instance Ineson et al. (2003). The Kimmeridge Clay Formation has been penetrated by cored boreholes close to its type section in Dorset (Morgans-Bell et al. 2001). However, the East and North-East Greenland boreholes offer an opportunity to study nearly the full Oxfordian to Ryazanian succession in an area remote from other studied outcrops and wells. The first of these boreholes to be drilled was the Blokelv-1 in Jameson Land, which covers the succession from the Oxfordian to the lower Volgian (see Ineson & Bojesen-Koefoed 2018). The second and third of the planned boreholes, the Rødryggen-1 and Brorson Halvø-1, respectively, were drilled in northern Wollaston Forland, North-East Greenland in 2009 and 2010, respectively. The Brorson Halvø-1 drill site is situated approximately 10 km north-east of the Rødryggen-1 drillsite, near the uplifted eastern crest of the fault block defined by the Permpas fault to the west and the Hühnerbjerg fault to the east (Fig. 1; Surlyk 1978). The Rødryggen-1 borehole is located near the centre of the same block.

Fig. 1 Location maps. Overview map (left). Positions of the Rødryggen-1 and Brorson Halvø-1 boreholes on Wollaston Forland are shown on a simplified geological map (right). K.F.: Kuhn fault; P.F.: Permpas Fault; H.F.: Hühnerbjerg Fault; D.F.: Dombjerg Fault. The Dombjerg Fault was the main fault to control the position of the coastline during the Late Jurassic. The Permpas–Hühnerbjerg block(s) was bounded by the Kuppel and Hühnerbjerg Faults, which probably represented the main controlling faults in the block that is studied here, during the Late Jurassic. Reproduced from Bojesen-Koefoed et al. (2023, this volume).
The main target of the drilling in both cores was the same Kimmeridgian–Ryazanian black mudstone succession with the primary objective being to delineate the lateral development in facies of the Upper Jurassic – Lower Cretaceous mudstone succession in an evolving half- graben system in the Wollaston Forland area. The objective of this paper is to present an overview of the organic geochemistry of the Upper Jurassic – Lower Cretaceous mudstone succession in the Wollaston Forland Basin, based on new evidence from the Rødryggen-1 and Brorson Halvø- 1 boreholes (Fig. 1). Details of the drilling, sedimentology and stratigraphy of the Rødryggen-1 and Brorson Halvø- 1 boreholes can be found in Bojesen- Koefoed et al. (2023, this volume), Hovikoski et al. (2023b, this volume) and Alsen et al. (2023, this volume).
2. Geological setting and stratigraphy of the drilled succession
The Jurassic–Cretaceous Wollaston Forland Basin developed in response to rifting in the proto-North Atlantic to the east of the basin. The Wollaston Forland Basin is overall a system of westerly tilted fault blocks or half-grabens bounded to the west by the Dombjerg Fault and to the east by the Hühernbjerg Fault (Figs 1, 2; Surlyk, 1978, 2003; Fyhn et al. 2021a). The basin is internally segmented into several subbasins defined by roughly north–south trending normal faults, which were active during various phases of the basin development (Fyhn et al. 2021a,b; Hovikoski et al. 2023a,b and references therein).

Fig. 2 Conceptual, approximately SW–NE-oriented cross-section of Clavering Ø – Wollaston Forland, showing multiple westward-tilted fault blocks. Modified from Birkelund & Perch-Nielsen (1976) and Vischer (1943).
The two drill-cores penetrate the Kimmeridgian – lower Barremian succession, which includes four lithostratigraphic units (Fig. 3): (1) the Bernbjerg Formation, (2) the Lindemans Bugt Formation, Storsletten Member (Alsen et al. 2023, this volume), (3) the Palnatokes Bjerg Formation (the Albrechts Bugt Member and the Rødryggen Member), and (4) the Stratumbjerg Formation (Bjerager et al. 2020; Surlyk et al. 2021).
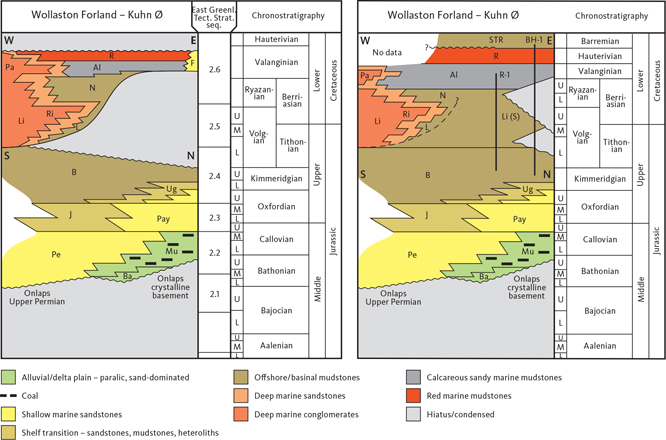
Fig. 3 Stratigraphic models of the Wollaston Forland – Kuhn Ø area. Left: the original stratigraphy by Surlyk (2003). Right: the revised stratigraphy after drilling of the Rødryggen-1 and Brorson Halvø-1 boreholes and incorporating changes introduced by Surlyk et al. (2021). The revised succession is much more complete and richer in mudstone than suggested by the original. East Greenl. Tect. Strat. Seq.: East Greenland Tectono-stratigraphic sequence. U: Upper. M: Middle. L: Lower. Abbreviations for geology are as follows: STR: Stratumbjerg Formation. R: Rødryggen Member. F: Falske Bugt Member. Pa: Palnatokes Bjerg Formation (Young Sund Member). Al: Albrechts Bugt Member. N: Niesen Member. Li: Lindemans Bugt Formation. Li (S): Lindemans Bugt Formation (Storsletten Member). Ri: Rigi Member. L: Laugeites Ravine Member. B: Bernbjerg Formation. Ug: Ugpik Ravine Member. J: Jakobsstigen Formation. Pay: Payer Dal Formation. Pe: Pelion Formation. Mu: Muslingebjerg Formation. Ba: Bastians Dal Formation. Black dashes indicate uncertain contact. Black vertical lines indicate boreholes, R-1: Rødryggen-1; BH-1: Brorson Halvø-1.
The upper Oxfordian – lower Volgian Bernbjerg Formation is up to 500–600 m thick and represents a tectonically affected muddy shelf succession that crops out from Store Koldewey in the north to Traill Ø (Ø meaning island) in the South (Surlyk & Clemmensen 1983; Surlyk 2003; Surlyk et al. 2021). A major rift episode starting in the Volgian terminated the regionally continuous shelf accumulation and resulted in accelerated tilted fault-block development and basin segmentation that lasted until the Barremian in the western part of the area (Surlyk 1978, 1984, 1990, 2003; Piasecki et al. 2020). As a result, the basin geometry changed into a series of narrow, 10–30 km wide, S–N-oriented basins that were strongly westwards tilted. In the most proximal fault block, the Volgian–Ryazanian syn-rift interval is characterised by major conglomeratic submarine fan-delta systems (Lindemans Bugt Formation; Rigi Member; Surlyk 1978; Henstra et al. 2016), which graded into heterolithic and mud-dominated deposits in more distal areas (the Laugeites Ravine, Niesen and Storsletten Members). The areal distribution of the Lindemans Bugt Formation is limited to north-eastern Clavering Ø, north-western Wollaston Forland, eastern Th. Thomsen Land (named for the ethnographer Thomas Thomsen, known as Th. Thomsen (Higgins 2010)) and south-west Kuhn Ø (Surlyk 1978; Surlyk et al. 2021). The formation is wedge-shaped in a west–east direction and is estimated to reach a maximum thickness of 2 km.
The Valanginian stage is characterised by waning rift activity in the study area (late syn-rift) and transgression, whereas rifting continued in the axial areas to the east (Surlyk 1978, 1984, 2003; Surlyk & Korstgård 2013; Hovikoski et al. 2018). The Palnatokes Bjerg Formation was deposited during this period. The Formation crops out in Wollaston Forland, Kuhn Ø, Hochstetter Forland and Traill Ø (Surlyk 1978; Surlyk et al. 2021). Like the Lindemans Bugt Formation, the formation shows variable thickness in west–east transect and reaches a maximum thickness of 600 m. It includes the coarse-grained gravity flow deposits of the Young Sund and Falskebugt Members, and the fossiliferous fine-grained Albrechts Bugt and Rødryggen Members. The cored interval penetrates both fine-grained members and the recent biostratigraphic data suggest a Valanginan to Hauterivian age for these deposits (Alsen & Mutterlose 2009; Pauly et al. 2012; Möller et al. 2015).
In the Brorson Halvø core, the Palnatokes Bjerg Formation is gradationally overlain by a thin interval of upper Hauterivian sub-storm-wave-base bioturbated mudstones of the Stratumbjerg Formation (Bjerager et al. 2020). This formation crops out from Traill Ø in the south to Store Koldewey in the north and reaches its maximum thickness of 270 m in the Brorson Halvø area.
3. Samples and methods
Samples used for the present study include material from the fully cored Rødryggen-1 and Brorson Halvø-1 boreholes.
The Rødryggen-1 borehole reached a total depth (TD) of 234.66 m below terrain, with a core recovery of 99%. The lithostratigraphic units encountered include the Bernbjerg Formation (Kimmeridgian – lower Volgian), the Lindemans Bugt Formation (lower Volgian – upper Ryazanian) and the Palnatokes Bjerg Formation, Albrechts Bugt Member (upper Ryazanian – upper Valanginian; Alsen et al. 2023, this volume). The succession penetrated by the borehole is stratigraphically complete and does not include any notable hiatuses. A total of 258 samples were subjected to total carbon (TC), total sulphur (TS), total organic carbon (TOC) and Rock-Eval type screening analyses, and subsets of these samples were selected for further analyses such as vitrinite reflectance analysis (12 samples), biological marker analysis (24 samples) and stable carbon isotopic analysis (20 samples).
The Brorson Halvø-1 borehole reached a TD of 225.88 m below terrain, with a core recovery of 99%. The lithostratigraphic units encountered include the Bernbjerg Formation (Kimmeridgian – lower Volgian), the Lindemans Bugt Formation (middle Volgian), the Palnatokes Bjerg Formation including the Albrechts Bugt Member (upper Ryazanian – upper Valanginian), and Rødryggen Member (Hauterivian) and the Stratumbjerg Formation (Barremian; Alsen et al. 2023, this volume). The succession penetrated by the borehole is stratigraphically incomplete and includes notable hiatuses with significant portions of the upper part of the lower Volgian and the lower part of the middle Volgian being absent. A significant portion of the upper part of the middle Volgian, the entire upper Volgian and lower Ryazanian successions are also missing (Fig. 3). A total of 232 samples were subjected to TC/TS/TOC-Rock-Eval type screening analyses, and subsets of these samples were selected for further analyses, such as vitrinite reflectance analysis (10 samples), biological marker analysis (18 samples) and stable carbon isotopic analysis (10 samples).
In addition to the borehole samples, a set of outcrop samples collected in the immediate vicinity of the Rødryggen-1 drill site were subjected to TC/TS/TOC-Rock-Eval type screening analyses. The sample set represents dense sampling of a c. 30 m thick profile of the uppermost part of the Storsletten Member (Lindemans Bugt Formation), extending stratigraphically downwards from the well-defined boundary between the Storsletten Member of the Lindemans Bugt Formation and the overlying Albrechts Bugt Member. The boundary thus serves as a datum for the sampling, which can also be recognised in the Rødryggen-1 core. The outcrop samples were collected from regular outcrops exposed by digging away the cover of loose shale debris.
Analytical procedures, summarised here, are detailed in full in Bojesen-Koefoed et al. (2018).
TC (wt%), TOC (wt%) and TS (wt%) were determined by combustion in a LECO CS-200 induction furnace. Petroleum potential was determined by Rock-Eval type pyrolysis using a Source Rock Analyzer (SRA) instrument, manufactured by Humble Instruments and Services and calibrated against the IFP160000 standard.
Particulate blocks for reflected light microscopy were prepared and measured for vitrinite reflectance according to international standards (Taylor et al. 1998). Several samples were also qualitatively inspected in reflected white light and fluorescence-inducing blue light.
Solvent extraction (samples powdered to <250 µm) was carried out with methanol/dichloromethane 7:93 vol./vol. as solvent using a Soxtec™. Asphaltenes were precipitated by addition of 40-fold excess n-pentane. Maltene fractions were separated into saturated, aromatic and NSO fractions (NSO: compounds containing nitrogen, sulphur and oxygen and other heteroatoms) by medium-pressure liquid chromatography (Radke et al. 1980).
Gas chromatography of saturated extract fractions was carried out using a Shimadzu GC-2010 instrument. Gas chromatography (GC) – mass spectrometry (MS) was carried out using an Agilent 6890N gas chromatograph connected to a Waters (Micromass) Quattro Micro GC tandem quadrupole-hexapole-quadrupole mass spectrometer.
4. Results
4.1 Thermal maturity
The thermal maturity of the successions penetrated by the Rødryggen-1 and Brorson Halvø-1 boreholes was assessed using a combination of several independent parameters including the temperature at the maximum rate of pyrolysate generation (°C) Tmax and Production Index (PI) derived from Rock-Eval type pyrolysis, vitrinite reflectance (%Ro), and sterane isomerization ratios (Tables 1, 2, 4, 5). Fig. 4, upper panel, shows maturity data for both boreholes drilled versus depth. Fig. 4, lower panel, likewise shows maturity data versus depth but includes data on the stratigraphic breakdown and the presence of hiatuses in the Brorson Halvø-1 succession documented by Alsen et al. (2023, this volume). Hence, the Brorson Halvø-1 data are shifted to accommodate two major hiatuses, assuming the thickness of missing sections equals the thickness of corresponding sections in the Rødryggen-1 borehole. Despite this very simplistic approach, a surprisingly good match is obtained when considering detailed variations, see Fig. 5, which has been prepared in a similar way. In both boreholes, homohopane isomerization ratios have reached equilibrium distribution, and thus carry no information on the maturity gradient, but demonstrate that the burial temperature has exceeded that required for the equilibrium reaction to have been completed.
| Interval | Inert C (%) | Live kerogen HI |
| Ryazanian | 0.60 | 463 |
| Late Volgian | 1.87 | 610 |
| Middle Volgian | 1.45 | 559 |
| Lower Volgian | 1.52 | 383 |
| Kimmeridgian | 1.42 | 332 |
| Sample # | Stratigraphy | Depth (m) | Pr/Ph | BHN index | D30 index | IHR | HHI | S27 (%) | S28 (%) | S29 (%) | S30 (%) | S29 (S/(S+R)) | S29 ββ/(ββ+αα) | Dia/Reg steranes | δ13C (total) |
| 17097 | Ryazanian | 25.00 | 2.52 | 2.89 | 7.81 | 0.12 | 4.89 | 32.1 | 28.3 | 29.0 | 10.6 | 0.30 | 0.29 | 2.41 | |
| 17886 | Ryazanian | 28.89 | 2.15 | 7.57 | 9.35 | 0.11 | 6.39 | 35.9 | 29.2 | 24.2 | 10.6 | 0.30 | 0.33 | 2.16 | –29.1 |
| 17895 | upper Volgian | 37.88 | 2.55 | 2.13 | 9.22 | 0.11 | 4.69 | 37.1 | 27.9 | 27.1 | 7.9 | 0.29 | 0.33 | 1.96 | –29.0 |
| 17905 | middle Volgian | 47.06 | 2.85 | 1.98 | 9.68 | 0.12 | 4.18 | 35.4 | 27.9 | 26.0 | 10.7 | 0.30 | 0.30 | 1.77 | –29.2 |
| 17916 | middle Volgian | 56.88 | 2.24 | 4.68 | 9.73 | 0.11 | 6.65 | 30.6 | 33.1 | 26.8 | 9.4 | 0.30 | 0.30 | 1.61 | –29.2 |
| 17924 | middle Volgian | 64.47 | 3.34 | 7.79 | 6.01 | 0.11 | 4.24 | 35.1 | 29.7 | 26.8 | 8.3 | 0.30 | 0.30 | 1.72 | |
| 17935 | middle Volgian | 74.92 | 3.84 | 29.10 | 7.89 | 0.10 | 5.12 | 35.2 | 31.1 | 25.7 | 8.0 | 0.33 | 0.32 | 1.78 | –29.9 |
| 17944 | middle Volgian | 83.57 | 2.15 | 19.42 | 8.55 | 0.10 | 8.18 | 32.9 | 31.9 | 28.5 | 6.6 | 0.33 | 0.32 | 1.61 | –29.7 |
| 17953 | middle Volgian | 92.23 | 2.04 | 3.12 | 8.26 | 0.10 | 7.16 | 31.9 | 31.6 | 28.6 | 7.8 | 0.33 | 0.29 | 1.28 | –29.9 |
| 17962 | lower Volgian | 100.73 | 2.21 | 1.40 | 6.23 | 0.10 | 6.42 | 31.5 | 31.7 | 29.0 | 7.9 | 0.35 | 0.30 | 1.52 | –29.4 |
| 17973 | lower Volgian | 110.15 | 2.38 | 43.26 | 8.57 | 0.11 | 5.54 | 30.7 | 31.3 | 31.5 | 6.5 | 0.37 | 0.33 | 2.37 | –28.4 |
| 17983 | lower Volgian | 119.77 | 3.19 | 68.03 | 8.71 | 0.12 | 4.23 | 30.6 | 29.6 | 34.7 | 5.0 | 0.38 | 0.36 | 2.58 | –28.1 |
| 17992 | lower Volgian | 128.22 | 3.82 | 65.55 | 8.70 | 0.12 | 4.20 | 28.2 | 28.7 | 37.1 | 6.0 | 0.41 | 0.23 | 0.77 | –28.2 |
| 18002 | lower Volgian | 139.26 | 3.13 | 82.51 | 9.27 | 0.11 | 5.53 | 26.7 | 17.8 | 51.0 | 4.4 | 0.42 | 0.24 | 1.54 | –27.3 |
| 18012 | lower Volgian | 148.46 | 3.13 | 72.91 | 9.62 | 0.11 | 4.51 | 25.8 | 21.1 | 48.7 | 4.4 | 0.44 | 0.23 | 0.77 | –27.2 |
| 18023 | Kimmeridgian | 158.77 | 2.64 | 70.66 | 9.81 | 0.12 | 4.86 | 28.7 | 27.9 | 37.8 | 5.6 | 0.42 | 0.34 | 2.18 | –27.8 |
| 18032 | Kimmeridgian | 167.24 | 2.70 | 57.72 | 7.62 | 0.11 | 4.31 | 29.7 | 25.3 | 40.1 | 4.9 | 0.44 | 0.32 | 2.08 | –27.3 |
| 18042 | Kimmeridgian | 176.33 | 2.51 | 47.73 | 8.73 | 0.10 | 4.63 | 31.8 | 27.3 | 35.4 | 5.6 | 0.43 | 0.32 | 1.81 | |
| 18054 | Kimmeridgian | 187.85 | 4.18 | 28.12 | 7.25 | 0.12 | 2.85 | 31.7 | 27.8 | 33.3 | 7.1 | 0.45 | 0.33 | 2.04 | –27.3 |
| 18064 | Kimmeridgian | 197.24 | 2.71 | 46.42 | 8.33 | 0.12 | 3.50 | 30.4 | 29.3 | 34.2 | 6.1 | 0.45 | 0.34 | 1.83 | –27.4 |
| 18075 | Kimmeridgian | 207.21 | 3.07 | 53.48 | 8.45 | 0.11 | 3.84 | 30.3 | 29.2 | 34.6 | 5.8 | 0.49 | 0.41 | 2.08 | –26.7 |
| 18086 | Kimmeridgian | 216.55 | 3.94 | 76.54 | 7.73 | 0.13 | 3.41 | 28.1 | 27.0 | 40.8 | 4.1 | 0.48 | 0.38 | 2.66 | |
| 18094 | Kimmeridgian | 224.44 | 2.94 | 28.86 | 7.97 | 0.12 | 4.20 | 31.0 | 28.3 | 35.2 | 5.5 | 0.49 | 0.35 | 2.06 | –27.0 |
| 18109 | Kimmeridgian | 234.66 | 3.54 | 78.08 | 8.37 | 0.12 | 4.36 | 28.2 | 28.1 | 37.9 | 5.8 | 0.49 | 0.37 | 1.59 | –26.6 |
| Pr/Ph: pristane/phytane ratio. BNH Index: 100 × (28,30-bisnorhopane/(28,30-bisnorhopane+hopane)). D30 Index: 100×*(C30-diahopane/(C30-diahopane+hopane)). IHR: isohopane ratio (Nytoft 2011). HHI: Homohopane Index: 100 × (H35 hopanes)/(sum of H31–35 hopanes), S27 (%), S28 (%), S29 (%), S30 (%). normalised distribution of C27–C30 total steranes, S29 (S/(S+R)). C29 sterane 20S/(20S+20R) isomer ratio, S29 (ββ/ββ+αα). C29 sterane αββ/(αββ+ααα) isomer ratio, Dia/Reg. total diasteranes/total regular steranes, δ13C (total). stable carbon isotopic composition, total extract. | |||||||||||||||
| Sample # | Stratigraphy | Depth (m) | Pr/Ph | H28 index | D30 index | IHR | HHI | S27 (%) | S28 (%) | S29 (%) | S30 (%) | S29 (S/(S+R)) | S29 ββ/ (ββ+αα) | Dia/Reg steranes | δ13C (total) |
| 18599 | middle Volgian | 41.28 | 2.19 | 0.00 | 8.73 | 0.10 | 12.91 | 34.0 | 28.8 | 25.9 | 11.4 | 0.56 | 0.56 | 3.30 | –30.0 |
| 18600 | middle Volgian | 42.09 | 2.31 | 0.28 | 7.63 | 0.10 | 12.41 | 33.2 | 27.3 | 26.6 | 12.9 | 0.54 | 0.55 | 3.41 | |
| 18611 | lower Volgian | 52.41 | 2.12 | 0.51 | 7.83 | 0.11 | 12.12 | 27.6 | 29.3 | 34.6 | 8.6 | 0.53 | 0.55 | 3.39 | |
| 20158 | lower Volgian | 52.95 | 2.10 | 0.86 | 7.18 | 0.11 | 12.09 | 28.2 | 29.0 | 34.9 | 7.8 | 0.55 | 0.56 | 3.23 | |
| 18623 | lower Volgian | 64.23 | 3.46 | 22.75 | 7.87 | 0.12 | 9.39 | 27.7 | 25.8 | 39.2 | 7.3 | 0.52 | 0.54 | 3.81 | –28.6 |
| 18635 | lower Volgian | 75.28 | 2.52 | 19.46 | 9.87 | 0.12 | 10.22 | 28.0 | 25.3 | 39.5 | 7.2 | 0.54 | 0.55 | 2.73 | |
| 18648 | lower Volgian | 87.78 | 2.67 | 23.49 | 9.60 | 0.12 | 10.01 | 30.9 | 24.4 | 37.2 | 7.6 | 0.53 | 0.56 | 2.32 | –28.8 |
| 18659 | lower Volgian | 98.08 | 2.52 | 23.91 | 8.75 | 0.11 | 10.26 | 25.7 | 23.9 | 43.6 | 6.8 | 0.54 | 0.60 | 1.54 | –28.0 |
| 18672 | lower Volgian | 111.25 | 2.84 | 24.48 | 7.81 | 0.11 | 10.73 | 24.3 | 19.4 | 50.0 | 6.4 | 0.56 | 0.61 | 1.17 | –27.8 |
| 18695 | lower Volgian | 132.43 | 2.35 | 26.22 | 7.76 | 0.12 | 10.12 | 23.8 | 18.7 | 52.2 | 5.2 | 0.54 | 0.60 | 1.45 | –27.4 |
| 18711 | lower Volgian | 148.83 | 2.47 | 4.03 | 8.76 | 0.14 | 8.75 | 29.4 | 25.6 | 36.8 | 8.1 | 0.55 | 0.61 | 2.35 | |
| 18718 | lower Volgian | 155.74 | 2.75 | 3.28 | 9.81 | 0.14 | 6.94 | 29.4 | 24.3 | 37.5 | 8.8 | 0.54 | 0.61 | 3.01 | –27.7 |
| 19820 | Kimmeridgian | 172.02 | 2.93 | 12.36 | 8.89 | 0.13 | 8.19 | 29.4 | 24.3 | 40.5 | 5.8 | 0.56 | 0.63 | 2.85 | |
| 18741 | Kimmeridgian | 178.19 | 2.99 | 16.32 | 10.04 | 0.15 | 8.49 | 27.0 | 20.1 | 48.2 | 4.8 | 0.53 | 0.62 | 2.19 | –27.8 |
| 19821 | Kimmeridgian | 184.35 | 2.87 | 10.19 | 10.86 | 0.13 | 7.75 | 27.9 | 23.3 | 42.7 | 6.1 | 0.54 | 0.65 | 3.13 | |
| 18865 | Kimmeridgian | 201.23 | 2.79 | 9.91 | 14.21 | 0.17 | 8.58 | 28.3 | 21.6 | 44.1 | 6.0 | 0.55 | 0.62 | 3.34 | –26.7 |
| 18882 | Kimmeridgian | 217.89 | 2.38 | 4.15 | 20.58 | 0.19 | 10.40 | 30.8 | 23.1 | 39.6 | 6.4 | 0.52 | 0.62 | 1.54 | |
| 18889 | Kimmeridgian | 224.69 | 3.07 | 3.65 | 21.11 | 0.18 | 7.79 | 26.8 | 23.7 | 43.9 | 5.5 | 0.52 | 0.61 | 4.24 | –26.9 |
| Pr/Ph. pristane/phytane ratio, BNH index. 100 × (28,30-bisnorhopane/(28,30-bisnorhopane+hopane)), D30 index. 100 × (C30-diahopane/(C30-diahopane+hopane)), IHR. isohopane ratio (Nytoft 2011), HHI. Homohopane Index: 100 × (H35 hopanes)/(sum of H31–35 hopanes), S27 (%), S28 (%), S29 (%), S30 (%). normalised distribution of C27–C30 total steranes, S29 (S/(S+R)). C29 sterane 20S/(20S+20R) isomer ratio, S29 (ββ/ββ+αα). C29 sterane αββ/(αββ+ααα) isomer ratio, Dia/Reg. total diasteranes/total regular steranes, δ13C (total). stable carbon isotopic composition, total extract. | |||||||||||||||
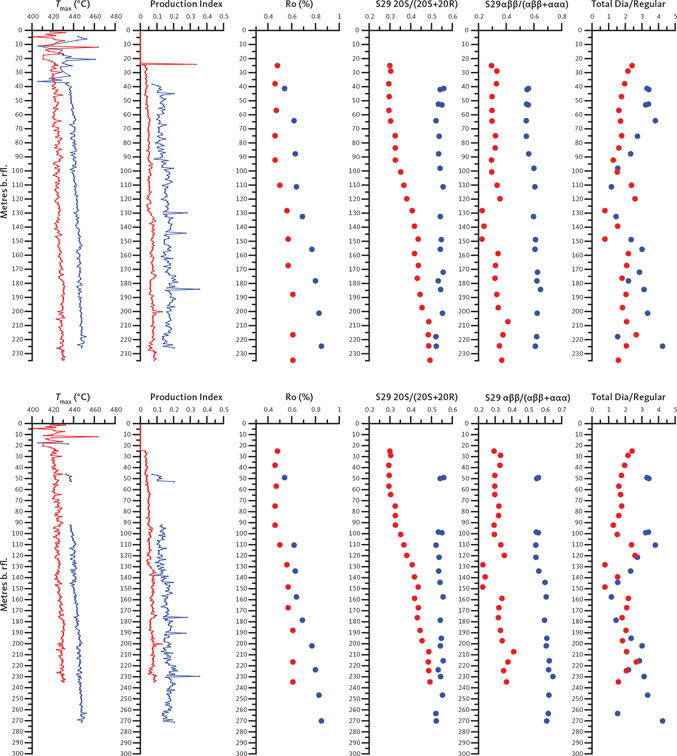
Fig. 4 Thermal maturity parameters versus drilled depth below reference level (b. rfl.) for the Rødryggen-1 (red symbols/lines) and Brorson Halvø-1 (blue symbols/lines) boreholes (upper panels) and the Rødryggen-1 (red symbols/lines) and Brorson Halvø-1 (blue symbols/lines) boreholes taking into account stratigraphic information (lower panels; Alsen et al. 2023, this volume). Two hiatuses in the succession penetrated by the Brorson Halvø-1 borehole have been compensated for by assuming that the thickness of the missing section equals the equivalent section in the Rødryggen-1 borehole, which shows no hiatus. Hence, only samples of the Rødryggen-1 borehole show true drilled depths, while samples below the hiatus in the Brorson Halvø-1 section have been shifted to greater depths and may even appear deeper than the total depth (TD) of the Brorson Halvø-1 borehole. Tmax: temperature of maximum rate of generation of pyrolysate during Rock-Eval type pyrolysis. Production Index: S1/(S1+S2) from Rock-Eval type pyrolysis. Ro (%): vitrinite reflectance. S29 20S/(20S+20R): C29 sterane 20αααS/(20αααS+20αααR) isomer ratio. S29 αββ/(αββ+ααα): C29 sterane 20αββ/(20ααα+20αββ) isomer ratio. Total Dia/Regular: total diasteranes to total regular steranes ratio.
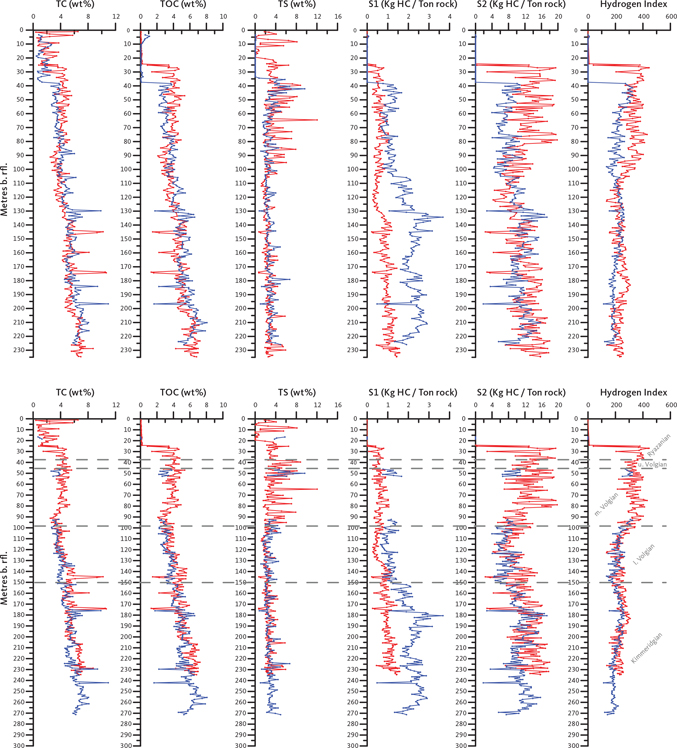
Fig. 5 Organic geochemical screening parameters versus drilled depth below reference level (b. rfl.) for the Rødryggen-1 (red symbols/lines) and Brorson Halvø-1 (blue symbols/lines) boreholes (upper panels) and the Rødryggen-1 (red symbols/lines) and Brorson Halvø-1 (blue symbols/lines) boreholes taking into account stratigraphic information (lower panels; Alsen et al. 2023, this volume). Two hiatuses in the succession penetrated by the Brorson Halvø-1 borehole have been compensated for by assuming that the thickness of the missing section equals the equivalent section in the Rødryggen-1 borehole, which shows no hiatus. Hence, only samples of the Rødryggen-1 borehole show true drilled depths, while samples below the hiatuses in the Brorson Halvø-1 section have been shifted to greater depths and may even appear deeper than the total depth (TD) of the Brorson Halvø-1 borehole. Stratigraphic ages as defined by the Rødryggen-1 borehole.
The Rødryggen-1 borehole shows clearly increasing trends with depth in all parameters (Fig. 4). Tmax increases from c. 420°C in the Ryazanian succession to 430°C in the Kimmeridgian succession at the base of the borehole. PI shows a parallel increase from c. 0.04 to 0.08, whereas the vitrinite reflectance increases from c. 0.48% Ro to 0.61% Ro, and sterane 20S/(20S+20R) isomerization ratio goes from 0.30 to 0.49. Only the sterane αββ/(ααα+αββ) isomerization ratio shows a slightly more irregular depth trend, but on average, this ratio increases from c. 0.29 to 0.36 over the succession penetrated by the Rødryggen-1 borehole. Combined, the maturity parameters agree in suggesting that the succession is thermally immature with respect to petroleum generation but is approaching oil-window maturity at the base of the borehole. The existence of a clear maturity gradient over such a limited depth interval is unexpected, but a similar feature is found in the Blokelv-1 borehole in Jameson Land (Bojesen-Koefoed et al. 2018), and in the Brorson Halvø-1 borehole, situated approximately 10 km north-east of the Rødryggen-1 drill site. Over the succession penetrated by the Brorson Halvø-1 borehole, Tmax increases from c. 435°C to 450°C with parallel increases in PI from c. 0.09 to 0.19, and in vitrinite reflectance from 0.54% Ro to 0.85% Ro. Sterane 20S/(20S+20R) isomerization ratios have reached equilibrium distribution in the entire succession, whereas the sterane αββ/(ααα+αββ) isomer ratio increases from c. 0.55 to 0.62 with depth. Combined, the maturity parameters suggest that the upper part of the succession just enters the oil-generative window, which extends further towards the base of the borehole. Comparing the two panels of Fig. 4, the hiatus has little detectable effect on the maturity profile of the Brorson Halvø-1 borehole.
Despite the similar depth trends, which suggest a regionally high geothermal gradient, there is a notable difference in the level of thermal maturity observed in the two boreholes.
4.2 Petroleum potential and organic facies variations
The succession penetrated by the Rødryggen-1 borehole is stratigraphically complete with no notable hiatus. The Kimmeridgian and lower Volgian sections show a steady up-section decrease in TOC, from close to 6 wt% to c. 3 wt% at the transition to the middle Volgian (Fig. 5; Table 1). TS remains largely constant at c. 2.5 wt% over the same interval, whereas the S2-parameter displays some variation, which is shown by the derived Hydrogen Index (HI) that shows initial values close to 200 and a gradual upwards increase culminating locally with a HI of c. 300, some 35 m below the transition to the lower Volgian. The section above shows a decreasing trend with a minimum HI of c. 200 in the lowermost part of the lower Volgian section, followed by a notable increase towards the base of the middle Volgian to HI close to 350. Average HI remains largely constant at 300–350 in the middle Volgian and the lower portion of the Ryazanian sections, after which it essentially drops to zero. However, in general terms, the drilled succession shows only limited variation in kerogen type as defined by screening data, i.e. a gas–oil-prone kerogen type II/III (Fig. 6). Superimposed on the general trends described here are a number of subordinate trends. Both general and subordinate trends can often be tied to transgressive-regressive cycles indicated by detailed sedimentological analysis and various chemical proxies, and which in turn are linked to the tectonic evolution of the area as described by Hovikoski et al. (2023a,b).
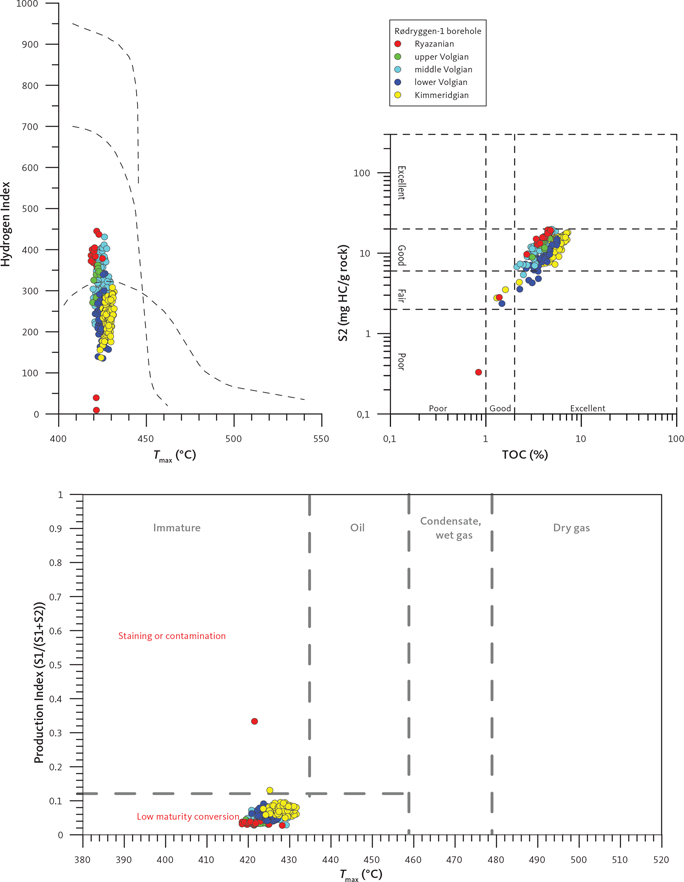
Fig. 6 Standard plots of organic geochemical screening data from the Rødryggen-1 borehole.
The stratigraphically partly overlapping succession penetrated by the Brorson Halvø-1 borehole shows very similar detailed variations to the corresponding succession in the Rødryggen-1 borehole, except for the effects of increased thermal maturity, as shown by higher S1-values and lower S2-values and HI in the Brorson Halvø-1 borehole (Figs 5, 7; Table 2). Moreover, due to the presence of hiatuses, certain intervals are not present.
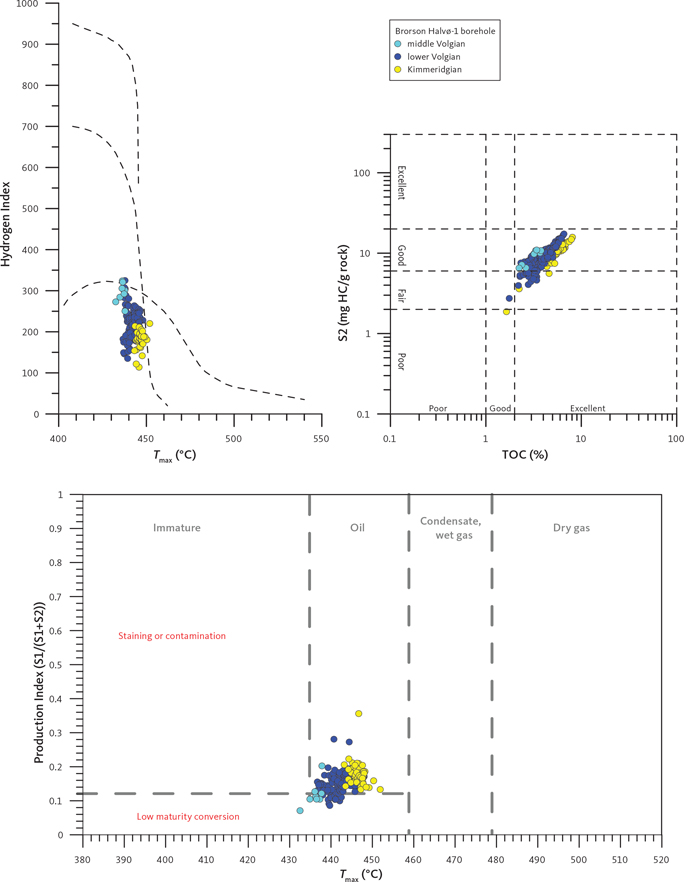
Fig. 7 Standard plots of organic geochemical screening data from the Brorson Halvø-1 borehole.
The uninterrupted sedimentary record demonstrated by the succession drilled by the Rødryggen-1 borehole and its low level of thermal maturity allow a more detailed assessment of the petroleum potential of the individual chronostratigraphic intervals. Using the method of Dahl et al. (2004), the average proportions of inert/dead carbon and the average HI of the live kerogen fraction (HIlive) have been assessed (Fig. 8; Table 3). The results show that the Kimmeridgian, lower Volgian, middle Volgian and upper Volgian successions all include similar proportions of dead carbon, yielding values roughly in the range 1.5–2.0 wt%. Conversely, HIlive tends to increase steadily up-section to culminate at a value of 610 in the upper Volgian section. The Ryazanian succession shows very low proportions of inert/dead carbon and slightly lower HIlive than the upper Volgian section, but the data set is limited and includes non-source deposits.
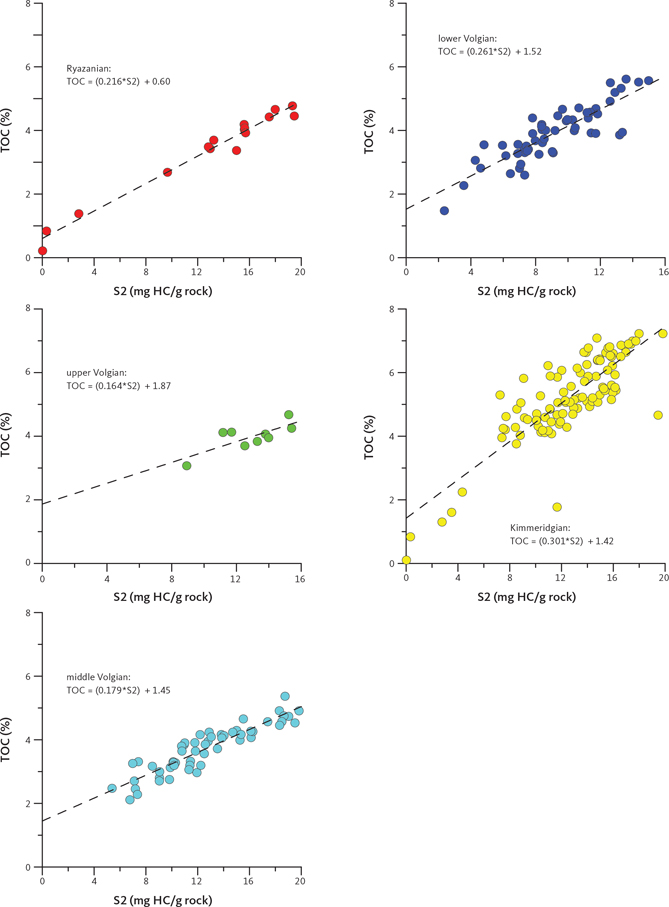
Fig. 8 Assessment of HIlive (i.e. HI of the actively petroleum-generating part of the kerogen) and dead carbon (i.e. the carbon fraction that is inert with respect to petroleum generation) per stratigraphic unit of the Rødryggen-1 borehole, following the procedure of Dahl et al. (2004). Data are listed in Table 3. S2: Pyrolytic hydrocarbons (mg/g) from Rock-Eval pyrolysis. TOC: Total organic carbon.
Several biological marker parameters and stable carbon isotope ratio data (δ13C) show trends that follow those outlined for the screening data. Representative chromatograms and ion fragmentograms for both boreholes are shown in Figs 9 and 10. Key biological markers and δ13C data are listed in Tables 4 and 5, and selected biological marker parameters and δ13C data are shown versus depth for both boreholes in Fig. 11. With some scatter, the pristane/phytane ratio shows a slight, but clear upwards-decreasing trend over the entire drilled succession, with no clear differences between the two boreholes. The isohopane ratio (Nytoft 2011) shows a much better defined, but very similar trend, i.e. a clear decrease from the base of the succession until the base of the middle Volgian succession from where the ratio seems to become stable. The homohopane ratio (Peters et al. 2005 and references therein) shows a clear increase upwards through the succession until the middle Volgian where the ratio becomes invariant. The boreholes show identical trends, but the Brorson Halvø-1 data are shifted in the order of 5 percentage points towards higher values. The Gammacerane Index in the Rødryggen-1 borehole shows upwards-increase into the lower Volgian, followed by a decrease continuing into the middle Volgian and a sharp increase and stabilisation in the middle Volgian through the Ryazanian section. In the Brorson Halvø-1 borehole, no clear trends are observed. The proportion of C30 desmethyl steranes shows a steadily upwards-increasing trend throughout the entire penetrated successions with no obvious differences observed between the two boreholes. The δ13C data shows a slight upwards-decrease in the Kimmeridgian section, which becomes more pronounced upwards through the lower Volgian section followed by stabilisation or even a slight increase in the middle Volgian through Ryazanian section. Overall, the δ13C trend is mirrored in the homohopane ratio, the isohopane ratio and the proportion of C30 desmethyl steranes. Moreover, δ13C and the pristane/phytane ratio is reasonably well correlated, with increasing isotopic depletion and decreasing average pristane/phytane ratio up-section (Fig. 12).
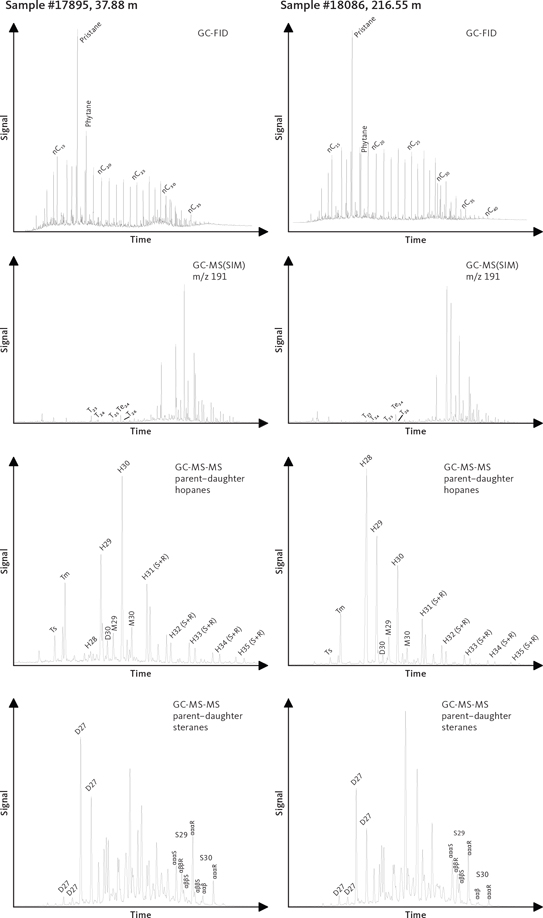
Fig. 9 Biological marker data from the Rødryggen-1 borehole. Characteristic fingerprints of samples representing the upper (sample #17895, 37.88 m, upper Volgian) and lower (sample #18086, 216.55 m, Kimmeridgian) parts of the drilled succession. GC-MS-MS parent–daughter traces for steranes and hopanes represent the sum of five and nine parent–daughter transitions, respectively.
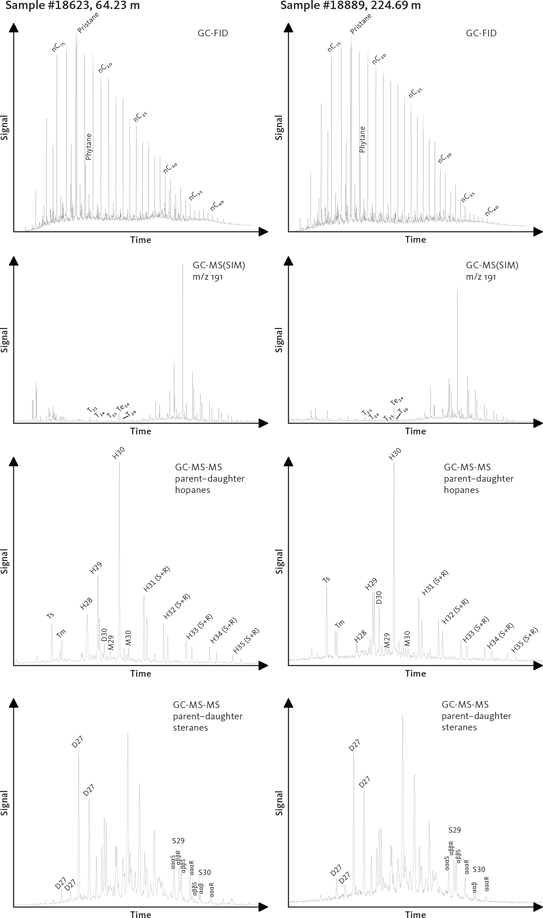
Fig. 10 Biological marker data from the Brorson Halvø-1 borehole. Characteristic fingerprints of samples representing the upper (sample #18623, 64.23 m, lower Volgian) and lower (sample #18889, 224.69 m, Kimmeridgian) parts of the drilled succession. GC-MS-MS parent–daughter traces for steranes and hopanes represent the sum of five and nine parent–daughter transitions, respectively.
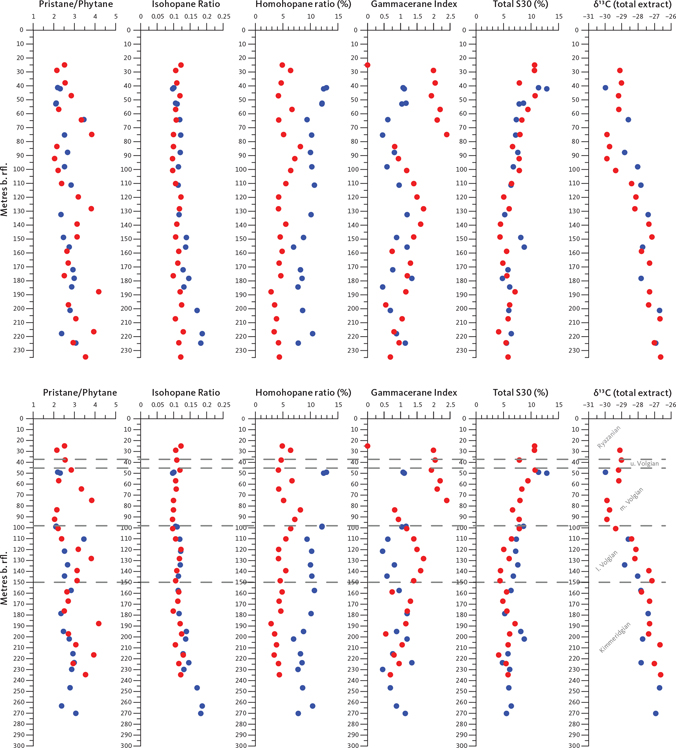
Fig. 11 Biological marker parameters versus drilled depth below reference level (b.rfl.) for the Rødryggen-1 (red symbols) and Brorson Halvø-1 (blue symbols) boreholes (upper panels) and the Rødryggen-1 (red symbols) and Brorson Halvø-1 (blue symbols) boreholes taking into account stratigraphic information (lower panels; Alsen et al. 2023). Two hiatuses in the succession penetrated by the Brorson Halvø-1 borehole have been compensated for by assuming that the thickness of the missing section equals the equivalent section in the Rødryggen-1 borehole, which shows no hiatus. Hence, only samples of the Rødryggen-1 borehole show true drilled depths, while samples below the hiatuses in the Brorson Halvø-1 section have been shifted to greater depths and may even appear deeper than the total depth (TD) of the Brorson Halvø-1 borehole. Stratigraphic ages as defined by the Rødryggen-1 borehole.
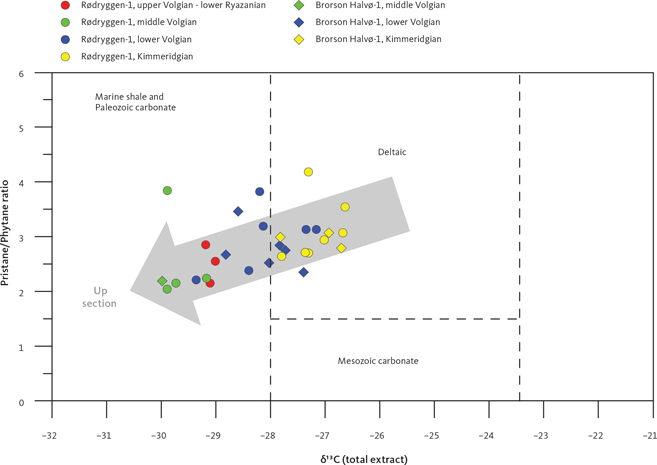
Fig. 12 Stable carbon isotope ratio (δ13C) of total extracts versus pristane/phytane ratio. Note gradual isotopic depletion occurs parallel to decreasing average pristane/phytane ratio up-section. Plot modified from Chung et al. (1992).
Superimposed on the general trends described here, minor trends can be observed in several data sets, which combined with detailed sedimentology and main and trace element data are reported by Hovikoski et al. (2023a).
4.3 Outcrop versus borehole samples: weathering effects
The proximity of the sampled outcrop profile to the Rødryggen-1 drill site allows a close comparison of borehole versus outcrop data and thus assessment of weathering effects. Key data for outcrop and correlative borehole samples are shown in Fig. 13. The contents of TOC, and hence roughly the concentration of organic matter, do not show conspicuous differences between outcrop and borehole samples, but the quality of the organic matter, using HI as a proxy, is remarkably different. With only one exception, represented by a low-value spike on the drill-core sample data curve, the HI values are consistently and significantly lower in outcrop samples compared to drill-core samples. On average, borehole data show HI values (average HI 343) that are a factor of three to four greater than the values yielded in corresponding outcrop samples (average HI 102). TS concentrations in outcrop samples (average TS = 2.4%), which due to the clayey nature of the sediments can be safely assumed to primarily represent pyritic sulphur, are approximately half of the values observed in fresh drill-core samples (average TS = 4.3%).
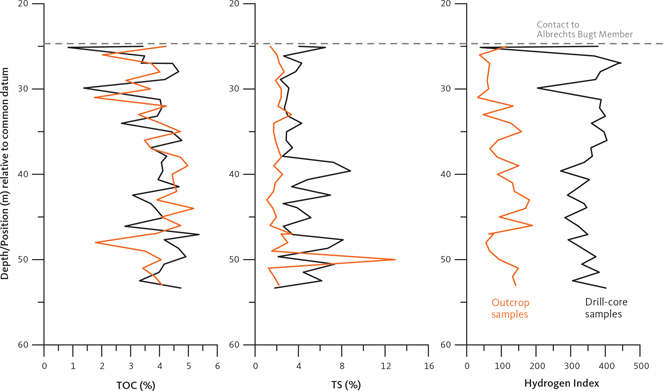
Fig. 13 Comparison of outcrop and borehole data at the Rødryggen-1 drill site. The outcrop profile was sampled using the sharp boundary to the Albrechts Bugt Member as datum. Orange curve: outcrop data. Black curve: Drill-core samples.
5. Discussion
5.1 Thermal maturity
The presence of clear and consistent gradients in several independent thermal maturity indicators over such limited depth intervals as represented by the drilled successions of the Rødryggen-1 and Brorson Halvø-1 boreholes is remarkable, but a similar trend was observed in the Blokelv-1 borehole in Jameson Land (Bojesen-Koefoed et al. 2018). The trend can be explained by considering the processes of thermal maturation and the amount of uplift and erosion that has taken place in the Wollaston Forland region. Based on apatite fission track data, Bonow & Japsen (2021) estimate that 2–3 km of sediments and volcanic deposits have been removed by erosion, which with a slightly higher than normal geothermal gradient suggests that the succession was near to or within the ‘oil window’ during the time of maximum burial. Assuming a higher-than-normal geothermal gradient seems reasonable considering rifting and magmatic activity in the area. The processes associated with thermal maturation and the conversion of kerogen into petroleum are not linear but include several ‘thresholds’, known as ‘coalification jumps’ in coal-petrographic nomenclature (Taylor et al. 1998). Such coalification jumps are defined by rapid changes in the rates of the maturation processes. Incipient petroleum generation or the start of the oil window coincides with the first coalification jump at which point several processes related to petroleum generation accelerate. This causes the non-linearity of maturation profiles commonly seen in exploration wells entering or penetrating the oil-generative window. The thermal maturity of the Rødryggen-1 and Brorson Halvø-1 successions includes the transition into or remains within, respectively, the oil-generative window. Due to rapid uplift and erosion, which removed the overlying succession, petroleum generation ceased while leaving the unusual maturity gradient. The pronounced difference in thermal maturity between the two boreholes cannot readily be explained, but it may be speculated if the Brorson Halvø area was more affected by magmatic intrusions than the central parts of the basin where the Rødryggen-1 borehole is situated. Basaltic lavas and magmatic intrusions of various sizes crop out in the Brorson Halvø area whereas none are known in the immediate vicinity of the Rødryggen-1 borehole. The effects of magmatic intrusions and hydrothermal waters on encasing sedimentary rocks are well known (e.g. Searl 1994; Bojesen-Koefoed et al. 2018, 2020).
5.2 Petroleum potential and organic facies variations
The variations in organic facies reflect large-scale variations in depositional environment linked to relative sea-level changes, which in turn can be related to phases of the rifting in the region and tectonostratigraphic development. The overall trends are cursorily discussed further here, whereas a detailed account can be found in Hovikoski et al. (2023a,b), who also describe notable differences in the detailed sedimentology of the successions drilled by the two boreholes. However, since these have little impact on the general organic geochemical character of the deposits, they are not considered here.
The Kimmeridgian succession in general represents an oxygen-restricted depositional environment, receiving considerable amounts of allochthonous/terrigenous organic matter. Towards the end of the Kimmeridgian, a gradual change occurs, pointing to increasing stagnation and reduced input of allochthonous/terrigenous organic matter and increasing proportions of autochthonous/marine organic matter in the sediments, corresponding to an overall transgression, probably eustatic in nature compounded by the effects of initial rifting (Hovikoski et al. 2023a). This is clearly demonstrated in the sediments by the decreasing levels of TOC, coinciding with steadily increasing values of HI. The transgressive trend is also manifest in decreasing pristane/phytane and isohopane ratios, increasing proportions of marine C30 desmethyl steranes and slightly decreasing δ13C (Figs 5, 11).
After a period of stabilisation in the latest part of the Kimmeridgian, the lower Volgian succession records renewed transgression and further water column stagnation, extending well into the lower part of the middle Volgian. This is shown in the deposits by stable or slightly decreasing TOC paralleled by increasing HI, further decreases in pristane/phytane and isohopane ratios, increasing homohopane ratio and proportion of marine C30 desmethyl steranes plus further carbon isotopic depletion leading to decreasing δ13C (Figs 5, 11).
Overall, the succession from the lower part of the middle Volgian through the Ryazanian seems to represent a fairly stable highstand with sediments dominated by autochthonous organic matter with a background contribution of allochthonous terrigenous organics. Minor variations may perhaps be attributed to local development of the rift. Hence, most parameters remain stable or show only weak trends.
The general trends in relative sea level largely, albeit not fully, conform to the findings of Sneider et al. (1995) and Surlyk (2003), albeit with a shift in timing suggesting somewhat younger ages of the events recorded.
The Kimmeridgian through Ryazanian succession, however, overall records a development including a gradual decrease in terrigenous input, increasing stagnation and marine organic input. This is illustrated in Fig. 12, where δ13C and the pristane/phytane ratio both decrease upwards through the section. This is also depicted as a gradual transition from ‘deltaic’ sedimentation in the Kimmeridgian towards increasingly marine sedimentation in the Volgian–Ryazanian. This development determines the petroleum-generation potential of the resulting deposits. The entire succession shows high potential for petroleum generation, developing from predominantly gas–oil-prone kerogen in the Kimmeridgian towards an increasingly oil-prone kerogen up-section (see also Section 5.4 KinexTM modelling). This is also evident from the calculation of the average characteristics for partial sections defined by chronostratigraphic breakdown (Fig. 8; Table 3). The average HI shows a steady increase from the Kimmeridgian through the upper Volgian succession, and at the same time the proportion of inert carbon remains rather stable. The data on the Ryazanian are not fully representative for the petroleum potential since the data set also includes samples from the non-source section deposited after ventilation of the basin in the later part of the Ryazanian.
5.3 Outcrop versus borehole samples: weathering effects
Compared to correlative stratigraphic intervals in the greater North Atlantic area, outcrop samples of the Upper Jurassic – Lower Cretaceous succession in East and North-East Greenland often show surprisingly low petroleum potential (Requejo et al. 1989; Christiansen et al. 1992; Strogen et al. 2005; Bojesen-Koefoed et al. 2018). The exact reason for this is not fully understood but based on the data reported in this paper as well as the observations of Bojesen-Koefoed et al. (2018) an important cause may be the very large concentrations of finely disseminated pyrite present in the shales. Weathering of pyrite will ultimately generate sulphurous and sulphuric acids, which, by their oxidising nature, may attack kerogen and reduce its petroleum potential. In addition, decomposition through microbial sulphate reduction is conceivable since several strains of sulphate-reducing bacteria seem to be facultative anaerobes, and are thus able to survive or perhaps even proliferate in oxic environments (Sass & Cypionka 2007). In the present case, the true HI may be reduced by a factor of 3 or more due to weathering (Fig. 13). Hence, although the underlying reason is not fully clear, it can be concluded that in the present case, outcrop samples are unsuitable for assessing the true potential for petroleum generation of the deposits. A common sign of weathering of pyrite is encrustations of greenish-yellow jarosite on outcrop faces, and this occurs frequently in the succession studied here. Jarosite is a potassium-iron sulphate-mineral (KFe3(SO4)2(OH)6), characteristically formed by pyrite weathering. Several published studies report similar effects but with TOC levels often much more reduced than those observed here (Leythaeuser 1973; Clayton & Swetland 1978; Raiswell & Berner 1986; Littke et al. 1991; Petsch et al. 2000; Tang et al. 2018; Pan et al. 2022). Unravelling the causes for this difference is, however, beyond the scope of the present paper.
5.4 KinexTM modelling
Variations in petroleum generation potential in the shale section of the Rødryggen-1 borehole were quantified by estimating the generated fluid phases (oil and gas) using Kinex™ modelling (ZetaWare Inc.; herein referred to simply as Kinex modelling) to calculate the Ultimate Expulsion Potential (UEP; mmboe/km2). The UEP shows the ultimate expellable volume of hydrocarbons in million barrels of oil equivalent (mmboe) per km2 if the entire shale section cored by Rødryggen-1 passed through the petroleum generation window. Calculation of the UEP applies the kinetics of organofacies B (marine clay-rich shale, largely equal to Type II kerogen; Pepper & Corvi (1995a)) and the Pepper & Corvi (1995b) expulsion model where the retention of hydrocarbons is only adsorption-controlled (hydrocarbons will expel when the adsorption threshold is exceeded). The shale section was split into 258 subsections based on cuttings sampling density, resulting in an average subsection thickness of 0.91 m. Due to thermal immaturity of the shales (vitrinite reflectance <0.61% Ro), the measured TOC and HI values for each cuttings/subsection were used. The total UEP of the c. 235 m thick shale section is c. 44 mmboe/km2, but the source-rock quality varies significantly through the shales (Fig. 14). The Kimmeridgian and lower Volgian sections show the poorest source-rock quality and are relatively gas-prone. The source-rock quality improves significantly in the middle Volgian to Ryazanian age mudstones that show increased capacity to generate liquid hydrocarbons (Fig. 14). However, overall the mudstone section in Rødryggen-1 is relatively gas-prone and does not possess the outstanding source-rock quality commonly observed in the upper Volgian and Ryazanian shales of the Kimmeridge Clay Formation and equivalents, such as the Spekk, Draupne, Mandal and Farsund Formations in the North Sea and Atlantic Margin (e.g. Von der Dick et al. 1989; Miller 1990; Chakhmakhchev et al. 1994; Klemme 1994; Telnæs et al. 1994; Fowler & McAlpine 1995; Isaksen & Ledje 2001; Ineson et al. 2003; Justwan & Dahl 2005; Justwan et al. 2005, 2006a,b; Petersen et al. 2010). The UEP can be divided into an Ultimate Expulsion Oil (UEO) and an Ultimate Expulsion Gas (UEG), which are c. 15.6 mmboe/km2 and c. 28.6 mmboe/km2, respectively. This is in line with HI values in the most oil-prone middle Volgian, upper Volgian and Ryazanian shales only reaching maximum values of 431 mg HC/g TOC, 405 mg HC/g TOC and 445 mg HC/g TOC. These moderate maximum HI values may reflect the narrow nature of the rift (approx. 30 km), which allows a background contribution of terrigenous organic matter with low potential for petroleum generation, irrespective of basin stagnation and oxygen deficiency. The relatively gas-prone character of the shales is also illustrated by the modelled cumulative expelled volumes where oil (HC6+) generation and expulsion end at about 1.0–1.1% Ro while significant gas generation continues at higher maturities (Fig. 15).
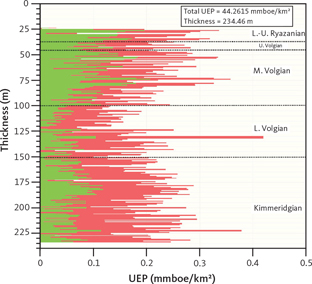
Fig. 14 Ultimate Expulsion Potential (UEP) of the cored shale section on Rødryggen-1 borehole. The UEP profile through the shales shows varying source-rock quality and generation potential in terms of generation products. The shales are relatively gas-prone, but the middle Volgian to Ryazanian shales are mostly oil-prone. L.: Lower. M.: Middle. U.: Upper.
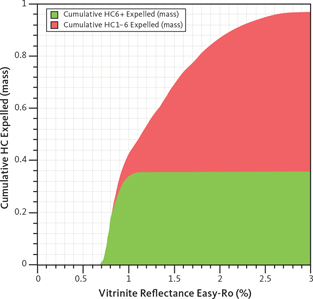
Fig. 15 Cumulative expelled C6+ hydrocarbons (oil, HC6+) and C1–5 hydrocarbons (gas, HC1–6) of the Rødryggen-borehole. Oil generation terminates at about 1.0–1.1% Ro.
6. Conclusions
The Rødryggen-1 and Brorson Halvø-1 fully cored boreholes were drilled in Wollaston Forland (North-East Greenland, approx. 74°N). They have tested the development in sedimentary environments and petroleum-source potential of Upper Jurassic – Lower Cretaceous organic-rich mudstones at two different positions within an evolving halfgraben, situated at the margin of the main North Atlantic rift system, and thus partially detached from it. The overall halfgraben is, however, segmented in several subblocks, which evolved quasi-independently through the Upper Jurassic – Lower Cretaceous. The two boreholes were thus drilled at different locations within the Permpas–Hühnerbjerg block(s), bounded by the Dombjerg Fault to the west and the Hühnerbjerg Fault to the east, which probably were the main controlling faults in the studied block during the Late Jurassic.
The Rødryggen-1 borehole was drilled to a depth of approx. 236 m, in the central part of the basin and includes an uninterrupted mudstone succession ranging in age from the upper Kimmeridgian to the upper Valanginian. The Brorson Halvø-1 borehole was drilled to a depth of approximately 226 m close to the uplifted eastern crest of the same block and includes a succession ranging in age from the upper Kimmeridgian to the lower Barremian, however with two major hiatuses in the middle Volgian and upper Volgian – Ryazanian sections.
Based on the combined indications of several independent parameters such as Tmax, vitrinite reflectance and sterane isomerization ratios, the Rødryggen-1 succession is thermally immature but approaching oil-window maturity, whereas the Brorson Halvø-1 succession is oil-window mature. The causes for the differences in thermal maturity are not clear but may be linked to the presence of abundant Palaeogene intrusions in the vicinity of the Brorson Halvø-1 drill site. Such intrusions are not known near the Rødryggen-1 drill site. Both boreholes show consistent increases in thermal maturity with depth, which is surprising considering the limited depth of the boreholes. The trends may be explained by rapid uplift, which quenched non-linear maturity trends, characteristic of the oil window. A similar trend was reported for the Blokelv-1 borehole in Jameson Land.
Bearing in mind the hiatus and the differences in thermal maturity between the two boreholes, the organic geochemical characteristics of the two successions are remarkably similar, despite the differences in setting within the graben system. Others have demonstrated notable differences in the detailed sedimentology of the two successions, but the impact of sedimentological processes on the organic matter content of the deposits seems to have been trivial in this case. This suggests that the organic matter content of the deposits was governed by higher order processes such as primary productivity and the preservation potential at the sediment-water interface, and that these factors remained rather constant irrespective of the sedimentary processes operating near the seabed.
The Kimmeridgian through Ryazanian succession in general records a transgressive development with gradual decrease in terrigenous organic matter input, increasing bottom-water stagnation oxygen deficiency and marine organic-matter input. Superimposed on the overall trend are several minor trends related to the detailed development of the rift, discussed in detail by Hovikoski et al. (2023a,b).
The petroleum-generation potential of the immature/early mature Kimmeridgian through Ryazanian succession of the Rødryggen-1 borehole may be described as oil-prone or gas–oil-prone, growing increasingly oil-prone upwards. However, Kinex modelling demonstrates that the succession is relatively gas-prone throughout due to the relatively high input of terrigenous organic matter due to the rather proximal setting of the basin compared to the outboard basins of the main rift.
A comparison of parallel sets of outcrop and drill-core samples from the Rødryggen outcrop and Rødryggen-1 borehole, respectively, shows that the HI of outcrop samples may be reduced to one third due to weathering. Although the underlying reason for this effect is not documented in full detail, it can be reasonably linked to weathering of abundant, finely disseminated pyrite present in the rocks, the products of which will attack the kerogen and deteriorate its petroleum-generation potential.
In summary, the combined evidence from the drilling of the Blokelv-1 borehole in Jameson Land and the Rødryggen-1 and Brorson Halvø-1 boreholes in Wollaston Forland (Fig. 16) indicates that continuous deposition of mudstones with high petroleum-generation potential prevailed in East and North-East Greenland over a timespan of approximately 20 million years in the Upper Jurassic – Lower Cretaceous.
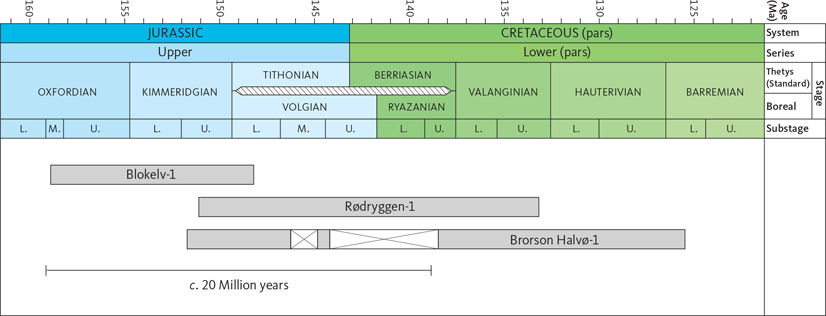
Fig. 16 Summary of the combined stratigraphic coverage of the Blokelv-1 (Jameson Land), Rødryggen-1 and Brorson Halvø-1 boreholes (Wollaston Forland). For details on the Blokelv-1 borehole, see Ineson & Bojesen-Koefoed (2018). Combined information from the three boreholes indicates that deposition of organic-rich mudstones with petroleum-generation potential prevailed for a period of approximately 20 million years in North-East Greenland during the Late Jurassic – Early Cretaceous. U.: Upper. M.: Middle. L.: Lower.
Acknowledgments
The drilling teams, including John Boserup, Anders Clausen, Peter Turner, Lars (Lasse) Thomsson, Andreas Hjort Frandsen, Anders Pilgaard and Annette Ryge, are thanked for their efforts and for keeping up the good spirits through the very challenging 2009 field season. The pilots Finn Rusanes and Göran Lindmark are thanked for diligent sling-work under very difficult conditions. Ditte Kiel-Dühring and Carsten Guvad are thanked for excellent laboratory work, and Hans Peter Nytoft is thanked for producing biological marker data. Jette Halskov and Annabeth Andersen assisted with the draft work. Helpful and constructive reviews by Drs Erdem Idiz and Iain C. Scotchman are gratefully acknowledged.
Author contributions
JABK: Writing – original draft, supervision, project administration, investigation, funding acquisition. PA: Investigation, funding acquisition. MB: Investigation. JH: Investigation, writing – original draft. PJ: Investigation. HNH: Investigation. HIP: Investigation. SP: Investigation. HV: Investigation.
