RESEARCH ARTICLE | SHORT  |
Quantifying seabed geodiversity of the Archipelago Sea, Baltic Sea, Finland
Anu M. Kaskela* , Aarno T. Kotilainen
Abstract
This study investigated the geodiversity of the Archipelago Sea in the northern Baltic Sea, focusing on geological features and their spatial distribution. By adapting methods used in previous Baltic Sea studies, we conducted spatial analyses of geological data sets including bedrock type, seabed substrates and seabed structures. Bedrock and substrate data were freely available, while seabed structures were modelled from bathymetry data. Geodiversity was quantified using a geodiversity index, which considers the variety of physical elements, roughness and area of the unit. The analyses revealed a diverse seabed environment in the Archipelago Sea with varying geodiversity throughout the study area. Significant features contributing to geodiversity included bedrock fracture and fault zones and large end-moraine formations. Similar patterns have been observed in terrestrial areas of Finland. The analyses also detected relations between archipelago zonation and geodiversity with areas of open sea more homogeneous than the middle and inner archipelago. This study formally recognises the complexity of the seabed in the Archipelago Sea and highlights the importance of understanding the geological processes shaping the region. The results can inform maritime spatial planning and sustainable resource management.
Citation: Kaskela & Kotilainen 2024: GEUS Bulletin 52. 8317. https://doi.org/10.34194/geusb.v52.8317
Copyright: GEUS Bulletin (eISSN: 2597-2154) is an open access, peer-reviewed journal published by the Geological Survey of Denmark and Greenland (GEUS). This article is distributed under a CC-BY 4.0 licence, permitting free redistribution, and reproduction for any purpose, even commercial, provided proper citation of the original work. Author(s) retain copyright.
Received: 01 Apr 2022
Revised: 25 Aug 2023
Accepted: 26 Oct 2023
Published: 27 Feb 2024
Competing interests and funding: None declared.
This study was funded by Geological Survey of Finland, the projects EMODnet (EASME/EMFF/2020/3.1.11/Lot2/SI2.853812_EMODnet – Geology 5.2) and MAAMERI as well as the FINMARI network and the VELMU programme. The study also supports implementation of the project LIFE-IP Biodiversea (LIFE20 IPE/Fl/000020). The project has received funding from the LIFE Programme of the European Union. The material reflects the views by the authors, and the European Commission or the CINEA is not responsible for any use that may be made of the information it contains.
*Correspondence: [email protected]
Keywords: Archipelago zonation, geomorphology, marine landscape, seafloor mapping, semi-automated spatial analysis
Abbreviations:
BTM: Benthic Terrain Modeler
EMODnet: European Marine Observation and Data Network
EMMA: Ecologically significant marine underwater area
VELMU: Finnish Inventory Programme for Underwater Marine Diversity
Edited by: Margaret Dolan (NGU, Norway), Verner Brandbyge Ernstsen (GEUS, Denmark)
Reviewed by: Zyad Al-Hamdani (GEUS, Denmark) and one anonymous reviewer.
1 Introduction
Geodiversity describes the natural range of geological, geomorphological and soil features along with their assemblages, relationships, properties, interpretations and systems (Gray 2004). Recognition of geodiversity helps emphasise that nature contains both abiotic and biotic components, and that both geodiversity and biodiversity should be acknowledged as part of an integrated approach to environmental management (Gray 2008; Crofts 2014).
Geodiversity assessment involves evaluating geological features and systems using either qualitative or quantitative methods. While research in this field has advanced significantly in recent years, few studies have focused on marine geodiversity (see Crisp et al. 2021). This study aimed to expand our understanding of marine geodiversity by applying regional-scale geodiversity assessment methods to a local scale in an area known as the Finnish Archipelago Sea (Fig. 1; Kaskela et al. 2012; Kaskela & Kotilainen 2017). The objectives were to document geodiversity and identify environments characterised by high geodiversity and of interest to marine resource management.

Fig. 1 Location and map of the Archipelago Sea along the south-west coast of Finland in the northern Baltic Sea. The numbered SS lines in green refer to Salpausselkä formations, which are large, marginal sedimentary ridges deposited during glacial standstills of the last deglaciation. The numbers refer to the age order of the formations: SS1 is the oldest, SS2 is of intermediate age and SS3 is the youngest. Bathymetry data from EMODnet Bathymetry Consortium (2020). Marine and terrestrial bedrock data including faults are from GTK (2014). Marine seabed substrate data are from EMODnet Geology (2021). Terrestrial substrate data are from GTK (2018). Coordinate system is EUREF FIN TM35FIN.
Located along the southwestern coast of Finland, the Archipelago Sea represents one of the most extensive archipelagos in the world (Fig. 1). This area has been shaped by geological processes over millions of years, resulting in a rich variety of landscapes, landforms and geological features that make it a hotspot for geodiversity in the Baltic Sea region. Precambrian crystalline basement, glacial erosion and deposition, uplift, extensive coastline and postglacial sedimentary processes all contribute to regionally variable topography and a mosaic of sedimentary environments (e.g. Häkkinen 1990; Virtasalo et al. 2007; Kaskela & Kotilainen 2017; Kaskela & Rinne 2018).
2 Material and methods
We analysed the geodiversity of the Archipelago Sea, adapting regional methods developed for the Baltic Sea (Kaskela et al. 2012; Kaskela & Kotilainen 2017). Spatial analyses were performed using the ArcMap 10.6 platform and the EUREF FIN TM35FIN coordinate system. For this study, we primarily used 1:100 000 scale data with the smallest cartographic unit being approximately 0.05 km2. Based on prior experience, a pixel size correlating to about 0.25 mm on a map is reasonable for spatial data analyses (e.g. Kotilainen et al. 2014). Therefore, all data sets were analysed in raster grid format with a pixel size of 25 × 25 m. The geodiversity parameters of bedrock type, seabed substrates and seabed structures, along with thematic scales that were parsed among four to five classes were adopted from a previous study (Kaskela & Kotilainen 2017).
The study area covered approximately 3900 km2 (Fig. 1). Spatial analyses were focused on marine areas only. The numerous islands in the study area were covered by integrating terrestrial and marine data into continuous layers.
2.1 Bedrock
Bedrock data covering both marine and terrestrial areas at 1:100 000 scale were obtained from Geological Survey of Finland (GTK 2014). We identified four general lithological classes of sandstone, limestone, crystalline rock and rapakivi granite (Fig. 2A).

Fig. 2 Seabed geodiversity was quantified based on A: rock type (modified from GTK 2014); B: seabed substrates (EMODnet Geology 2021); and C: Seabed structures. D: Background data showing specific geologic features (faults and Salpausselkä formations; GTK 2014; EMODnet Bathymetry Consortium 2020).
2.2 Substrate
For marine areas, we used seabed substrate data from the European Marine Observation and Data Network (EMODnet) at 1:100 000 scale (EMODnet Geology 2021). The data included five substrate categories of mud to muddy sand, sand, coarse substrate, mixed sediment and bedrock and boulders (Fig. 2B; see Kaskela et al. 2019 for details of substrate data).
For terrestrial areas, we used the superficial deposits of Finland data at 1:200 000 scale obtained from the Geological Survey of Finland (GTK 2018). Original categories were classified to approximately match the EMODnet Seabed substrates (Kaskela et al. 2019).
2.3 Seabed structures
Five seabed structures including crests, basins, valleys and troughs, plains and slopes were modelled from the elevation and bathymetry model provided by the Finnish Inventory Programme for Underwater Marine Diversity (VELMU; Fig. 2C; Rinne et al. 2014; Virtanen et al. 2018). For this purpose, the original 20 m pixel size of the bathymetry model was converted to 25 m pixels. For the modelling of the seabed structures, we adapted the approach presented in Lundblad et al. (2006), Kaskela et al. (2012) and Kaskela & Kotilainen (2017). We used the ArcMap extension Benthic Terrain Modeler 3.0 (BTM; Walbridge et al. 2018). We adjusted the neighbourhood sizes to a mesoscale based on studies by Reijonen et al. (2008), Rinne at al. (2014) and Kaskela & Rinne (2018). We used an inner radius of 1 cell for both broad and fine scales. An outer radius of 20 cells (500 m) was used for fine scale and an outer radius of 200 cells (5000 m) for broad scale. Slopes were classified based on Demek (1972) and by defining two degrees as a boundary value.
2.4 Quantifying the seabed geodiversity
Geodiversity was quantified according to a published geodiversity index (Serrano & Ruiz-Flaño 2007; Hjort & Luoto 2010) as follows:
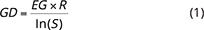
where GD is the geodiversity index, EG is the number of different physical elements (variety or richness) of the unit, R is the roughness of the unit, and S represents the area covered by the unit. EG was calculated using the ArcMap Focal Statistics tool.
The variety of features in the geological data sets were initially separately calculated per unit area and then summed for the resulting total richness layer as:
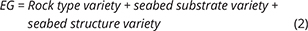
The geological data sets were considered equally important, and no weighting was applied. R represents the standard deviation of slope and is interpreted as an effective measure of surface roughness (Grohmann et al. 2011). The unit size defined by a circle with a radius of 80 cells (2000 m) was scaled from Kaskela & Kotilainen (2017).
3 Results and discussion
Results support the consensus that the Archipelago Sea represents a highly diverse and fragmented seabed environment (see Kaskela et al. 2012; Kaskela & Kotilainen 2017). Our analyses indicate geodiversity varying at local scales across the Archipelago Sea with the geodiversity index (no units) ranging from 0.2 to 5.4 (Table 1; see also Supplementary File S, for histograms of geodiversity index and its parameters). Roughness varies between 0.3 and 5.2 degrees. The total richness varies between 6 and 12 with total richness classes 9 to 11 covering approximately 96% of the area. A study of the Baltic Sea (Kaskela & Kotilainen 2017) reported total richness varying from 3 to 14 across the entire basin and richness values for the Archipelago Sea similar to those reported here.
The number of seabed substrates varies between 1 and 5, and areas with three substrates represent the most common class (c. 56%; Table 1). Structure varies between classes 2 and 5 with most areas falling into class 5 (94%). Because crystalline bedrock comprises most of the study area (99%), variability of bedrock appears low. The previous regional-scale study found a higher variety of rock types and seabed structures in the Archipelago Sea area than in other parts of the Baltic Sea (Kaskela & Kotilainen 2017).
The areas with the highest geodiversity are located near the islands of Storlandet, Jurmo and Rosala, as well as north of the Salpausselkä end-moraine formation SS3, deposited during the last deglaciation (Fig. 3). Relatively high geodiversity index values appear close to fracture zones and regions with steep slopes (Figs 1, 3A and 3C) supporting the interpretation that the structural character of the bedrock generates local-scale geodiversity (Kaskela & Kotilainen 2017). Long-term exposure of fractures and faults in the bedrock and glacial erosion may have further increased pre-glacial relief. In the Archipelago Sea, these fractures often occur as elongate channels that serve as water-exchange routes between the Bothnian Sea and the Baltic proper.

Fig. 3 Distribution of seabed geodiversity in the Archipelago Sea, northern Baltic Sea. A: Geodiversity index (no units). Index values were calculated based on B: roughness, C: total variability as established from D: rock, E: substrate and F: structure variability. Geodiversity index and roughness are represented by their minimum–maximum values. G: Background data showing specific geologic features (faults and Salpausselkä formations; GTK 2014; EMODnet Bathymetry Consortium 2020).
Areas of high geodiversity are identified in the Salpausselkä areas and particularly in the region north of SS3 (Fig. 3). The Salpausselkä formations SS1–SS3 appear in seabed surface data as geomorphic ridges and consist of sand and coarse substrate deposits that increase the geodiversity of an area.
Our geodiversity assessment agrees with that for the terrestrial landscape scale reported by Tukiainen & Hjort (2021), who found that areas near the Salpausselkä zones were among the most diverse. These authors noted that areas where bedrock influences topographic variation on land tend to have higher geodiversity. Parallels in marine geodiversity likely stem from the geological history of the region. The Baltic Sea basin has experienced multiple glaciations over the past c. 3 million years characterised by periods of intense erosion and accumulation of glacio-marine sediment. During the last glacial maximum (c. 20 ka), northern Europe and the Baltic Sea basin were completely covered by an extensive ice sheet. The entire basin had become exposed (deglaciated) by about 10 ka (Stroeven et al. 2016). Both marine and terrestrial areas show extensive glacial sedimentary cover. Glacio-isostatic processes also led to below sea-level submergence of most of Finland during this time.
In addition to bedrock type and historical glacial processes, geodiversity estimates reflect archipelago zonation. The Archipelago Sea has been classified into zones grading from coastal areas to open-marine conditions (inner, middle and outer archipelago zones; Häyrén 1900; Jaatinen 1960; Granö et al. 1999). The exposed outer archipelago areas exhibit less geodiversity compared to the other two zones. In areas outside the fracture and fault zones, the seabed environment of the outer areas was characterised by flat surfaces or basins resulting in low roughness values (Fig. 2). Visual assessment indicates that areas of high geodiversity occur in the middle and inner archipelago zones as well as in areas with high roughness values (typically greater than 2.8). Areas with multiple islands such as Rosala, Storlandet, Nötö and Gulkrona (locations in Fig. 1) exhibit higher geodiversity due to the dynamic nature of sedimentary processes occurring there as deposition and erosion vary over short distances.
As a concept, geodiversity has intrinsic value. It also provides abiotic ecosystem services (Gray 2011; Gray et al. 2013). Nature is composed of both abiotic and biotic components, and together they can inform integrated environmental-management strategies (Gray 2008; Crofts 2014). For example, geodiversity may serve as a proxy or support for biodiversity mapping by representing habitats (e.g. Kaskela et al. 2017). Ecologically significant marine underwater areas (EMMAs) were designated to enable effective marine spatial planning and sustainable use of Finnish marine areas (Lappalainen et al. 2019). Use of both ecological and geological data identifies EMMAs in the study area exhibiting high geodiversity that are likely, for example, to host endangered species, rare habitat types or diverse macroalgae and blue mussel communities. Geodiversity can therefore help to resolve ecologically significant areas or parameters.
Geodiversity may also correlate with resource availability and historical significance. Results from this study show that areas with high geodiversity, such as Rosala, are also associated with early human settlements. During the Iron Age, an important waterway passed through a nearby area (e.g. Fig. 4.1 in Mägi 2015). Prehistoric inhabitants likely used natural harbours and prioritised strategic and aesthetic aspects of the landscape arising from its geological diversity (e.g. Bourassa 1992; Gray 2004).
The present case study used geodiversity parameters and thematic scales from a previous broad-scale study (Kaskela & Kotilainen 2017). Since the study area mainly consists of crystalline bedrock and the area is predominantly characterised by the same structural class variability, the geodiversity index primarily reflects patterns in substrate variability and roughness. Future research should assess how well thematic classifications capture necessary geodiversity elements at this scale. Geodiversity parameters and classifications currently vary among quantification studies making it difficult to compare geodiversity results. While we used four to five categories for each parameter, Tukiainen & Hjort (2021) designated 16 rock types and Dolan et al. (2022, this volume) as well as Dolan & Bjarnadóttir (2023, this volume) designated 10 geomorphon classes. In addition, it is worth noting that the substrate categories themselves are not entirely comparable in terms of diversity. For instance, mixed sediment contains more grain sizes than sand. This difference in intrinsic diversity between substrate categories is not captured by the analysis presented here. To account for intrinsic substrate diversity, Dolan et al. (2022, this volume) have suggested quantifying entropy between sediment fraction layers as a possible solution. Sediment fraction maps may be estimated from categorical grain-size maps based on indicative values per sediment class. Where data permit, grain-size fractions may be modelled directly (e.g. Misiuk et al. 2019; Mitchell et al. 2019). Such an approach may also form a step in the production of categorical grain-size maps. However, direct mapping or modelling of grain-size fractions usually requires laboratory analyses, which is beyond the scope of many mapping initiatives due to cost and time constraints.
We recommend that the geodiversity research community works towards standardising geological parameters and their thematic classifications for different spatial scales across different physical elements, which represent different components of geodiversity. This will help to improve the comparability of results, especially among studies addressing similar research questions.
4 Conclusions
This study systematised and quantified physical characteristics of the Archipelago Sea. We show that the study area represents a highly diverse and fragmented marine environment with varying geodiversity throughout. The open-water marine areas display greater homogeneity, while middle and inner archipelago zones display greater geodiversity. Bedrock fracture and fault zones as well as large end-moraine formations represent significant features contributing to geodiversity. Results also identified overlap between terrestrial and marine geodiversity reflective of the recent glacial history of the region. Future research should focus on establishing a consensus on the geological parameters and their thematic classifications applied at given spatial scales to better integrate finding across different studies. Geological features and geodiversity contribute to the aesthetics, historical significance and ecosystem services in the study area. Quantifying these parameters can inform best management practices and sustainable use of marine and coastal areas. Recognising unique geological features that shape our landscape can help preserve environmental resources for future generations.
Acknowledgements
The study was conducted as part of the MAAMERI research project ‘Strengthening the knowledge base for improving the status of coastal waters in the Archipelago Sea’. Research infrastructure facilities were provided by FINMARI (Finnish Marine Research Infrastructure network) and data were provided by VELMU (Finnish Inventory Programme for Underwater Marine Diversity) and EMODnet (European Marine Observation and Data Network, funded by the European Climate, Infrastructure and Environment Executive Agency (CINEA) through contract EASME/EMFF/2020/3.1.11/Lot2/SI2.853812_EMODnet – Geology 5.2). The study also supports implementation of the LIFE-IP Biodiversea (Enhancing the marine and coastal biodiversity of the Baltic Sea in Finland and promoting the sustainable use of marine resources, LIFE20 IPE/Fl/000020) project. We are grateful to Eija Eräkare for her assistance with some of the analyses. Reviewers are thanked for their valuable and constructive feedback. The staff at GEUS Bulletin are acknowledged for their patience, professionalism, and assistance with the manuscript. Figures showing depth model or its derivatives have been published with permission AR23694 from the Finnish Defence Office.
Additional information
Author contributions
AMK: modelling, statistical analyses and preparation of the first draft. ATK: drafting and revision of the manuscript.
Additional files
One supplementary file containing histograms of geodiversity index and its parameters is available at https://doi.org/10.22008/FK2/YI15YL.