MONOGRAPH
The PGE-Au Mineralisation of the Skaergaard intrusion: precious metal minerals, petrography and ore genesis
Nikolay S. Rudashevsky1, Troels F.D. Nielsen2* , Vladimir N. Rudashevsky1
1CNT Instruments LLC, St. Petersburg, Russia. 2Department of Mapping and Mineral Resources, Geological Survey of Denmark and Greenland (GEUS), Copenhagen, Denmark.
Citation: Rudashevsky et al. 2023: GEUS Bulletin 54. 8306. https://doi.org/10.34194/geusb.v54.8306
Copyright: GEUS Bulletin (eISSN: 2597-2154) is an open access, peer-reviewed journal published by the Geological Survey of Denmark and Greenland (GEUS). This article is distributed under a CC-BY 4.0 licence, permitting free redistribution, and reproduction for any purpose, even commercial, provided proper citation of the original work. Author(s) retain copyright.
Received: 04 Nov 2021; Revised: 16 June 2022; Accepted: 13 Dec 2022; Published: 27 July 2023
Competing interests and funding: The authors declare no competing interests besides that Nikolay S. Rudashevsky and Vladimir N Rudashevsky are affiliated with the commercial company, CNT Instruments LLC.
These investigations were co-financed by the Geological Survey of Denmark and Greenland (GEUS) and CNT Instruments LLC.
*Correspondence: [email protected]
Keywords: Skaergaard intrusion, precious metal minerals, syn-magmatic, crystal mushes, South-East Greenland
Abbreviations
BSE: backscattered electron
BQ: drill core standard, diameter 36.5 mm.
ECD: equivalent circle diameter
EMP: electron microprobe
QFM: quartz-fayalite-magnetite
ƒO2: oxygen fugacity
HFSE: high field strength elements
HRXCT: High Resolution X-ray Computed Tomography
HS: hydro-separation
HZ: Hidden Zone
IMA: International Mineralogical Association
iss: intermediate solid solution
LA-IСP-MS: Laser Ablation Inductively Coupled Plasma Mass Spectrometry
LLD: Liquid Line of Descent
LS: Layered Series
LZ: Lower Zone
MBS: Marginal Border Series
MZ: Middle Zone
PGE: platinum group elements
SEM: Scanning Electron Microscope
T: temperature
ToF: Toe of Forbindelsesgletscher
UBS: Upper Border Series
UZ: Upper Zone
Edited by: Rune Berg-Edland Larsen (NTNU, Norway)
Reviewed by: Federica Zaccarini (Montanuniversität Leoben, Austria), Eduardo Teixeira Mansur (Geological Survey of Norway).
Abstract
The Skaergaard PGE-Au Mineralisation, alias the Platinova Reef, is hosted in a series of mineralisation levels within a suite of bowl-shaped macrorhythmic layers in the upper Middle Zone of the Skaergaard intrusion. The intrusion is exposed 68°N in East Greenland. The occurrence defines its own type due to its exceptional structure and mineralogy. A wealth of mineralogical data is available in laboratory reports for individual samples and in peer-reviewed publications, but none of these account for the lateral and stratigraphic distribution of PGE and Au parageneses in the gabbros of the intrusion. In this study, we collate and describe the mineralogical data for the first-formed PGE-rich and last-formed gold-rich mineralisation levels and integrate these with petrogenetic models.
Recovery of >4000 grains of precious metal phases allow a detailed study of their distribution and compositions throughout the mineralisation, re-equilibration during cooling, inter-grain relationships and relationships to Cu-Fe sulphides and the gabbroic host rocks. The sulphides are dominated by bornite, chalcocite and minor chalcopyrite. All other sulphides, such as pentlandite, are very rare. Fifty-four different precious metal phases are identified in this study, and include the new IMA approved minerals skaergaardite (PdCu), nielsenite (Pd3Pb) and naldrettite (Pd2Sb). Precious metal phases include (1) intermetallic compounds and alloys of Cu and Pd; (2) intermetallic compounds and alloys of Au and Cu (Ag); (3) sulphides of Pd, Cu (Ag, Cd, Hg, Tl); (4) arsenides of Pd (Pt, Ni) and (5) intermetallic compounds of Pd, Cu with Sn, Pb, Te (Sb, Bi). Skaergaardite (PdCu) is the dominant PGE mineral in the lower and main PGE mineralisation level (Pd5). It is accompanied at the western margin of the intrusions by the sulphides vasilite (Pd16S7) and vysotskite (PdS) but is rare at the eastern margin, which is dominated by plumbide zvyagintsevite (Pd3Pb). Gold phases include a suite of intermetallic compounds and alloys from AuCu3 to native gold and are dominated by tetra-auricupride (AuCu). Gold is concentrated in the tops of individual mineralisation levels and in the uppermost precious metal–bearing mineralisation level, followed by stratiform Cu-rich mineralisation levels.
Precious metal parageneses demonstrate formation and re-equilibration from liquidus to subsolidus temperatures and control by local geochemical environments. The mineralisation is syn-magmatic and the result of fractionation and evolution in the remaining bulk-silicate liquid and crystal mushes. Fractionation led to sulphide saturation and formation of immiscible sulphide melt droplets. This was followed by reaction with mush melts and re-equilibration to lower temperatures, first under the roof and subsequently after slumping to the floor in mushes of macrorhythmic layers. Droplets of sulphide melt formed between 1030–1050°C and trapped precious metals. The subsequent reaction between sulphide melt and interstitial Fe-rich immiscible melt at c. 1015°C, and redistribution to coexisting melt and fluid, led to the separation of PGE, Au and Cu and their up- and inward transport. Magmatic fluids as well as volatile-rich residual silicate melts were retained in gabbros at the margins and resulted in precious metal parageneses in equilibrium with hydrous low-temperature silicate parageneses.
1 Introduction
A potentially economic palladium and gold mineralisation was discovered in the Skaergaard intrusion in the late 1980s. The 56 Ma layered gabbro intrusion is located 68°N on the east coast of Greenland and has played a fundamental role in the development of igneous petrology (e.g. Wager & Brown 1968). More surprising, and of geological importance, is the 1986 discovery of the large precious metal mineralisation. The estimated resource is >30 million ounces of platinum group elements (PGEs) dominated by palladium (Pd) and c. 9 million ounces of gold (Au) in an estimated ore reserve of 1.8 billion tons. It is a surprisingly large amount of precious metal in an intrusion with an original total volume of no more than c. 300 km3. PGE and Au deposits occur in a succession of mineralisation levels hosted in five macrorhythmic layers (Nielsen et al. 2019a). Mineralisation level Pd5 in the lowermost of these layers is approximately 5 m thick at lower and upper cutoff grades of 0.7 ppm precious metals. Assays are found in Watts, Griffis & McOuat Ltd (1991). Pd5 is estimated to host c. 450 million tons of ore rich in palladium with an average precious metal content of c. 2 ppm over a width of 5 m (Nielsen et al. 2005; Kuo 2007). The cutoff is the assumed minimum grade required for economic exploitation of the resource. Material with <0.7 ppm precious metal is considered waste.
The mineralisation was initially referred to as the Platinova Reef (Bird et al. 1991) and named after the exploration company that discovered the mineralisation. It is not a reef in any common sense of the word, but a series of stratiform, bowl-shaped layers of gabbro enriched in precious metals (Nielsen et al. 2015). The mineralised gabbros show remarkable and systematic lateral and stratigraphic variations in ratios between PGE and Au and between precious metals and copper (Andersen et al. 1998). Due to its structure and the distribution of the precious metals, the mineralisation was defined as its own type and is thus referred to as “Skaergaard-type” by Miller & Andersen (2002).
The mineralisation is here, and following Nielsen et al. (2015, 2019a), referred to as the Skaergaard PGE-Au Mineralisation. This term avoids conceptional associations to other entirely PGE and, for example, nickel-rich (Ni) and/or copper-rich (Cu) or chromite-related reef-type mineralisations in layered mafic intrusions. Examples include sill complexes in western Siberia (Russia), Sudbury-type occurrences (Canada), the Merensky reef and Platreef mineralisations in the Bushveld Igneous Complex in South Africa and the J-M Reef in the Stillwater intrusion, Montana, USA (e.g. Barnes et al. 2017). Unlike most of these PGE-rich deposits, the precious metal mineralisation in the Skaergaard intrusion is very poor in platinum, copper, nickel and sulphur. The Sonju Lake (Minnesota, USA; Maes et al. 2007) and the Rincon del Tigre (Bolivia; Prendergast 2000) deposits are also referred to as Skaergaard-type.
The significant differences in styles of mineralisation and marked paragenetic mineralogical variations reflect the diversity in genesis of PGE-rich ores. Classic petrogenetic models, inspired by the PGE occurrences in, for example, the Bushveld Igneous Complex, argued for orthomagmatic origins and formation of immiscible sulphide droplets that equilibrate with bulk liquid (e.g. Naldrett 2004, 2011). The sulphide droplets scavenge the precious metals due to very high distribution coefficients for precious metals between sulphide and silicate liquids. The high-density droplets subsequently accumulate at or in the crystallisation front in reefs of layered mafic intrusions. Sulphide saturation in bulk liquid can be caused by many different processes (Barnes et al. 2017), such as magma mixing, contamination and fractional crystallisation. Alternatively, PGE-rich ores were proposed to be the result of redeposition of precious metals, scavenged from already crystallised gabbro and transported in late residual melts or fluids in solidifying magma chambers (e.g. Boudreau & Meurer 1999; Boudreau 2019).
Neither of these models, however, explain the extremely well-controlled stratigraphic distribution of PGE and Au in the layered gabbros of the Skaergaard intrusion (Nielsen et al. 2015), or the lateral variations in the precious metal parageneses (Nielsen et al. 2019a). A concordant layer that can be followed across a layered gabbro intrusion is in a classic orthomagmatic model understood to be a time marker. Such a layer is formed at a specific stage in the evolution of the bulk magma, and the layer would be expected to have a composition that reflects the evolutionary stage of the bulk liquid. In any given concordant layer, primary and preserved sulphide droplets should have a near-constant composition. That is not observed in the Skaergaard PGE-Au Mineralisation. Nielsen et al. (2005, 2015, 2019a) therefore developed a petrogenetic model for Skaergaard-type mineralisations. The proposed model combines previously suggested processes into a more complex model that includes a succession of ortho- to late-magmatic processes. Of fundamental importance was the recognition of the role played by in situ sulphide saturation in melts of crystal mushes, reaction with Fe-rich immiscible mush melts and the coexistence of immiscible silicate melts, immiscible sulphide melts, and hydrous fluids in crystal mushes below the roof and in the intermittent floor of the layered gabbros. The importance of mush-stage processes is best illustrated by the voluminous mantles and rims on liquidus cores of plagioclase in Namur et al. (2014; see also Nielsen et al. 2019b).
In this study we compile and describe available information on stratigraphic and lateral variations in the parageneses and compositions of the precious metal phases in the type-defining Skaergaard intrusion. The compilation of mineralogical data is based on numerous laboratory reports and peer-reviewed studies, and can serve as reference for other Skaergaard-type mineralisations. The lateral variations in mineralogy (Nielsen et al. 2019a) and bulk-rock composition (Nielsen et al. 2015) are explicit in lithological layers that are traced across the intrusion. No single profile or combined profile (e.g. Holwell et al. 2016) is representative and cannot be used as the basis for modelling of the type of processes responsible for all of the Skaergaard PGE-Au Mineralisation. It is also noted that no simple relationship exists between the observed distribution of all precious metal minerals and the evolution of the contemporary bulk liquid (Nielsen et al. 2019a).
We subsequently integrate the mineralogical information with the proposed petrogenetic model of Nielsen et al. (2015). The integration of data and model provides constraints for the succession of processes responsible for the mineralisation, from the initiation of bulk-liquid crystallisation to low-temperature (T) re-equilibration of the precious metal parageneses.
The initial accumulation of the precious metals was apparently a short-lived event while the melt cooled from c. 1050°C to 1030°C, whereas the redistribution of precious metals and re-equilibration of parageneses continued long after initial, and strictly concordant accumulation of the precious elements in the intermittent floor of the intrusion. We underpin that the Skaergaard-type PGE-Au mineralisation is a distinct type of syn-magmatic mineralisation and the result of a complex interplay between processes in crystal mushes over a wide temperature range between liquidus and solidus, and a potential source of critical commodities in comparatively small and evolved tholeiitic intrusions of limited size.
An introduction to the Skaergaard intrusion and its mineralisation is given in Chapter 2. Methods used in the original mineralogical investigations are briefly described in Chapter 3. In Chapter 4, we synthesize the precious metal mineralogy, phase compositions, phase relations and parageneses of the Skaergaard mineralisation including descriptions of the gabbroic host (4.1) and ore minerals (4.2), followed by the petrographic relations between host rocks, sulphides and precious metal phases (4.3). In Chapter 5, we identify and discuss constraints for the development of the integrated mineralogical and petrogenetic mineralisation model, including the composition of bulk liquid at mineralisation (5.1), timing and temperature of sulphide saturation (5.2), evidence for a high-T origin of initial distribution of precious metals and the first-formed precious minerals and phases (5.3). We then consider the composition of coexisting fluid and reactions (5.4), low-T re-equilibration of the precious metal minerals (5.5) and petrographic information relevant to ore beneficiation (5.6). Finally, the combined petrogenetic and mineralogical mineralisation model is presented in Chapter 6.
2 The Skaergaard intrusion
The layered gabbros of the Skaergaard intrusion (Fig. 1) have been studied in significant detail for more than 75 years (Brooks 2011). It is due to exposure and preservation of the gabbros in the Arctic climate that these rocks are regarded as a foremost natural laboratory for the study of the fractionation of basaltic magma and processes in shallow crustal magma chambers (e.g. Wager & Deer 1939; Wager & Brown 1968; McBirney 1996; Irvine et al. 1998; Nielsen 2004; Tegner et al. 2009; Holness et al. 2011; Nielsen et al. 2015). The intrusion was emplaced 56.02 million years ago during the opening of the North Atlantic (Larsen & Tegner 2006; Wotzlaw et al. 2012). The intrusion has a box-like shape with the surface dimensions of c. 11 x 7.5 km and an original average height of the magma column of c. 3.8 km. The magma chamber had a volume of approximately 300 km3 (Nielsen 2004; Svennevig & Guarnieri 2012) and was filled over a short period of time (Annen et al. 2022). The western and northern margins of the intrusion are chilled to Precambrian basement rocks, and at the eastern and southern margin to Palaeogene basalts. Minor Palaeogene sediments are found at the western and eastern margins. The intrusion was emplaced during flexuring of the continental margin, was tipped to the south after emplacement, and during the late stages of solidification, it was intruded by gabbroic sills and subsequently by alkaline and transitional dyke swarms (Nielsen 1978; Wotzlaw et al. 2012).
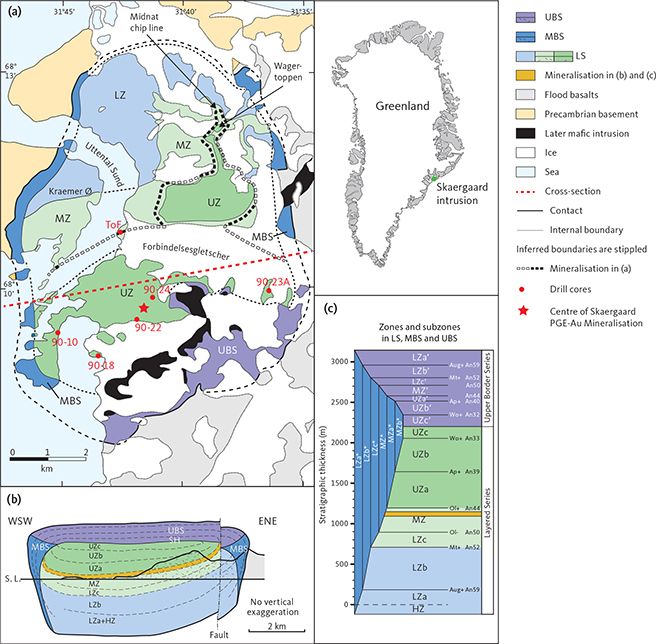
Fig. 1 Overview of the Skaergaard intrusion. a: Simplified geological map slightly modified from Nielsen et al. (2015, 2019a), showing the Layered Series (LS), the Marginal Border Series (MBS) and the Upper Border Series (UBS). The subzones of the LS include the Lower Zone (LZ), Middle Zone (MZ), and Upper Zone (UZ). In red, the collar locations for drill cores 90-10, 90-18, 90-23A and 90-24 and sampling site ‘Toe of Forbindelsesgletscher’ (ToF). b: WSW–ENE section (red stippled line in (a)) through the intrusion with subdivisions as in (a), and subzones a, b and c in LZ and UZ. c: Correlation between zones and sub-zones of LS, MBS and UBS (modified from Salmonsen & Tegner 2013).
The bulk composition of the magma is debated, not only because it is difficult to sum up the compositions of the intrusion, but also because the magma chamber was filled in by multiple pulses of magma over a very short time span (Hoover 1989: Holness et al. 2007; Annen et al. 2022). In addition, only a small part of the roof is preserved, and only assumptions can be made as to what has been lost to erosion. All proposed compositions, however, point to a bulk composition comparable to tholeiitic lavas contemporaneous with the intrusion and present during the opening of the North Atlantic. A bulk composition comparable to that of evolved basalt (magnesium number (Mg#) c. 45–50) of the Geickie Plateau Formation is suggested by Andreasen et al. (2004) and Nielsen (2004), whereas Jakobsen et al. (2010) and Cho et al. (2022), preferred a composition comparable to that of the underlying Milne Land Formation. Nielsen et al. (2019b), however, supported a correlation to Geikie Plateau Formation lavas based on comparatively simple, but seemingly robust, major element characteristics.
The bulk magma crystallised inward from roof, walls and floor in an onion ring-like structure. The intrusion is subdivided into the Layered Series (LS) in the floor, the Marginal Border Series (MBS) on the walls, and the Upper Border Series (UBS) below the roof of the magma chamber (Fig. 1). The three series are further subdivided into zones and subzones based on parallel evolutions in liquidus parageneses (Salmonsen & Tegner 2013). In LS, they include the Hidden Zone (HZ; of the lowermost and non-exposed gabbros), Lower Zone (LZ), Middle Zone (MZ) and Upper Zone (UZ). The division is based on the occurrence of liquidus olivine, which is Mg-rich in the LZ, generally absent in the MZ, and Fe-rich in the UZ. The LZ is further subdivided into LZa, LZb and LZc based on the arrival of clinopyroxene on the liquidus at the base of LZb and, subsequently, titanomagnetite and ilmenite at the base of LZc. The UZ is subdivided into UZa, UZb and UZc. These subdivisions are based on the arrival of apatite on the liquidus at the base of UZb, and the occurrence of mosaics of grains of ferrohedenbergite replacing inverted β-ferrobustamite at the base of UZc (Wager & Brown 1968). The same succession in the arrivals of the liquidus phases allows parallel subdivision of the MBS (Hoover 1989) into LZa*, LZb*, LZc*, MZ*, UZa* and UZb* (UZc*is not identified) and of the UBS into LZa’, LZb’, LZc’, MZ’, UZa’, UZb’ and UZc’ (Salmonsen & Tegner 2013; Fig. 1).
2.1 The Skaergaard PGE-Au Mineralisation
The Skaergaard PGE-Au Mineralisation, also referred to as the Platinova Reef, is a complex multi-layered, low-sulphur type deposit found in gabbros rich in FeTi oxides in the upper 100 m of the MZ (Bird et al. 1991; Andersen et al. 1998). The upper MZ is composed of a series of macrorhythmic layers, three of which have distinct leucogabbro tops referred to as L1, L2 and L3. The leucogabbro layers contain up to 70 vol.% plagioclase and are collectively referred to as the Triple Group. L1, L2 and L3 can be traced by eye across the intrusion (Fig. 2). All macrorhythmic layers have comparatively plagioclase-rich tops, and clinopyroxene-rich bases (Nielsen et al. 2015). The corresponding more mafic gabbros below the leucogabbro layers are referred to as M1, M2 and M3 (Wager & Brown 1968). The macrorhythmic layers are commonly separated by a layer with a low concentration of titanomagnetite and ilmenite compared to the rest of the gabbros of the Triple Group (Nielsen et al. 2015). Such a 2 m thick layer below M1 is referred to as L0, although it is not to be compared to the plagioclase-rich tops of macrorhythmic layers.
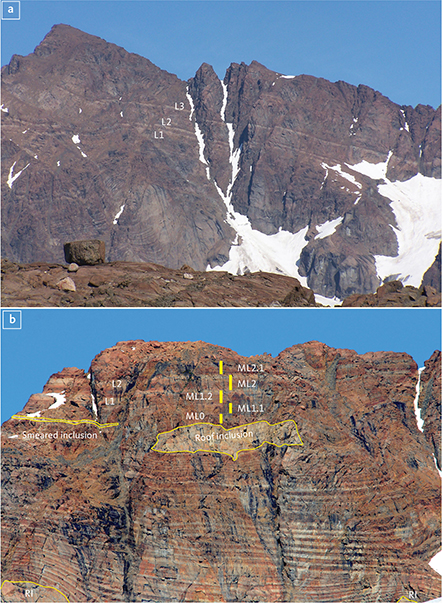
Fig. 2 The leucogabbro layers (L1, L2 and L3) of the Triple Group on Wagertoppen. a: L1 to L3 on the western face of Wagertoppen (1277 m). Large sunken blocks of roof gabbro (RI: roof inclusions) disturb the layering. In some cases, the layering drapes around the blocks (photo: M.B. Holness). b: L1 and L2 on the NW face of Wagertoppen with distinct modal layering of the zebra-banded zone at its base. Several sunken roof blocks are fully preserved or smeared (photo: J.C.Ø. Andersen). Macrorhythmic layers ML0 to ML2.1 with leucogabbro tops are indicated by the yellow bars. The upper metres of ML0 host the Pd5 mineralisation level, and ML2.1 hosts Pd1/Au (modified from Nielsen et al. 2019a).
In the centre of the intrusion, the precious metals are concentrated in stratiform layers in the lower 50 m of the Triple Group. Marked lateral variations are observed in concentrations and ratios of precious metals, in precious metal mineralogy, parageneses and in concentrations of Cu (Andersen et al. 1998; Nielsen et al. 2005, 2015, 2019a). The central part of the mineralisation is skewed slightly SW of the geographic centre of the intrusion (red star in Fig. 1; Nielsen et al. 2019a). Here, the Skaergaard PGE-Au Mineralisation is hosted in macrorhythmic gabbro layers ML0, ML1.1, ML1.2, ML2, ML2.1 and ML2.2 (Fig. 3). The macrorhythmic layers were named after the related leucogabbro layers, including L1 and L2 of the Triple Group. Each macrorhythmic layer hosts two mineralisation levels: a lower and an upper (Nielsen et al. 2019a; Fig. 3; Table 1). The Pd-rich mineralisation levels are numbered from the top as Pd1/Au, Pd1, Pd2a, Pd2b, Pd3a, Pd3b, Pd4a, Pd4b, Pd5 and Pd6 (Fig. 3). The naming of the mineralisation levels is reminiscent of the early phases of exploration.
| Sample no. a | Mineralisation level | Sample weight (kg) | Pd | Pt | Au | Pd | Pt | Au | No. of grains |
| (ppb) | (% of (Pd+Pt+Au)) | ||||||||
| 10-434 | Pd4a | 0.72 | 529 | 35 | 1587 | 24.6 | 1.6 | 73.8 | 89 |
| 10-443 | Pd5 | 0.78 | 2787 | 137 | 282 | 86.9 | 4.3 | 8.8 | 52 |
| 10-445 | Pd5 | 0.58 | 2491 | 129 | 142 | 90.2 | 4.7 | 5.1 | 23 |
| 18-958 | Pd1/Au | 0.97 | 351 | 37 | 283 | 52.3 | 5.5 | 42.2 | 33 |
| 18-972 | Pd2a | 0.80 | 745 | 39 | 114 | 83.0 | 4.3 | 12.7 | 60 |
| 18-978 | Pd2b | 0.80 | 1051 | 28 | 241 | 79.6 | 2.1 | 18.3 | 157 |
| 18-988 | Pd3b | 0.83 | 987 | 105 | 150 | 79.5 | 8.5 | 12.1 | 33 |
| 18-1001 | Pd4a | 1.19 | 668 | 74 | 59 | 83.4 | 9.2 | 7.4 | 25 |
| 18-1010 | Pd5 | 0.80 | 1747 | 196 | 126 | 84.4 | 9.5 | 6.1 | 180 |
| 18-1012 | Pd5 | 0.72 | 1240 | 175 | 46 | 84.9 | 12.0 | 3.1 | 116 |
| 22-977 | Au+1 (Cu) b | 1.05 | 70 | 15 | 140 | 31.1 | 6.7 | 62.2 | 9 |
| 23A-798 | Pd4a | 0.53 | 360 | 22 | 2000 | 15.1 | 0.9 | 84.0 | 180 |
| 23A-806 | Pd5 | 0.56 | 1600 | 110 | 250 | 81.6 | 5.6 | 12.8 | 86 |
| 23A-807 | Pd5 | 0.76 | 2800 | 140 | 270 | 87.2 | 4.4 | 8.4 | 165 |
| 23A-808 | Pd5 | 0.71 | 2300 | 120 | 52 | 93.0 | 4.9 | 2.1 | 116 |
| 24-1018 | Pd1/Au | 0.54 | 100 | 20 | 4500 | 2.2 | 0.4 | 97.4 | 320 |
| 24-1022 | Pd1 | 0.70 | 1046 | 132 | 814 | 52.5 | 6.6 | 40.9 | 172 |
| 24-1024 | Pd2-Pd1 | 0.99 | 30 | 10 | 10 | 60.0 | 20.0 | 20.0 | 4 |
| 24-1030 | Pd2a | 1.16 | 690 | 20 | 97 | 85.5 | 2.5 | 12.0 | 60 |
| 24-1034 | Pd2b | 0.92 | 1300 | 90 | 467 | 70.0 | 4.8 | 25.1 | 271 |
| 24-1042 | Pd3a | 1.45 | 620 | 20 | 97 | 84.1 | 2.7 | 13.2 | 83 |
| 24-1045 | Pd3b | 1.02 | 580 | 40 | 52 | 86.3 | 6.0 | 7.7 | 247 |
| 24-1048 | Pd4a | 1.14 | 630 | 50 | 52 | 86.1 | 6.8 | 7.1 | 122 |
| 24-1053 | Pd4b | 0.98 | 720 | 20 | 24 | 94.2 | 2.6 | 3.1 | 78 |
| 24-1056 | Pd5 | 0.78 | 2000 | 190 | 112 | 86.9 | 8.3 | 4.9 | 116 |
| 24-1057 | Pd5 | 0.78 | 2800 | 170 | 97 | 91.3 | 5.5 | 3.2 | 373 |
| 24-1059 | Pd5 | 1.10 | 1200 | 110 | 30 | 89.6 | 8.2 | 2.2 | 102 |
| 24-1062 | Pd5 | 1.30 | 720 | 110 | 24 | 84.3 | 12.9 | 2.8 | 33 |
| BS0304 c | Pd2 | 2.33 | 430 | 50 | 2130 | 16.5 | 1.9 | 81.6 | 490 |
| BS0301 c | Pd5 | 1.94 | 2830 | 170 | 240 | 87.3 | 5.2 | 7.4 | 594 |
| a Sample number is comprised of the drill core number (e.g. 24) followed by sample depth (m). For example, sample no. 24-1062 refers to material sampled at 1062–1063 m in drill core 90-24. b Cu-rich and Au-poor sample from Au+1 mineralisation level in drill core 90-22. c BS refers to Bulk Sample (ToF). Mineralisation levels (pd5, Pd4b, etc.) are named after the dominant precious metal. HS-01 separator was used for sample 23A-806, -807, -808, 18-1010 and 24-1057, HS-02M was used for sample 23A-798 and HS-11 for all others. | |||||||||
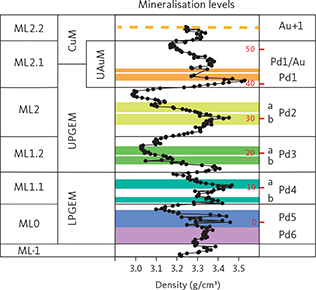
Fig. 3 Summary of the Skaergaard mineralisation. From left to right: macrorhythmic layers (ML-1 to ML2.2); geochemical subdivisions of the mineralisation, includes the Lower PGE Mineralisation (LPGEM), Upper PGE Mineralisation (UPGEM), Upper Au Mineralisation (UAuM) and Cu Mineralisation (CuM, see Nielsen et al. 2015 for detailed explanations); density (g/cm3) of bulk rocks and mineralisation levels from centrally-located drill cores; and mineralisation levels (Pd6 and Pd5 in ML0, Pd4a, b in ML1.1, Pd3a, b in ML1.2, Pd2a, b in ML2 and Pd1 and Pd1/Au in ML2, and Au+1 in ML2.1). Au+1 (stippled orange line) is only found in drill core 90-18. This concordant mineralisation level is Cu-rich and poor in precious metals in all other drill cores. The PGE peak in Pd5 (designated 0 m in the mineralisation) provides a marker throughout the intrusion (Nielsen et al. 2015; Fig. 4a). The correlations in the 15–40 m succession of mineralisation levels are based on systematic assays in Watts, Griffis & McOuat Ltd (1991). Figure modified from Nielsen et al. (2015, 2019a).
Mineralisation levels, macrorhythmic layers and lithological layers have been shown to maintain near-constant stratigraphic thicknesses and separation across the intrusion (Fig. 4a). The stratigraphically lowest mineralisation levels, Pd6 and Pd5, are hosted in macrorhythmic layer ML0. Pd5 is the main PGE resource of the deposit. It is 5 m thick at a cutoff c. 0.7 g/t (ppm) in the central parts of the intrusion where it has an average grade of c. 2 g/t (PGE+Au) over 5 m. Pd5 can be up to 8 m thick at the same cutoff grades near the margin of the intrusions (Nielsen et al. 2019a). ML1.1 hosts mineralisation levels Pd4b and Pd4a, ML1.2 hosts mineralisation levels Pd3b and Pd3a, ML2 hosts mineralisation levels Pd2a and b, ML2.1 hosts mineralisation level Pd1 and Pd1/Au (Fig. 3; Nielsen et al. 2019a), ML2.2 hosts the PGE-poor mineralisation level Au+1. In general, the Au/PGE ratio increases up through the mineralisation levels (Andersen et al. 1998; Nielsen et al. 2005; Holwell & Keays 2014) from c. 0.028 in Pd6 (drill core 90-22; Bernstein & Nielsen 2005) to a maximum of 13 in the Au+1 peak in drill core 90-18 (Watts, Griffis & McOuat Ltd. 1991). The upward increase in Au/PGE is also seen in individual mineralisation levels due to fractionation in mushes of the macrorhythmic layers. Above the uppermost Au-rich mineralisation level follows a series of at least eight stratiform and Cu-rich levels with negligible concentrations of PGE and Au (Nielsen et al. 2015).
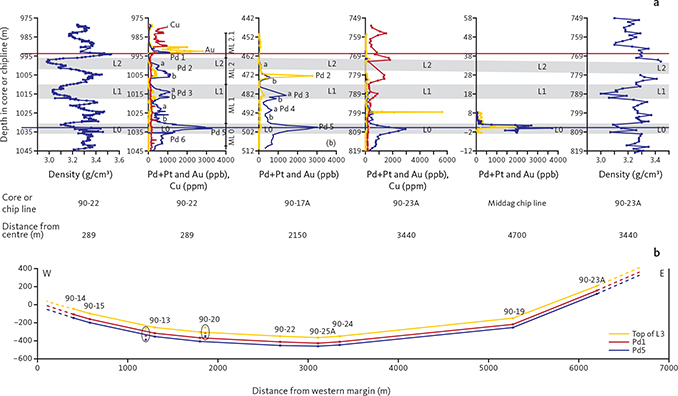
Fig. 4 Correlation between elemental concentrations and lithology of host gabbro in the Skaergaard PGE-Au Mineralisation. a: PGE, Au and Cu concentrations and density profiles of the Skaergaard PGE-Au Mineralisation. The correlations demonstrate the continuity of layering, mineralisation levels and lateral variations in elemental distributions. Blue: PGE (Pd+Pt); yellow: Au, and red: Cu. From left to right: density profile and (Pd+Pt), Au and Cu in the centrally located drill core 90-22, 25 cm bulk-rock samples; (Pd+Pt) and Au in drill core 90-17A located 1150 m from the western margin, 1 m bulk-rock samples; (Pd+Pt), Au and Cu in drill core 90-23A located 900 m from the eastern margin of the intrusion; and (Pd+Pt), Au and density profile in the Middag chip line profile, c. 5 km N of the central mineralisation (locations in Fig. 1). Grey shading indicates the elevation of leucogabbro layers L0, L1 and L2 of the Triple Group (see Nielsen et al. 2015, 2019a for further information). Modified from Nielsen et al. 2019a. b: Cross-section of the Skaergaard intrusion (core locations in Fig. 1b; for locations of cores not used in this study see Nielsen et al. 2019a) with projected mineralisation intersects (to scale). Elevations of Pd5 (blue) and Pd1 (red) mineralisation levels and leucogabbro layer L3 (yellow) are relative to sea level. The profile only includes data from drill cores Pd5, Pd1 and L3. Mineralisation levels and the lithological layering are concordant across the 7000 m wide and >600 m deep bowl-shaped succession of MZ gabbros. Slightly modified from Nielsen et al. (2019a).
In the most northerly exposures of ML0, concentrations of PGE and Au overlap within 1 m of ML0 gabbro (Turner & Mosher 1989; Andersen et al. 1998). In drill cores from near the margins of the intrusion, PGE is concentrated only in the mineralisation levels Pd5 and Pd6 of ML0, whereas Au is concentrated in Pd4a and b of ML1.1. All mineralisation levels above Pd4a are rich in precious metals in their geographical centres whereas their marginal zones are rich in Cu and poor in PGE and Au. The width of the Cu-rich marginal zone increases up the mineralisation levels. The transition from Au-rich and Cu-poor (<100 ppm) uppermost precious metal mineralisation level to the overlying level rich in Cu (>1000 ppm) climbs stepwise up mineralisation levels and macrorhythmic layers, and close in on the geographical centre of the mineralisation (star in Fig. 1). The distribution of the precious metals can be visualised as a stack of gold-rimmed plates with an upwardly-decreasing diameter (Figs 4b, 5) separated by gabbro that is poor in precious metals and Cu. The stratigraphic separation between the main Pd horizon, Pd5, and the uppermost Au layer Pd1/Au, therefore, increases from <1 m at the margins to >43 m in more central parts of the intrusion.
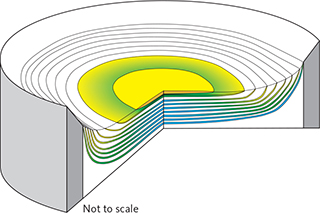
Fig. 5 Visualisation of the 3D structure of the precious metal–rich part of the mineralisation (not to scale). The stack of PGE-rich mineralisation levels with upward-decreasing diameter within the bowl-shaped succession of macrorhythmic layers. Blue shading: PGE-rich; green shading: Au-rich; yellow shading: Au-rich but PGE-poor layers. The maximum concentration of Au is in the uppermost mineralisation level in the central part of the intrusion. Modified from Nielsen et al. (2019a).
2.2 The bowl shape of the Triple Group
Contrary to general perceptions, the macrorhythmic layers, the leucogabbro layers of the Triple Group (L1–L3 plus L0), as well as the mineralisation levels are not planar, nor did they form initially as horizontal layers in the intrusion; they are all bowl-shaped. Wager & Deer (1939) proposed a bowl shape for the LS succession, which was subsequently reconstructed by Nielsen (2004) and Nielsen et al. (2015, 2019a). The bowl shape depicted in Fig. 4b was constructed from the elevation relative to sea level of the tops of L3, Pd5 and Pd1 mineralisation levels projected on to a profile across the intrusion (Nielsen et al. 2019a). Details for this type of reconstruction are found in Nielsen et al. (2015, 2019a) and Holness et al. (2017). The three markers are concordant and maintain near constant separation, confirming that mineralisation levels and the lithological layering are concordant (Nielsen et al. 2015). Instead of a stack of horizontal plates, the spatial distribution of the precious metals is best compared to a stack of gold-rimmed bowls of upward-decreasing diameter (Fig. 5). The distribution of precious metals in five consecutive macrorhythmic layers in the centre of the mineralisation and the concentration of the precious metals in just one macrorhythmic layer near the margins of the intrusion does not reflect telescoping of mineralisation layers. It demonstrates significant differences in the mobility of precious metals and other metals such as Cu in mush melt at the margins and near the geographical centre of the mineralisation (Rudashevsky et al. 2014, 2015; Nielsen et al. 2015, 2019a).
3 Samples and methods
The precious metal mineralogy of the Skaergaard PGE-Au Mineralisation was studied in detail from a total of 30 samples (Table 1). The data presented here were extracted from laboratory reports (Nielsen et al. 2003a–e; Cabri et al. 2005a; Rudashevsky & Rudashevsky 2005a, b, 2006a, b; Rudashevsky et al. 2009a, b, 2010a–d, 2012a–i). Subsequent publications such as Rudashevsky et al. (2014, 2015), Nielsen et al. (2005, 2015, 2019a) and Godel et al. (2014), used data from these reports, and include descriptions of new minerals (Rudashevsky et al. 2004; McDonald et al. 2008 and paragenetic information (Nielsen et al. 2019a).
The studied samples stem from five profiles covering top to base of the precious metal mineralisation and bulk samples collected for metallurgical tests. Samples were collected from drill core 90-23A near the eastern margin, three central profiles from drill cores 90-18, 90-24 and the bulk sampling site referred to as ‘Toe of Forbindelsesgletscher’ (ToF; samples BS0301 and BS0304), and drill core 90-10 from near the western margin (Table 1; locations in Fig. 1). In addition, we include one sample from drill core 90-22 to compensate for a stratigraphic interval in drill core 90-24 lost to basaltic dykes. Drill core 90-22 is collared approx. 350 m SW of drill core 90-24 and is the geochemical mirror image. Samples from ToF and drill cores 90-18, 90-22 and 90-24 are all considered central, based on their geographical positions >1 km in from the margin of the intrusion.
All sample preparation and analytical methods are described in detail in Rudashevsky et al. (2001, 2002, 2014, 2015). Here, we briefly outline the methods used in the preparation and analysis of the samples presented in this study.
One metre sections of drill core (size BQ, 36.5 mm diameter) were cut along their length. The material used in the study represents approx. one third of the circular cross-section of the drill core. The weight of each sample was between 0.5 and 1.3 kg, depending on previous use of drill core material for exploration purposes and recovery tests. Table 1 gives the sample identification data including the drill core number, the 1 m depth interval that was sampled, the weight of the submitted sample, the assay for the sample interval, and the relative proportions of Pd, Pt and Au, as well as the number of precious metal grains recovered.
Samples were carefully crushed and sieved to preserve primary grain sizes and shapes, and subsequently subjected to separation using hydroseparator CNT HS-01, CNT HS-02M and CNT HS-11 (Rudashevsky & Rudashevsky 2006c, 2007). The heavy mineral concentrates of the samples were divided into three grain-size fractions, 125–80 µm, 80–40 µm and <40 µm, and studied under the microscope. The grains were imaged and analysed using a Camscan 4DV scanning electron microscope (SEM) equipped with a Link AN-10000 spectrometer for electron microprobe (EMP) analyses. The methods are described in detail in, for example, Rudashevsky et al. (2018). The size of individual grains is approximated as the area of the circle that encompasses the grain (i.e. the equivalent circle diameter, ECD). Elemental concentrations are given as wt%, ppm or ppb. Sample numbers and scales are embedded in individual backscattered electron images (BSE; i.e. in Figs 6–9, 15–20 and 23–32). Individual grains of rock-forming minerals, sulphides and precious metal phases are identified by the unique number of the drill core from which concentrates were made, the start depth of the selected 1 m interval, the grain-size fraction and the number (#) of the individual grain. For example, 23A-806, 45/2 #2 is the unique identification of grain #2 in mount 45/2 from the interval 806 to 807 m in drill core 90-23A. A total of >4000 grains were studied.
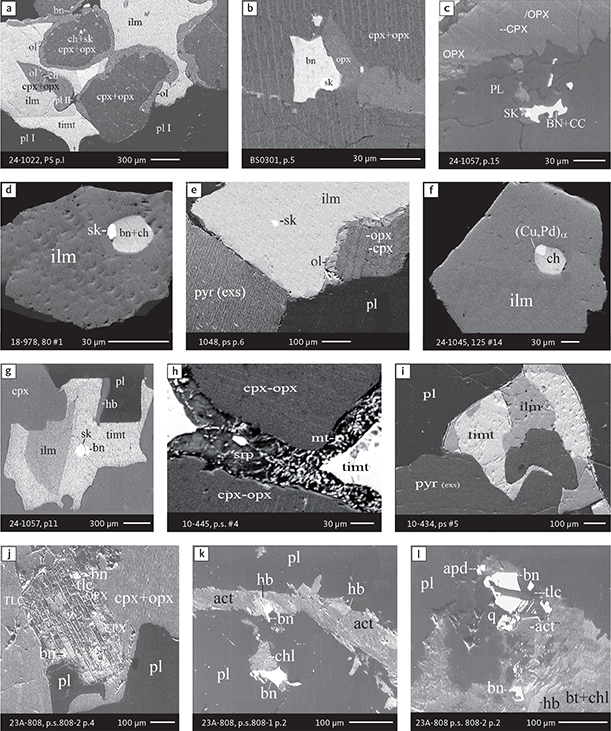
Fig. 6 Backscattered electron (BSE) images of the petrographic relations between rock-forming silicates, oxides, sulphides and PGE phases in polished thin sections (panels a–c, e, g–l) and polished monolayer thin sections of HS concentrates (panels d, f). a–g: samples from the central part of the intrusion (drill cores 90-18, 90-24 and ToF). h–l: samples from more marginal parts of the intrusion (drill cores 90-10 and 90-23A). Abbreviated names of minerals, compounds and alloys are as follows: bn and BN: bornite. ch and cc: chalcocite. cpx and CPX: clinopyroxene. opx and OPX: orthopyroxene. Pyr (exs): сpx-opx exsolution. pl and PL: plagioclase (includes pl I with An38–42; and pl II with An82). timt: titaniferous magnetite. ilm: ilmenite. ol: olivine. mt: magnetite. hb: hornblende. act: actinolite. bt: biotite. q: quartz. srp: serpentine. Tlc and TLC: talc. chl: chlorite. Sk and SK: skaergaardite. (Cu,Pd)α: Pd-Cu alloy. apd: arsenopalladinite. Grain numbers and scales included in the images. Table 3 provides standard formulae for the precious metal minerals. Formulae for common rock-forming minerals and base metal sulphides are found in Appendix 1.
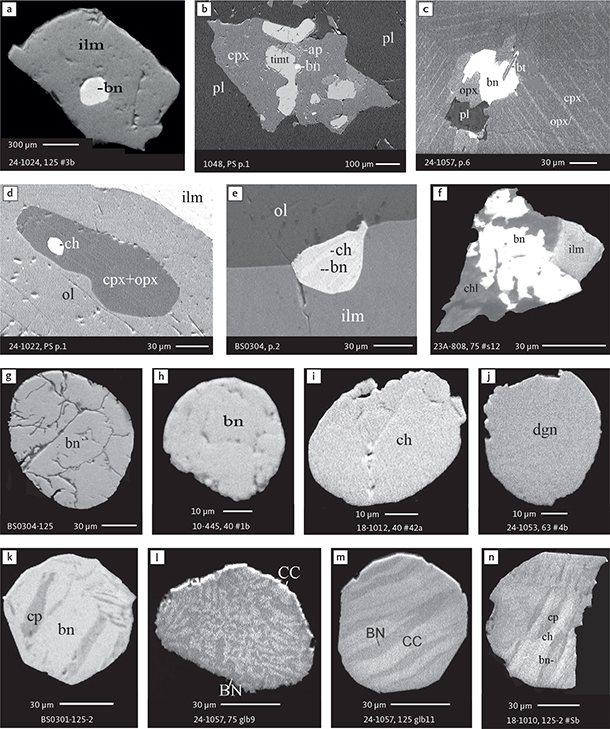
Fig. 7 BSE images of sulphides. Panels a–e are polished thin sections of gabbroic host. Panels f–n are polished monolayer thin sections of heavy mineral HS concentrates. Images include samples from the central part of the intrusion (a–e, g–n), and one sample from the marginal part of the intrusion (f). Note exsolution textures in panels k–n. Abbreviated names of minerals, compounds and alloys are as follows: bn and BN: bornite. ch and CC: chalcocite. cp: chalcopyrite. dgn: digenite. cpx: clinopyroxene. opx: orthopyroxene. pl: plagioclase. ol: olivine. timt: titaniferous magnetite. ilm: ilmenite. ap: apatite. bt: biotite. chl: chlorite. Grain numbers and scales included in the images. Table 3 provides formulae for the precious metal minerals. Formulae for common rock-forming minerals and base metal sulphides are found in Appendix 1.
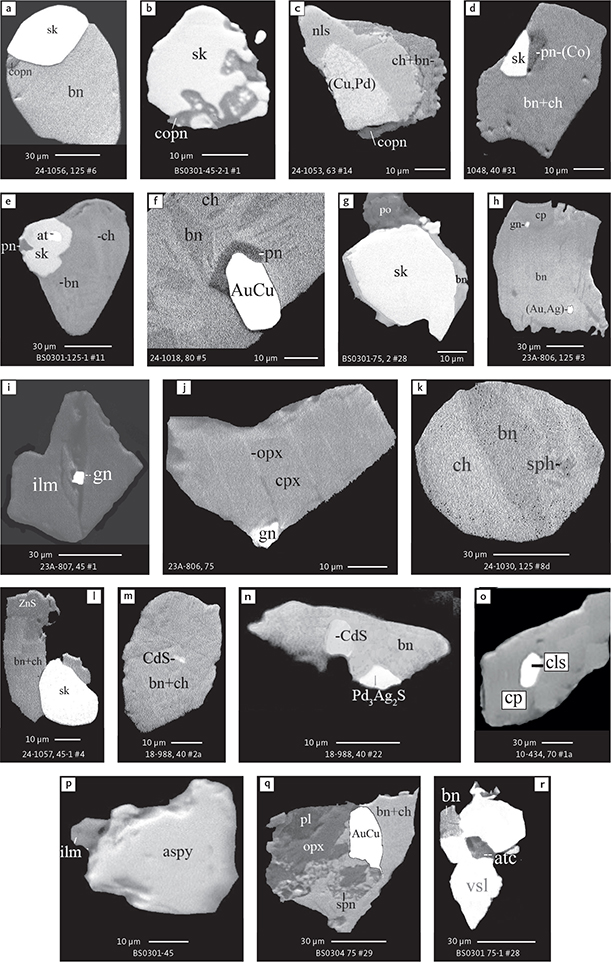
Fig. 8 BSE images of rare minerals in polished monolayer thin sections. Table 3 provides formulae for the precious metal minerals. Formulae for common rock-forming minerals and base metal sulphides are found in Appendix 1. Formulae are given here for rare minerals that are not listed in Table 3 or Appendix 1. Abbreviated names of minerals, compounds and alloys are as follows: copn and pn-(Co): cobaltian pentlandite (panels a–d). pn: pentlandite (panels e–f). po: hexagonal pyrrhotite (panel g). gn: galena (panels h–j). sph: sphalerite (panel k). ZnS: sphalerite (panel l). CdS: greenockite/hawleyite (panels m, n). cls: clausthalite (PbSe) (panel o). aspy: arsenopyrite (panel p). spn: thiospinel group, carrollite (Cu(Co,Fe,Ni)2S4) (panel q). atc: atacamite (Cu2Cl(OH)3) (panel r). sk: skaergaardite (panels a, b, e, g, l). (Cu,Pd): Cu-Pd alloy (panel c). nls: nielsenite (PdCu3) (panel c). at: atokite (Pd3Sn) (panel e). AuCu: tetra-auricupride (panels f, q). (Au,Ag): native gold (panel h). Pd3Ag2S: coldwellite (panel n). vsl: vasilite ((Pd,Cu)16S7) (panel r). bn: bornite. ch: chalcocite. cp: chalcopyrite (panels h, o). cpx: clinopyroxene (panel j). opx: orthopyroxene (panels j, q). pl: plagioclase (panel q). ilm: ilmenite (panels i, p). sk: skaergaardite (panel l). Grain numbers and scales included in the images.
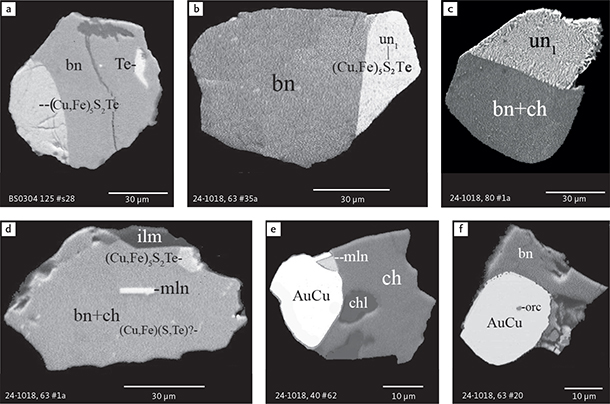
Fig. 9 BSE images of sulphides from the Au-rich Pd1/Au horizon in the central part of the intrusion. Polished monolayer thin sections of the heavy mineral HS concentrates. Table 3 provides formulae for the precious metal minerals. Formulae for common rock-forming minerals and base metal sulphides are found in Appendix 1. Formulae are given here for rare minerals that are not listed in Table 3 and Appendix 1. Abbreviated names of minerals, compounds and alloys are as follows: bn: bornite. ch: chalcocite. mln: melonite ((Ni,Pd)Te2). Te: native tellurium. orc: orcelite (Ni5-xAs2). un1: unnamed compound (Cu,Fe)3TeS2. ilm: ilmenite. chl: chlorite. Grain numbers and scales included in the images.
In addition, the petrographic relations of alloys and minerals dominated by Cu and Pd to hosts and sulphide minerals were imaged in situ by Godel et al. (2014) using High Resolution X-ray Computed Tomography (HRXCT) on small, drilled cores samples (8 and 4 mm in diameter). Samples were collected from the PGE-rich lower mineralisation level (Pd5) from ToF and the upper Au-rich mineralisation level (Pd4) near the margin on Kraemer Ø. This latter sample is equivalent to the Au-rich samples 10-434 and 23A-798 included in the present study.
See Appendix 1 for a list of the names and formulae of the common rock-forming minerals, rare accessory phases and common base metal sulphides in the studied samples. The precious metals mentioned in the text and their standard formulae are listed in Table 3.
4 Mineralogy, composition and petrographic relationships
4.1 The gabbroic host
The petrography, mineral chemistry and bulk geochemistry of the gabbros of the Skaergaard intrusion are described in numerous papers and monographs (e.g. Wager & Brown 1968; McBirney 1996). In the Triple Group and in the mineralisation levels, the liquidus phases show limited compositional variation with cores of plagioclase crystal (~An46) and clinopyroxene (Mg# ≈ 58). The mineralised gabbros, however, show wider compositional ranges in cores of plagioclase grains (An40–52), exsolved clinopyroxene (Mg# = 59–65) and orthopyroxene (Mg# = 43–56).
The gabbros of the Skaergaard PGE-Au Mineralisation are complex rocks that include two main silicates and FeTi oxide parageneses (Nielsen et al. 2015). A liquidus paragenesis of plagioclase-pyroxene and FeTi oxides, an interstitial paragenesis of plagioclase-pyroxene-olivine-FeTi oxides and apatite related to the sulphide and precious metal mineralisation, and a late paragenesis with hydrous minerals formed in reaction with fluids (see Section 5.4). In the inner parts of the intrusion, the host gabbros contain irregular aggregates of FeTi oxides that are separated from earlier resorbed plagioclase and pyroxenes by zones of fayalitic olivine (Mg# = 40–56) and Ca-rich plagioclase II (up to An89; Fig. 6a–g). Following Nielsen et al. (2015), the olivine-rich rims are developed at the interface between the first-formed liquidus paragenesis and a later interstitial parageneses dominated by FeTi oxides (Fig. 6a–g). This reaction relationship is not seen close to the margin of the intrusion. Here, the space between cumulus phases is commonly filled by aggregates of, for example, serpentine and magnetite (Fig. 6h), and no reaction is seen at contacts between FeTi oxides and clinopyroxene (Fig. 6i).
In samples from drill core 90-23A near the eastern margin, the primary minerals of the gabbros are variably followed by hydrous silicates such as biotite, hornblende, actinolite, chlorite, ferrosaponite, ferrous talc, serpentine, quartz, magnetite and calcite (Fig. 6j–l). These late- to post-magmatic minerals sometimes form veins in pristine host gabbros (Fig. 6k). Apatite, baddeleyite, zircon, thorianite, monazite and uraninite are examples of accessory minerals identified by EMP analysis in the polished thin sections of the studied bulk-rock samples as well as in polished monolayer samples and mounts prepared from concentrates obtained by hydro-separation (HS) concentrates (see Methods, Chapter 3).
4.2 The ore minerals
4.2.1 The sulphides
The gabbros enriched in precious metals always have small proportions of Cu-Fe sulphides, c. 0.5 vol.% and the bulk-rock samples mostly have <80 ppm Cu (Nielsen et al. 2015). Bornite is the dominant sulphide, followed by chalcocite digenite and chalcopyrite. The grain size is rarely more than a few tenths of µm and rarely exceeds 0.1 mm. Details of the petrography, parageneses and compositions of the sulphides in the samples studied here are found in Nielsen et al. (2003a–e), Rudashevsky et al. (2004, 2009a, b, 2010a–d, 2012a–i, 2014, 2015), Cabri et al. (2005a), Rudashevsky & Rudashevsky (2005a, b, 2006a, b) and McDonald et al. (2008).
The shapes and habits of sulphide grains include three general types as follows:
type 1: irregularly shaped aggregates from the interstices between rock-forming minerals (e.g. Figs 6b, c, 7c)
type 2: sphere-shaped grains with a sphericity up to 0.95 and droplet-like micro-globules (Figs 6d, f, 7a, b, d, e, g–n)
type 3: aggregates of small flaky grains in association with late- to post-magmatic minerals.
Most common are type 1 sulphides grains, located between the rock-forming minerals of the gabbroic host (Figs 6b, c, 7c). The droplet-like inclusions (type 2) are comparatively rare but occur throughout the mineralisation in ilmenite (Figs 6d, f, 7a), titaniferous magnetite (Figs 6g, 7b), pyroxene grains (Figs 6a, 7d) and plagioclase and olivine (Figs 6c, 7e). Type 3 sulphide grains are limited to samples from near the margins of the intrusion in drill cores 90-10 and 90-23A, where the sulphides often occur in intergrowths with late-magmatic hydrous silicates (Figs 6j–l, 7f). The sulphide grains can be monomineralic and composed of bornite chalcocite, digenite or chalcopyrite (Fig. 7g–j) or be composed of two or three different sulphides in variable volumetric proportions. Polymineralic Cu-Fe sulphide grains typically exhibit exsolution textures, for example, of intermediate solid solution (iss; Fig. 7k–n).
The Cu-Fe sulphide paragenesis varies from centre to margin of the intrusion. Samples from the central parts of the intrusion (ToF and drill cores 90-18, 90-22 and 90-24; Fig. 1) have comparably S-poor paragenesis, with chalcocite and digenite and intergrowths of bornite and chalcocite. The S-poor paragenesis is suggested to have exsolved from a parental phase with a composition close to digenite (e.g. Andersen 2006). Samples from near the margins of the intrusion (drill cores 90-23A and 90-10) have a more S-rich sulphide association dominated by bornite grains and aggregates of bornite and chalcopyrite (Nielsen et al. 2003a, d, e; Rudashevsky et al. 2012c–e). Digenite is also present, but only in subordinate amounts.
In addition to the dominant Cu-Fe sulphides, polished thin sections and heavy mineral HS concentrates reveal a suite of rare sulphides (Table 2). They form small inclusions, 1–20 µm in size, in Cu-Fe sulphide grains, in rock-forming minerals and inside grains of precious metal minerals. These sulphides include cobaltian pentlandite (Co,Ni,Fe)9S8, pentlandite (Ni,Fe,Co)9S8, galena (PbS), hexagonal pyrrhotite (Fe7S8), sphalerite (Zn,Fe)S, greenockite/hawleyite (CdS), in addition to phases such as clausthalite (PbSe; Fig. 8) and carrollite (Cu(Co,Fe,Ni)2S4). We note that the petrographic relations suggest that cobaltian pentlandite with up to 7.8 wt% rhodium (Rh) and 5.5 wt% Pd, formed contemporaneously with the PGE minerals (Table 2, rows 2 and 3).
| Row no. | Mineral | Formula | No. of grains | Total area (∑, μm2) | No of samples d | ECD (μm) f | |||
| Total area (%) e | Min. | Ave. | Max. | ||||||
| Intermetallic compounds and alloys dominated by Pd and Cu | |||||||||
| 1 | Skaergaardite a | PdCu | 2054 | 1124677 | 24 | 57 | 1 | 23 | 93 |
| 2 | Nielsenite b | PdCu3 | 73 | 21081 | 11 | 1.07 | 2 | 15 | 50 |
| 3 | (Pd,Cu) Alloy | (Pd,Cu,Au) | 13 | 1644 | 6 | 0.08 | 3 | 8 | 20 |
| 4 | (Cu,Pd)β | (Cu,Pd,Au,Pt) | 135 | 36891 | 5 | 1.87 | 1 | 19 | 51 |
| 5 | (Cu,Pd)α | (Cu,Pd) | 65 | 22600 | 2 | 0.87 | 2 | 16 | 36 |
| 6 | Alloy (Cu,Pt) | (Cu,Pt) | 2 | 125 | 1 | 0.01 | 2 | 7 | 11 |
| 7 | Native Pd | Pd | 2 | 936 | 2 | 0.05 | 20 | 29 | 29 |
| Intermetallic compounds and alloys dominated by Au, Ag and Cu | |||||||||
| 8 | Tetra-auricupride | AuCu | 1006 | 378984 | 20 | 19.2 | 2 | 19 | 57 |
| 9 | Auricupride | Cu3Au | 27 | 5953 | 4 | 0.30 | 3 | 16 | 31 |
| 10 | Unnamed | Au3Cu | 64 | 14885 | 17 | 0.75 | 2 | 14 | 35 |
| 11 | Alloy | (Au,Cu,Pd) | 156 | 56815 | 17 | 2.88 | 2 | 17 | 54 |
| 12 | Alloy | (Cu,Au) | 25 | 11256 | 5 | 0.57 | 7 | 15 | 41 |
| 13 | Alloy | (Au,Cu,Ag,Pd) | 284 | 114772 | 8 | 5.81 | 4 | 15 | 46 |
| 14 | Alloy | (Au,Cu,Fe,Pd) | 2 | 912 | 1 | 0.05 | 11 | 21 | 31 |
| 15 | Alloy | (Cu,Au,Ni,Zn) | 1 | 620 | 1 | 0.03 | - | 28 | - |
| 16 | Native Au c | (Au,Ag) | 15 | 3958 | 7 | 0.20 | 1 | 11 | 40 |
| 17 | Alloy | (Ag,Cu) | 6 | 4964 | 3 | 0.25 | 14 | 29 | 58 |
| 18 | Native Ag | (Ag,Au) | 9 | 2456 | 6 | 0.12 | 5 | 16 | 38 |
| Intermetallic compounds and alloys with Pt | |||||||||
| 19 | Alloy | (Pt,Cu,Fe,Pd) | 21 | 634 | 7 | 0.03 | 1 | 5 | 14 |
| 20 | Alloy | (Pt,Fe,Cu,Pd) | 18 | 680 | 9 | 0.03 | 1 | 6 | 11 |
| 21 | Alloy | (Pt,Cr) | 1 | 2345 | 1 | 0.12 | - | 55 | - |
| Sulphides with precious metals | |||||||||
| 22 | Vasilite c | (Pd,Cu)16S7 | 119 | 32281 | 21 | 1.64 | 1 | 19 | 58 |
| 23 | Vysotskite | (Pd,Ni,Cu)S | 148 | 32708 | 14 | 1.66 | 1 | 18 | 45 |
| 24 | Unnamed | (Сu,Pd)2S | 5 | 253 | 1 | 0.01 | 2 | 7 | 12 |
| 25 | Unnamed | (Pd,Cu,Pt)3S2 | 12 | 3495 | 4 | 0.18 | 2 | 14 | 33 |
| 26 | Coldwellite | Pd3Ag2S | 7 | 429 | 4 | 0.02 | 4 | 8 | 20 |
| 27 | Unnamed | Pd3(Ag,Cd,Cu,Tl)S | 1 | 80 | 1 | 0 | - | 10 | - |
| 28 | Unnamed | (Pd,Hg,Ag)2S | 1 | 54 | 1 | 0 | - | 6 | - |
| 29 | Argentite/acanthite | Ag2S | 1 | 1786 | 1 | 0.09 | - | 48 | - |
| 30 | Stephanite | Ag5SbS4 | 1 | 3710 | 1 | 0.19 | - | 69 | - |
| 31 | Polybasite | (Ag,Cu)16Sb2S11 | 1 | 605 | 1 | 0.03 | - | 28 | - |
| 32 | Unnamed | Pd3Cu6(Te,Sn)2S3 | 1 | 48 | 1 | 0 | - | 8 | - |
| Arsenides with precious metals | |||||||||
| 33 | Vincentite | Pd3As | 92 | 18161 | 8 | 0.92 | 1 | 13 | 59 |
| 34 | Arsenopalladinite/ | Pd8As3 | 90 | 19921 | 6 | 1.01 | 3 | 16 | 61 |
| Stillwaterite c | |||||||||
| 35 | Palladoarsenide | Pd2As | 7 | 1101 | 3 | 0.06 | 4 | 14 | 25 |
| 36 | Isomertieite | Pd11As2Sb2 | 7 | 399 | 3 | 0.02 | 1 | 8 | 20 |
| 37 | Sperrylite | PtAs2 | 53 | 1420 | 7 | 0.07 | 1 | 6 | 69 |
| 38 | Majakite | PdNiAs | 2 | 18 | 1 | 0 | 3 | 4 | 4 |
| Stannides and tellurides with precious metals | |||||||||
| 39 | Unnamed | Pd11As2Sn2 | 1 | 100 | 1 | 0.01 | - | 11 | - |
| 40 | Keithconnite c | Pd3-x(Te,Pb,Sn) | 160 | 9319 | 25 | 0.47 | 1 | 9 | 25 |
| 41 | Kotulskite | PdTe | 29 | 1301 | 7 | 0.07 | 2 | 7 | 13 |
| 42 | Merenskyite | PdTe2 | 1 | 85 | 1 | 0 | - | 10 | - |
| 43 | Unnamed | Pd2Te | 2 | 310 | 1 | 0.02 | 12 | 15 | 18 |
| 44 | Sopcheite | Ag4Pd3Te4 | 1 | 48 | 1 | 0 | - | 8 | - |
| 45 | Telargpalite | (Pd,Ag)3(Te,Pb) | 1 | 45 | 1 | 0 | - | 8 | - |
| 46 | Hessite | Ag2Te | 1 | 74 | 1 | 0 | - | 10 | - |
| 47 | Unnamed | (Pd,Ag)2Te | 4 | 66 | 1 | 0 | 3 | 5 | 7 |
| 48 | Unnamed | Pd2CuTeBi | 1 | 49 | 1 | 0 | - | 8 | - |
| 49 | Zvyagintsevite c | Pd3(Pb,Te,Sn) | 279 | 30837 | 22 | 1.56 | 1 | 13 | 69 |
| 50 | Atokite c | Pd3(Sn,Te,Pb) | 68 | 4218 | 12 | 0.21 | 1 | 8 | 24 |
| 51 | Cabriite | Pd2CuSn | 7 | 188 | 3 | 0.01 | 4 | 6 | 21 |
| 52 | Alloys | (Pd,Cu,Sn,Te,Pb) | 44 | 3581 | 14 | 0.18 | 1 | 7 | 23 |
| 53 | Naldrettite | Pd2(Sb,Sn) | 1 | 10 | 1 | 0 | - | 10 | - |
| Bismuth and Pd minerals | |||||||||
| 54 | Froodite | PdBi2 | 1 | 180 | 1 | 0.01 | - | 18 | - |
| Total | 5129 | 1974138 | 100 | ||||||
| a Accepted by IMA (Rudashevsky et al. 2004). b Accepted by IMA (MacDonald et al. 2008). c Minerals recorded prior to use of hydroseparation techniques (Nielsen et al. 2005). d Number of samples in which the mineral was identified. e Area of phase compared to the total area of precious metal mineral grains in each sample. f Average equivalent circle diameter (ECD) of precious metal mineral grains. - indicates no data. | |||||||||
The sulphide parageneses of the uppermost Au-rich mineralisation in a given drill core is very different, irrespective of the stratigraphic position in the stack of macrorhythmic layers and mineralisation levels. The sulphide parageneses of Au-rich samples are rich in tellurium (Te) with inclusions of melonite (Ni,Pd)Te2, native Te and orcelite (Ni5-xAs2), which is found as inclusions in tetra-auricupride (AuCu; Fig. 9f; Table 2, row 11), as well as unnamed sulpho-tellurides of Cu and Fe. The sulpho-tellurides have stoichiometric compositions and several grains are observed. Three types of sulpho-tellurides have the empirical formulae: (Cu,Fe)5TeS2, (Cu,Fe)3TeS2 and (Cu,Fe)6TeS2 (Fig. 9a–e; Table 2, rows 7–10), and are believed to represent unnamed minerals. We believe the grain textures show that such sulpho-tellurides formed by re-equilibration and exsolution (Fig. 9c) from an unknown metastable, higher-T magmatic phase.
Concentrations of chalcophile elements such as Pd, Au, Ag, Te and Se are recorded in the Cu-Fe sulphide blebs from Pd5 and Pd4–Pd2 mineralisation levels in drill core 10-48 (Holwell et al. 2015). Elements such as Te (50–100 ppm) and Se (300–500 ppm) only show minor variations, whereas elements such as Pd, Au and Pt vary by several orders of magnitude. Variations in ratios between the precious metals and Cu can, however, be due to several processes, and conclusions are difficult to reach.
Based on petrographic observations and bulk-rock compositions, Nielsen et al. (2015) argued for syn-magmatic dissolution of primary immiscible sulphide droplets leading to enrichment in mainly Pd and subsequently to late Au-enrichment caused by mobility and migration of Au in mush melts and fluids. Some textures are apparently the result of immiscibility between Cu-S melts and Pd-rich melts (Nielsen et al. 2015) and could account for melt droplets composed of >50 vol.% skaergaardite (PdCu) and with an extreme concentration of Pd. Some sulphide droplets host large crystals of Pd minerals. Others show necking, which is understood to be the separation between precious metal crystals and sulphide melt due to crystallisation of neighbouring phases or gravitational and due to the difference in density between the precious metal grains and the related sulphide melt. Such sulphide melts would be depleted in precious metals.
Some sulphide blebs, however, have extremely high contents of precious metals (e.g. Holwell et al. 2015). They may be caused by tiny particles of precious metal mineral below the surface of the studied grains and would lead to strongly elevated and non-representative precious metal concentrations in the sulphide hosts. Holwell et al. (2015) also reported especially high concentrations of Se in sulphide blebs from the upper Au-rich mineralisation level Pd1/Au in the centre of the intrusion and in agreement with bulk-rock enrichment in Se reported by Keays & Tegner (2016).
4.2.2 Precious metal minerals
Only nine precious metal phases were identified and named in the Skaergaard PGE-Au Mineralisation prior to our use of hydrosepation to produce heavy mineral concentrates. Andersen et al. (1998) found (Cu,Fe)(Au,Pd,Pt) alloy with variable Au/PGE ratios to be the totally dominant precious metal phase together with small amounts of electrum (Au,Ag), atokite (Pd3Sn), zvyagintsevite (Pd3Pb), vasilite ((Pd,Cu)16S7), keithconnite (Pd3+x(Te,As)), melonite ((Ni,Pd,Cu,Fe)(Te,Sb)2), arsenopalladinite (Pd8(As,Sb,Sn)3) and unnamed (Pd,Cu)2S (Bird et al. 1991).
Table 3 lists the precious metal minerals identified in the 30 samples, together with information on grain sizes (ECD) and the calculated relative abundances. The phases are subdivided into the following groups or associations:
- Intermetallic compounds (commonly stoichiometric) and alloys dominated by Pd and Cu with minor substitutions of Pt, Fe, Cu and Cr. The group represents 61.3% of the entire paragenesis (Table 3, rows 1–7, 19–21)
- Intermetallic compounds and alloys of Au, Ag and Cu representing 30.1% of the parageneses (Table 3, rows 8–18)
- Sulphides of Pd and Cu with substitutions of Ag, Cd, Hg and Tl, representing 3.8% of the paragenesis (Table 3, rows 22–34)
- Arsenides of Pd with Pt and Ni substitutions representing 2.1% (Table 3, rows 35–38)
- Stannides and tellurides with precious metals including intermetallic compounds of Pd and Cu with Sn, Pb, Te, (Sb, Bi) representing 2.7% (Table 3, rows 39–54, including froodite (PdBi2)).
All the original data can be found in Nielsen et al. (2003a–e), Rudashevsky & Rudashevsky (2005a, b, 2006a, b), Rudashevsky et al. (2009a, b, 2010a–d, 2012a–i, 2014, 2015) and Cabri et al. (2005a). In total, 54 different compositions are now reported, three of which were approved as new minerals by the International Mineralogical Association (IMA). They include skaergaardite (PdCu; Rudashevsky et al. 2004), nielsenite (PdCu3; McDonald et al. 2008) and naldrettite (Pd2Sb; Cabri et al. 2005b, Rudashevsky & Rudashevsky 2006b).
The dominant Pd-mineral skaergaardite has the simplified formula PdCu, but is better described as (Pd,Au,Pt)(Cu,Fe,Zn,Sb,Sn,Pb,Te) and the dominant Au-mineral tetra-auricupride (AuCu). The formula for the prevalent (Cu, Fe)(Au,Pd,Pt) alloy of Andersen et al. (1998) covers both of these phases. All other minerals are of minor importance and include zvyagintsevite (Pd3Pb; 5%), keithconnite (Pd3-xTe; 3%), vasilite (Pd16S7; 2%), arsenopalladinite (Pd8(As,Sb)3; 2%) and native gold (0.3%; Table 3). These are averages for the entire mineralisation and are not representative of any given sample.
The very large number of individual grains in the study (Tables 1, 3) ensures statistically robust information for the approximate volumetric proportions of the precious metals throughout the intrusion, the morphology of individual grains, the paragenetic relations and the compositional variations. All of these are used for the reconstruction of primary parageneses (Nielsen et al. 2019a). Here, we summarise the mineralogical data and focus on the genesis of the main levels of the mineralisation, including the lower PGE-rich level across the intrusion, and the upper Au-rich mineralisation level as recorded in bulk sample BS0304 and drill cores 90-18 and 90-24 near the geographic centre of the mineralisation, 90-23A from the eastern margin and 90-10 from the western margin of the intrusion (Fig. 10).
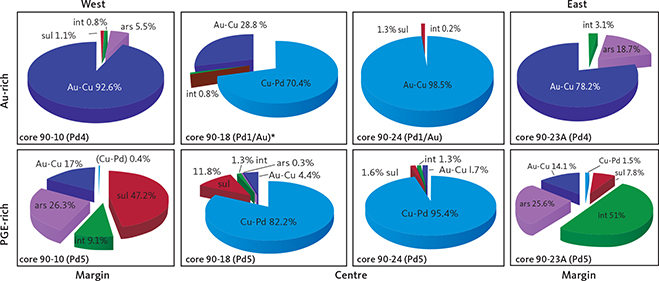
Fig. 10 Contrasts between precious metal parageneses across the intrusion in the upper Au-rich mineralisation and the lower PGE-rich mineralisation level (Pd5). The data are summarised for drill cores 90-10 near the western margin, 90-18 from the SW centre, 90-24 from the centre, and 90-23A near the eastern margin (drill core locations in Fig. 1; original data in electronic appendix 12 of Nielsen et al. 2019a). The lower PGE-rich levels are perfectly concordant with variations in Pd/Pt ratios up the layered gabbros despite the stark contrasts in parageneses. The Au-rich mineralisation levels are found increasingly higher in the succession of gabbro layers towards the centre of the intrusion (see also Fig. 4). The Au-rich mineralisation levels are Pd1/Au in core 90-24, Pd1/Au* and in Au+1 in 90-18 and Pd4a in cores 90-10 and 90-23A. Total areas of precious metals are recalculated to 100% and used as approximations to volume relations. Cu-Pd: minerals, intermetallic compounds and alloys of Cu and Pd that may be substituted by Pt, Fe, Cu and/or Cr; Au-Cu: minerals, intermetallic compounds and alloys of Au and Cu (Ag); sul: sulphides of Pd, Cu (Ag, Cd, Hg, Tl); ars: arsenides of Pd (Pt, Ni); int: intermetallic compounds of Pd, Cu, Sn, Pb, Te (Со, Sb, Bi).
Figure 10 illustrates the relative proportions of phases in the main Pd mineralisation level (Pd5) and the Au-rich upper mineralisation levels. The data shown are averages based on all the samples up though Pd5 and the sections through the Au-rich level in a given drill core. The full data set is found in appendix 6 of Nielsen et al. (2019a). Skaergaardite (PdCu) is the dominant Pd-Cu precious metal mineral of the main PGE mineralisation level (Pd5) in drill core 90-24 from near the geographic centre of the mineralisation (Fig. 10). Au-bearing phases do not exceed 2 vol.%.
South-west of the centre, in drill core 90-18, Pd5 has an elevated proportion of precious metal sulphides and arsenides (Fig. 10). But near the margins on either side of the intrusions the Pd-Cu phases are almost absent (<2%; “Cu-Pd” in Fig. 10), despite comparatively high PGE concentrations and an up to 8 m thick Pd5 at a cut off of 0.7 ppm (Watts, Griffis & McOuat Ltd. 1991).
At the western margin in drill core 90-10, Pd5 is dominated by 47.2% palladium sulphides followed by 26.3% arsenides and 9.1% intermetallic compounds of Pb, Sn, Te and summing to 82.6%. The remaining c. 17% of the paragenesis is composed of Au-bearing minerals (Fig. 10). In stark contrast, Pd5 at the eastern margin (drill core 90-23A) is dominated by intermetallic compounds of Pb, Sn and Te (51%) including zvyagintsevite (Pd3Pb), atokite (Pd3Sn), keithconnite (Pd3-xTe), and arsenides (25.6%; Fig. 10) including arsenopalladinite (Pd8As3), vincentite ((Pd,Pt)3(As,Sb,Te); in early reports referred to as guanglinite), palladoarsenide (Pd2As), and sulphides (7.8%; Fig. 10), including vasilite (Pd16S7) and vysotskite (PdS); total 84.4%. Au-bearing phases and Cu-Pd account for c. 15% of the precious metal paragenesis (Fig. 10).
In the central drill core 90-24, the Au-rich precious metal paragenesis of the Pd1 and Pd1/Au mineralisation levels is totally dominated by Au-Cu minerals and phases mainly in the form of tetra-auricupride (AuCu). The Pd1–Pd1/Au interval in drill core 90-24 is 2 m thick at a cutoff at 1 ppm Au and has average Au 4.2 ppm (data in Watts, Griffis & McOuat Ltd. 1991).
The Pd1–P1/Au interval in drill core 90-18 is dominated by Pd-Cu phases including skaergaardite (PdCu). The Pd1/Au mineralization level has only 28.8 % Au-Cu phases compared to >90% in nearby drill core 90-24 (Fig. 10). Most gold is in drill core 90-18 concentrated 14 m above Pd1 in the Au+1 mineralisation level (Nielsen et al. 2015, 2019a) where the Au phases constitute 94 vol.% of the precious metal paragenesis. Immediately above Au+1 follows mineralisation levels that are strongly elevated in Cu (>1000 ppm) and very poor in precious metals (Nielsen et al. 2015, 2019a).
At the margins in drill cores 90-10 and 90-23A, the Au-rich Pd4a mineralisation level is located 10 m above Pd5 (Fig. 10). At a cut-off of 0.7 ppm, the assays for the Pd4a level show 2.4 ppm Au over a width of 0.8 m in drill core 90-10 and 0.6 m in drill core 90-23A.
4.2.3 Intermetallic compounds and alloys of Cu and Pd
Intermetallic compounds and alloys of Cu and Pd are the main precious metal minerals in the Skaergaard PGE-Au Mineralisation. They range from native palladium to Cu-Pd alloys with variable proportions or trace amounts of other elements (Rudashevsky et al. 2015). They include the intermetallic compounds skaergaardite (PdCu; Rudashevsky et al. 2004) and nielsenite (PdCu3; McDonald et al. 2008).
Traditional studies of polished thin sections of gabbro from Pd5 revealed only a few skaergaardite grains (Fig. 6a–e, g). Whereas heavy mineral HS concentrates of the same samples have provided information on composition, shape and paragenesis of more than 2340 grains of Cu-Pd compounds and alloys from 26 of the 30 studied samples (Table 3). The compositional range in the intermetallic compounds of Cu and PGE in all samples and mineralisation levels is shown in Fig. 11. The subdivision of the suite of minerals and phases is based on the atomic proportion (at.%), calculated as the % of (Pd+Pt+Au) in Cu + (Pd+Pt+Au). The average compositions of the identified phases in the suite from Cu to Pd are listed in Table 4. The suite (Fig. 11) divides into: (1) Cu-rich alloy (Cu,Pd)α, 3–20 at.% (Pd+Pt+Au); (2) nielsenite (PdCu3), 20–30 at.%; (3) (Cu,Pd)β alloy, 35–45 at.%; (4) skaergaardite (PdCu), 45–55 at.%; (5) solid solution of (Pd,Au,Cu) alloys, 70–75 at.%; (6) solid solution of (Pd,Cu,Au,Pt) alloys, 80–90 at.%; (7) native Pd, c. 100 at.%.
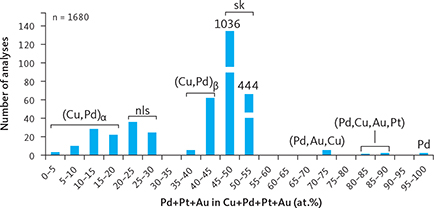
Fig. 11 Intermetallic compounds and alloys ranging from Cu to Pd. Based on EMP analyses of a total of 1680 grains. Minerals, compounds and alloys are identified on the basis of precious metal to Cu ratio expressed as (Pd+Au+Pt) in at.%. From left to right: (Cu,Pd)α alloy: 3–20 at.%; nls: nielsenite (PdCu3), 20–30 at.%; (Cu,Pd)β alloy: 35–45 at.%; sk: skaergaardite (PdCu), 45–55 at.%; (Pd,Au,Cu) solid solution: 70–75 at.%; (Pd,Cu,Au,Pt) solid solution: 80–90 at.%; Pd: native Pd, c. 100 at.%. Note that bars for “sk” are shortened to fit the diagram.
In total, these intermetallic compounds and Cu and Pd alloys account for 61% of the total area of all the examined precious metal mineral grains from the Skaergaard PGE-Au Mineralisation (Table 3). Skaergaardite (PdCu) dominates (57%), followed by nielsenite (Cu3Pd; 1%) and non-stoichiometric alloys of Cu and Pd (0.3–1.9%), and rare grains of (Pd,Cu,Au,Pt) alloy and native palladium.
The paired correlation coefficients calculated from all available analyses of skaergaardite (PdCu; Table 5) show that Pd is substituted by Au and Pt, and that Cu is substituted by a wide range of elements including Fe, Sb, Sn, Te and Pb. The maximum substitutions of these elements in skaergaardite and nielsenite are listed in Tables 4 and 6. These observations can be compared to a factor analysis of 311 skaergaardite grains identified in HS heavy mineral concentrates of sample 24-1057, covering the PGE peak of level Pd5 (Fig. 12; Rudashevsky et al. 2004). This analysis divides the skaergaardite compositions into four groups characterised by the following elements: Factor 1: Pd, Fe and Zn; Factor 2: Cu, Au and Te; Factor 3: Sn and Pb; and Factor 4: Pt. The range in elemental substitutions in 1482 skaergaardite grains from all studied drill core samples is visualised in Fig. 13.

Fig. 12 Factor analysis on the skaergaardite (PdCu) composition from sample 90-24-1057 in level Pd5. A total of 311 analyses are included in the modelling. a: F1 (factor 1) versus F2 (factor 2). b: F1 (factor 1) versus F3 (factor 3). c: 3D diagram of all three factors. The compositions indicated by the stippled lines include group I: (Pd-Fe-Zn); group II: (Cu-Au-Te); group III: (Pb-Sn); group IV: Pt-rich skaergaardite. Modified from Rudashevsky et al. (2004).
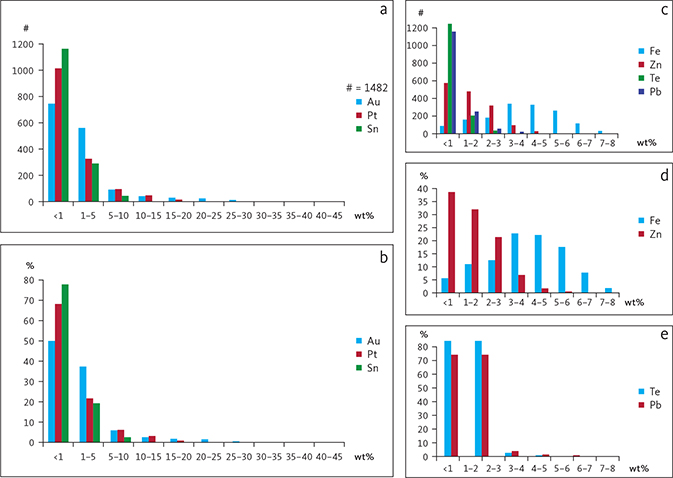
Fig. 13 Histograms illustrating frequency of substitutions in skaergaardite based on a total of 1482 EMP analyses. a: Au, Pt, Sn substitutions vs. number of analyses (#). b: Au, Pt, Sn substitutions vs. frequency (f) in %. c: Fe, Zn, Te, Pb substitutions vs. number of analyses. d: Fe and Zn substitutions vs. frequency. e: Te and Pb substitutions vs. frequency.
The ‘Pd, Fe and Zn’ group, represents more than 80% of all analyses and are Pd-skaergaardites with low Au and Pt (Table 6, rows 1, 4, 5). In this group, Cu is substituted by up to 8.9 wt% Fe and 9.5 wt% Zn (Table 4). The second group includes skaergaardite grains rich in Au and Te (Table 6, rows 3, 7) with typical isomorphic replacement of Pd by up to 31.5 wt% Au and up to 4.5 wt% Te (Rudashevsky et al. 2004). They are usually poor in Fe and Zn. The Sn and Pb group includes skaergaardite with up to 21.4 wt% Sn, and 5.5 wt% Pb substitution for Cu, Fe and Zn (Rudashevsky et al. 2004 and Table 6, rows 6 and 8). These skaergaardites are usually poor in Cu, Fe and Zn. The skaergaardites of the Pt group are Pt-rich (Table 6, row 2) with up to 12.7 wt% Pt substituting for Pd (Rudashevsky et al. 2004).
| Row no. | Variety | Pd | Pt | Au | Cu | Fe | Zn | Sn | Te | Pb | Sum | |
| Skaergaardite | ||||||||||||
| 1 | Pd | wt% | 63.6 | n.d. | n.d. | 29.3 | 5.0 | 2.6 | n.d. | n.d. | n.d. | 100.5 |
| prop. | 1.00 | - | - | 0.78 | 0.15 | 0.07 | - | - | - | 2.00 | ||
| 2 | Pt | wt% | 33.4 | 36.7 | n.d. | 20.5 | 8.6 | 0.6 | n.d. | n.d. | n.d. | 99.8 |
| prop. | 0.63 | 0.38 | - | 0.66 | 0.31 | 0.02 | - | - | - | 2.00 | ||
| 3 | Au | wt% | 25.7 | n.d. | 41.9 | 29.7 | 0.7 | n.d. | n.d. | 1.0 | n.d. | 99.0 |
| prop. | 0.51 | - | 0.46 | 1.00 | 0.02 | - | - | - | - | 2.00 | ||
| 4 | Fe | wt% | 63.7 | n.d. | n.d. | 26.9 | 8.9 | n.d. | n.d. | n.d. | n.d. | 99.5 |
| prop. | 1.01 | - | n.d. | 0.72 | 0.27 | - | - | - | - | 2.00 | ||
| 5 | Zn | wt% | 62.4 | n.d. | n.d. | 25.1 | 1.7 | 9.5 | n.d. | n.d. | n.d. | 98.7 |
| prop. | 1.01 | - | - | 0.69 | 0.05 | 0.25 | - | - | - | 2.00 | ||
| 6 | Sn | wt% | 56.7 | n.d. | n.d. | 18.8 | 2.0 | n.d. | 20.5 | n.d. | 1.1 | 99.1 |
| prop. | 1.02 | - | - | 0.57 | 0.07 | - | 0.33 | - | 0.01 | 2.00 | ||
| 7 | Te | wt% | 29.5 | 9.3 | 24.6 | 24.5 | 2.9 | n.d. | n.d. | 7.4 | 1.6 | 99.8 |
| prop. | 0.57 | 0.10 | 0.26 | 0.81 | 0.11 | - | - | 0.12 | 0.03 | 2.00 | ||
| 8 | Pb | wt% | 57.1 | 3.9 | 0.0 | 30.6 | 0.9 | 0.8 | 0.9 | 0.0 | 6.4 | 100.6 |
| prop. | 0.97 | 0.04 | 0.00 | 0.87 | 0.03 | 0.02 | 0.01 | 0.00 | 0.06 | 2.00 | ||
| Nielsenite | ||||||||||||
| 9 | Pd | wt% | 35.8 | 0.0 | 0.0 | 62.7 | 1.3 | n.d. | n.d. | n.d. | n.d. | 99.8 |
| prop. | 1.00 | 0.00 | 0.00 | 2.93 | 0.07 | - | - | - | - | 4.00 | ||
| 10 | Pt | wt% | 15.8 | 25.6 | 1.1 | 54.6 | 2.8 | n.d. | n.d. | n.d. | n.d. | 99.9 |
| prop. | 0.50 | 0.44 | 0.02 | 2.87 | 0.17 | - | - | - | - | 4.00 | ||
| 11 | Au | wt% | 18.6 | 1.8 | 25.9 | 52.0 | 1.3 | n.d. | n.d. | n.d. | n.d. | 99.6 |
| prop. | 0.60 | 0.03 | 0.45 | 2.84 | 0.08 | - | - | - | - | 4.00 | ||
| 12 | Au-Pt | wt% | 18.1 | 9.5 | 15.0 | 55.5 | 1.2 | n.d. | n.d. | n.d. | n.d. | 99.3 |
| prop. | 0.57 | 0.16 | 0.26 | 2.94 | 0.07 | - | - | - | - | 4.00 | ||
| a Maximum substitutions of indicated element in grain of given mineral. prop.: atomic proportions. n.d.: not detected. - indicates no data. Atomic proportions normalised to 2.00 for skaergaardite and to 4.00 for nielsenite. | ||||||||||||
Minerals composed of Pd and Cu dominate in all mineralisation levels (Pd6–Pd1) in the central drill cores and below the uppermost Au-rich mineralisation level (Pd3) at bulk-sampling locality ToF (location in Fig. 1). Skaergaardite (PdCu) from the lowermost mineralisation levels (Pd5 and Pd4) in cores from the centre of the intrusion is significantly enriched in Pt and low in Au and Te, whereas skaergaardite of the upper mineralisation levels (Pd2 and Pd1) is enriched in Au (Table 7) and mirrors the bulk-rock concentrations of PGE and Au (e.g. Nielsen et al. 2015).
4.3 Relationships between host rocks, sulphides and precious metal phases
The petrographic relations between all the phases in the studied samples provide a framework for the interpretation of the order in which the phases have formed. Parageneses of coexisting phases can be defined and provide the basis for a combined mineralogical and petrogenetic mineralisation model.
4.3.1 Droplets and globules
Droplets of sulphide melt in liquidus FeTi oxides are conspicuous in the Skaergaard PGE-Au Mineralisation (Nielsen et al. 2005; Godel et al. 2014). The droplets formed from sulphide melt, and some contain crystals and globules of precious metal phases. The globules are rounded grains and may have uncertain origins (see e.g. Karup-Møller et al. 2008). Droplets of sulphide melt may also be trapped between crystallising rock-forming minerals to form anhedral grains. Many skaergaardite grains in HS concentrates are associated with Cu-Fe sulphide grains, which may or may not represent droplets deformed between the grains of rock-forming minerals (e.g. Fig. 6b, c; see also Holwell et al. 2015).
Sulphide droplets with micro-droplets of skaergaardite and (Pd,Cu) alloys are found across the intrusion in ilmenite and titaniferous magnetite of the Pd5 and Pd4 mineralisation levels (Fig. 6d–g). A droplet of skaergaardite without a visible relationship to sulphide phases was also observed (Fig. 6e). FeTi oxide grains also contain spherical and ‘octahedral’ silicate inclusions, composed of hornblende, biotite, olivine, ferrosaponite (Fig. 14a–c) and individual (liberated) sulphide droplets with hydrous silicates (Fig. 14d–g) and skaergaardite globules (Fig. 14h–k). In some sulphide droplets, Skaergaardite accounts for most of their volume (e.g. Fig. 14j).
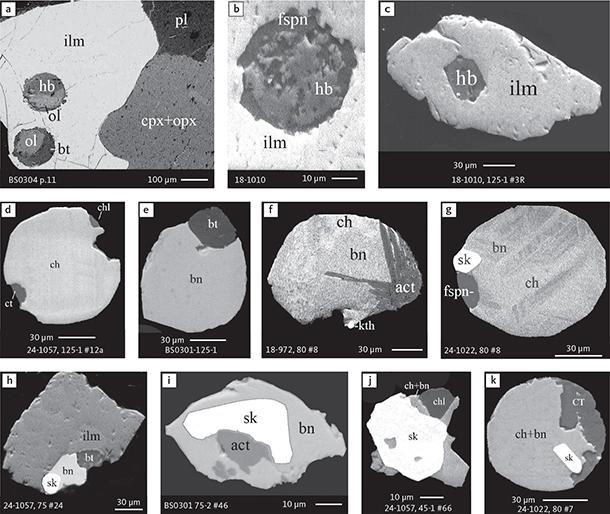
Fig. 14 BSE images of silicate globules in ilmenite and examples of hydrous silicates coexisting with sulphides and skaergaardite in polished thin sections and polished monolayer thin sections of gabbroic host and in heavy mineral HS concentrates. Table 3 provides formulae for the precious metal minerals. Formulae for common rock-forming minerals and base metal sulphides are found in Appendix 1. Abbreviated names of minerals, compounds and alloys are as follows: ilm: ilmenite. cpx: clinopyroxene. opx: orthopyroxene. ol: olivine. hb: hornblende. bt: biotite. act: actinolite. fspn: ferrosaponite. chl: chlorite. ct and CT: calcite. bn: bornite. ch: chalcocite. sk: skaergaardite. kth: keithconnite. pl: plagioclase. Grain numbers and scales included in the images.
Godel et al. (2014) conducted a HRXCT investigation of two samples from the mineralisation. The recomposed figures show silicate inclusions and sulphide droplets inside ilmenite grains (Fig. 15a, b), and precious metal grains as trains of elongated inclusions next to FeTi oxide (Fig. 15c). The relative volume of sulphide and hydrous silicate inclusions to precious metal grains is lower in the trains, compared to the volume relations in liquidus FeTi oxides (Godel et al. 2014). In one sample from the Au-rich uppermost mineralisation level from Pd4 near the western margin of the intrusion (equivalent to sample 10-434), Godel et al. (2014) found silicate droplets in FeTi oxide hosts, no sulphide droplets, but grains of Au phases along boundaries of rock-forming minerals.
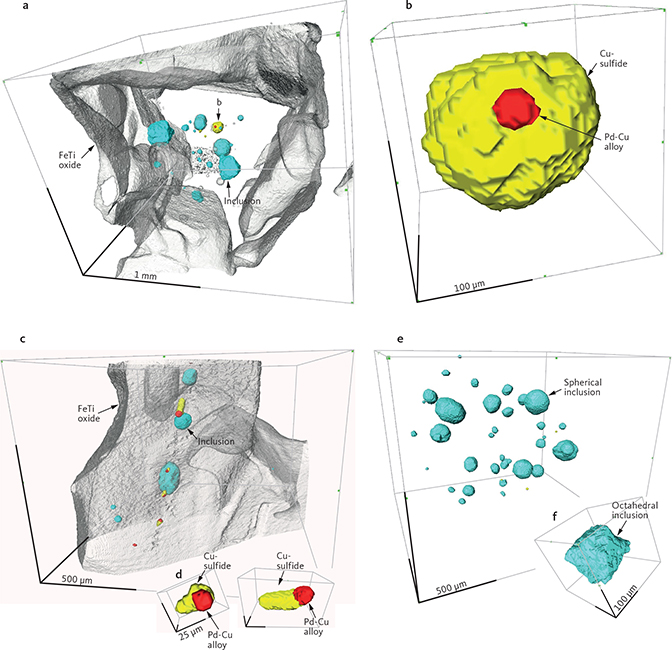
Fig. 15 Recompiled High-Resolution X-ray Computed Tomography (HRXCT) images after Godel et al. (2014) showing 3D images of the relationship between FeTi oxides (grey), Cu-, and Fe-sulphides (yellow), skaergaardite (red) and silicate inclusions (blue) enclosed in FeTi oxides. a: View into an ilmenite grain with silicate inclusions and sulphide droplet with skaergaardite grain attached. b: Magnified image of the sulphide droplet. c: Trains of silicate and sulphide with skaergaardite, possibly along pathway for interstitial melt. d: Focussed view shows the high skaergaardite to sulphide ratio compared to the ratio for sulphide droplets enclosed in ilmenite. e: Focussed view of the perfectly spherical inclusions with hydrous silicates and the octahedral silicate inclusion rich in FeTi oxides. The latter, also referred to as negative crystals, formed from silicate melt that was trapped while the ilmenite host crystallised.
4.3.2 Cu-Pd minerals
4.3.2.1 Relationships between Cu-Pd minerals and Cu-Fe sulphides
Skaergaardite (PdCu), nielsenite (Cu3Pd), non-stoichiometric alloys (Cu,Pd)β and (Cu,Pd)α compounds are mostly located at the margin of sulphide grains, irrespective of their shape. However, numerous droplet-like sulphide globules also host well-shaped micro-globules composed of Cu-Pd compounds. They also dominate the precious metal paragenesis in anhedral, interstitial intergrowths with Cu-Fe sulphides. The volume ratios between host sulphide and precious metal compounds show large variations (Figs 16, 17).
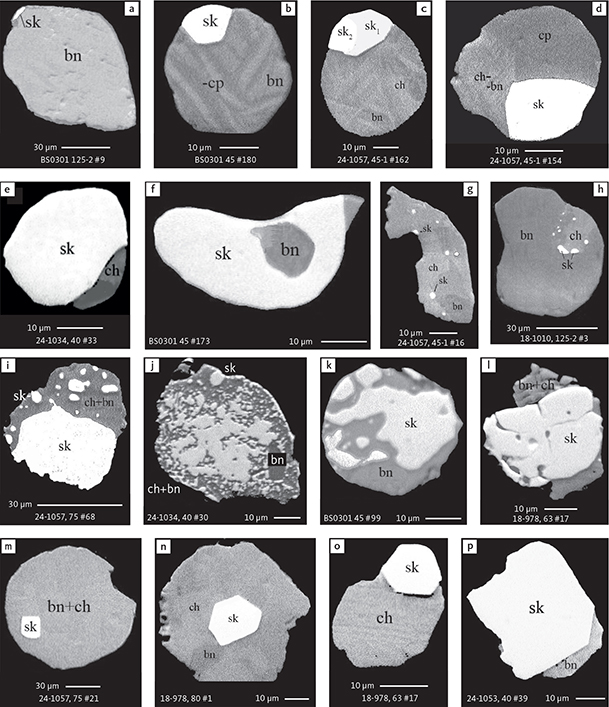
Fig. 16 BSE images showing the petrographic relations between skaergaardite and Cu-Fe sulphides in polished monolayer thin sections of HS concentrates. Table 3 provides formulae for the precious metal minerals. Formulae for common rock-forming minerals and base metal sulphides are found in Appendix 1. Note the multitude of relations from crystals of skaergaardite in centres as well as at margins of sulphide droplets, to a wide range of exsolution textures, and to tiny, disseminated droplets of skaergaardite throughout complex Cu-Fe sulphide grains. Abbreviated names of minerals, compounds and alloys are as follows: sk: skaergaardite including sk1: (PdCu)) and sk2: (Pd,Au)Cu). bn: bornite; ch: chalcocite. cp: chalcopyrite. Sample numbers and scales included in the images.
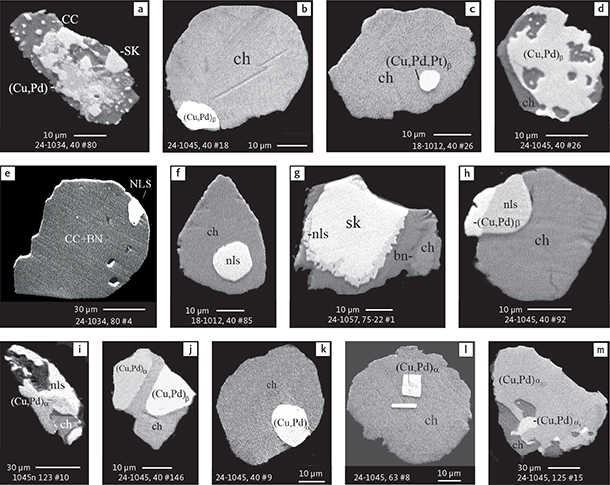
Fig. 17 BSE images showing the petrographic relationships between nielsenite (Cu3Pd), (Pd,Cu) alloys, skaergaardite and Cu-Fe sulphides in polished sections of HS concentrates. Note the multitude of petrographic relations and relative proportions between phases. Abbreviated names of minerals, compounds and alloys are as follows: sk and SK: skaergaardite (PdCu). nls and NLS: nielsenite (PdCu3). (Cu,Pd), (Cu,Pd,Pt)β, (Cu,Pd)α, (Cu,Pd)β: alloys of Cu, Pd and Pt. ch and CC: chalcocite. bn and BN: bornite. Table 3 provides formulae for the precious metal minerals. Formulae for common rock-forming minerals and base metal sulphides are found in Appendix 1. Grain numbers and scales included in the images.
The spatial relationship between sulphide host and micro-droplets include:
(1) rounded droplets or partly faceted grains of Сu-Pd compounds at the margin of sulphide globules (Figs 16a–e, 17b, e, h, k)
(2) small specks of precious metal droplets in sulphide host (Figs 16g, h, 17a, c, f)
(3) microdroplets of sulphides inside larger precious metal droplets (Figs 16f, 17d)
(4) fine precious metal emulsion in sulphide host (Figs 16i, j, 17a)
(5) small precious metal droplets merged into larger grains of skaergaardite (Figs 16h–l, 17d).
Euhedral crystals of precious metal phases are also found in some sulphide grains or droplets. They may be cubic or cubo-octahedral (Figs 16m–p, 17l). The relationships described here between sulphide hosts and precious metal phases apply to the entire range of Cu-Pd compounds including (Cu,Pd)β alloy, skaergaardite (PdCu), nielsenite (Cu3Pd) and (Cu,Pd)α alloy.
The heavy mineral HS concentrates contain fully liberated (free) grains of Cu-Pd compounds, including numerous droplet-shaped and irregularly shaped grains. They may be composed of one or more grains, and some resemble amalgamated micronuggets (Fig. 18). Small amounts of bornite or chalcocite attached to these ‘free’ precious metal globules suggest an origin with sulphide droplets or anhedral sulphide grains from interstitial spaces.
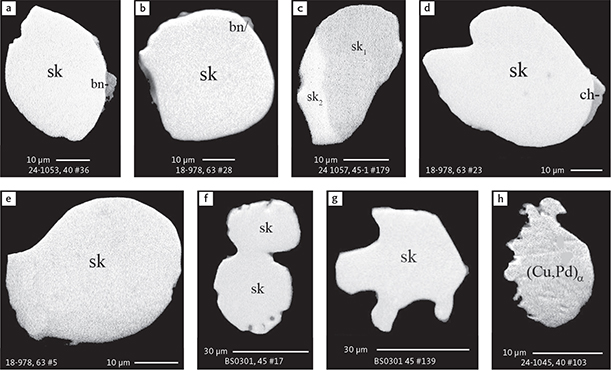
Fig. 18 BSE images of free grains of Cu and Pd minerals in polished monolayer thin sections of HS concentrates. The rounded grains may be droplets or grains formed during exsolution in sulphide (E. Makovicky, pers. comm. 2008). Note the grain in panel f, which appears to have formed by amalgamation of two individual grains. Abbreviated names of minerals, compounds and alloys are as follows: sk: skaergaardite (PdCu) including sk1: (PdCu)) and sk2: ((Pd,Au)Cu). (Cu,Pd)α: unnamed alloy. ch: chalcocite. bn: bornite. Table 3 provides formulae for the precious metal minerals. Formulae for common rock-forming minerals and base metal sulphides are found in Appendix 1. Grain numbers and scales included in the images.
The 2054 grains of skaergaardite (PdCu) found in the HS concentrates are 1–93 μm in size, with an average of 23 μm (Table 3). Godel et al. (2014) found a very similar average of 19.2 μm for 25 skaergaardite grains by HRXCT.
4.3.2.2 Intergrowths of more Cu-Pd minerals
More complex grains composed of two coexisting precious metal compounds, with or without Cu-Fe sulphide, are also found. The observed precious metal compound pairs include: skaergaardite (Sk1, PdCu; Sk2, Au-rich (Pd,Au)Cu; Fig. 16c), skaergaardite-nielsenite (Fig. 17g), alloy (Cu,Pd)β-nielsenite (Fig. 17h), nielsenite-alloy (Cu,Pd)α (Fig. 17m). The two types of skaergaardite (SK1 and SK2; Fig. 16c) have 9.0 and 23.3 wt% Au in solid solution and the two types of (Cu,Pd)α alloy in Figure 17m have 16.4% and 27.4% Pd, respectively (Rudashevsky & Rudashevsky 2006a).
4.3.2.3 Relationship between Cu-Pd minerals and other precious metal phases
Cu-Pd minerals hosted in sulphides are often accompanied by other precious metal phases. They include alloys of Pt, Fe, Cu and Pd; intermetallic compounds of Pd, Pb, Sn, Te, Sb; Pd-sulphides, and Au-Cu-Ag minerals (Fig. 19). They are spatially related to and often hosted in Cu-Pd minerals and alloys, and form a single, but complex precious metal paragenesis.
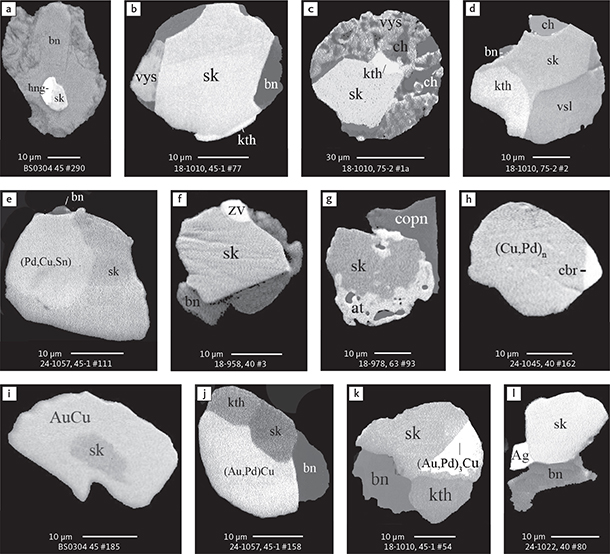
Fig. 19 BSE images showing the relationship between Cu and Pd minerals and other precious metal minerals in polished monolayer thin sections of HS concentrates. Table 3 provides formulae for the precious metal minerals. Formulae for common rock-forming minerals and base metal sulphides are found in Appendix 1. Note the high proportions of precious metal to Cu-Fe sulphide and in the rimming of skaergaardite by tetra-auricupride in panel i. Abbreviated names of minerals, compounds and alloys are as follows: sk: skaergaardite. (Cu,Pd)n: alloy of Cu and Pd. hng: hongshiite (Pt,Pd,Au)(Cu,Fe). vys: vysotskite. vsl: vasilite. at: atokite. kth: keithconnite. zv: zvyagintsevite. cbr: cabriite. (Pd,Cu,Sn): alloys of Pd, Cu and Sn. AuCu and (Au,Pd)Cu: tetra-auricupride. (Au,Pd)3Cu: unnamed compound. Ag: native silver. bn: bornite. ch: chalcocite. copn: cobaltian pentlandite. Grain numbers and scales included in the images.
Whereas the Cu-Pd minerals skaergaardite (PdCu) and (Cu,Pd) alloy, as a rule, are found in the interior of sulphide grains, other precious metal phases are mostly located at the margins of their Cu-Pd hosts. These include the dominant Au and Ag minerals tetra-auricupride (AuCu; Fig. 19i) and unnamed Au3Cu (Fig. 19k), native silver (Fig. 19l), and varieties of precious metal minerals (Fig. 19b–h) including varied and often poly-mineral intergrowths of Pd-sulphides like vasilite (Pd16S7) and vysotskite (PdS), intermetallic compounds with Sn, Pb and Te including the minerals zvyagintsevite (Pd3Pb), atokite ((Pd,Pt)3Sn), keithconnite (Pd3-xTe) and cabriite (Pd2CuSn). Some may have exsolved from the cooling Cu-Pd host. We note that the factor analysis of skaergaardite (PdCu) compositions in Rudashevsky et al. (2015) and observed petrographic relations summarised in this study show that the Cu-Pd phases in intergrowths with Pt minerals are usually Pt-rich, that skaergaardite in intergrowths with Au and Te minerals have significant Au and Te substitution, and that skaergaardite intergrowths with Sn intermetallic compounds are Sn-rich. There is a clear relationship between the composition of the Cu-Pd host and the spatially related precious metal paragenesis.
4.3.2.4 Pt minerals
The gabbros of the mineralisation are in general poor in Pt with averages over 1 m of drill core of <0.1 ppm but reach a maximum of 0.25 ppm in the Pd5 peak (Watts, Griffis & McOuat Ltd. 1991). Pt minerals are exceedingly rare and account for <0.2% of all precious metal mineral grains in all studied samples (Table 3, rows 19–21). They are usually <10 µm in size and occur as inclusions in Cu-Fe sulphide grains, Pd-rich PGEs and Cu-Au minerals. Pt is hosted in the following:
- (Pt,Fe,Pd,Cu) alloys in nine of the investigated samples (Fig. 20b, c, e; Table 8, rows 1 and 2)
- (Pt,Cu,Fe,Pd) alloy in a total of 21 grains found in 7 samples (Fig. 20a, d; Table 8, row 2)
- 53 grains of sperrylite (PtAs2) from 7 samples (Fig. 20h–l)
- Two grains of (Cu,Pt) alloy from a single sample (Fig. 18g; Table 8, row 3)
- One grain of an exotic (Pt,Cr,Pd) alloy (Fig. 18f; Table 8, row 4)
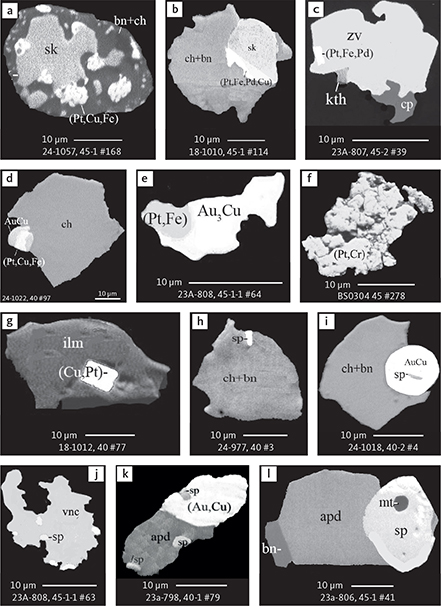
Fig. 20 BSE images of Pt minerals in polished monolayer thin sections of HS concentrates. Table 3 provides formulae for the precious metal minerals. Formulae for common rock-forming minerals and base metal sulphides are found in Appendix 1. Abbreviated names of minerals, compounds and alloys are as follows: (Pt,Cu,Fe), (Pt,Fe,Pd,Cu), (Pt,Fe,Pd), (Pt,Fe), (Cu,Pt): alloys of Pt, Cu, Fe, and Pd. (Pt,Cr): alloys of Pt and Cr. (Au,Cu): alloys of Au and Cu. sp: sperrylite. sk: skaergaardite. zv: zvyagintsevite. kth: keithconnite. apd: arsenopalladinite. vnc: vincentite. AuCu: tetra-auricupride. Au3Cu: unnamed compound. bn: bornite. ch: chalcocite. cp: chalcopyrite. ilm: ilmenite. mt: magnetite. Grain numbers and scales included in the images.
The Pt alloys are mainly found in the Pd5 mineralisation level in more central parts of the mineralisation (Fig. 20a, b). In drill cores from the margins of the intrusion (90-10 and 90-23A), Pt is hosted in sperrylite (PtAs2) associated with Pd arsenides, PGE intermetallic compounds and Au minerals (Fig. 20c–e, i–l). The largest grain of sperrylite has an ECD of 69 μm.
4.3.3 Intermetallic compounds and alloys of Au, Cu and Ag
Minerals composed only of Au and Cu are rare in nature (e.g. Novgorodova 1983; Bird et al. 1991; Andersen et al. 1998; Spiridonov 2010a). Only two are presently approved by the IMA. These are tetra-auricupride (AuCu) and auricupride (AuCu3). Tetra-aurucupride is tetragonal and is the structural analogue of artificial AuCu I (Chen et al. 1982; Novgorodova 1983; Spiridonov et al. 2005). Auricupride is an ordered cubic phase and the structural analogue of synthetic AuCu3 I (Okamoto et al. 1987). To these are related more disordered cubic alloys (solid solutions) of Au and Cu (e.g. Lozhechkin 1935, 1939; Novgorodova 1983; Spiridonov et al. 2005).
Zaccarini et al. (2004) report the occurrence of Cu-rich tetra-auricupride with a simplified composition close to Cu3Au2 and intermediate between tetra-auricupride (AuCu) and unnamed (AuCu3). Grains with the stoichiometric composition Au3Cu are common in the Skaergaard intrusion, but this unnamed mineral with cubic syngony is at present insufficiently documented for IMA approval (Pokrovskii et al. 1979; Spiridonov & Pletnev 2002; Knight & Leitch 2001).
The Cu-Au (Ag) intermetallic compounds and alloys in the studied samples exhibit a wide range of compositions. They form a compositional suite from auricupride (AuCu3), to tetra-auricupride (AuCu), unnamed Au3Cu, and native gold with variable substitutions by Ag. All the minerals of this Au-Cu series can contain high concentrations of Pd and sometimes Pt. The Ag-enriched (Au,Cu) alloys were previously reported (Nielsen et al. 2003a–e; Cabri et al. 2005a; Rudashevsky & Rudashevsky 2005a, b, 2006a; Rudashevsky et al. 2009a, b, 2010a–d, 2012a–i, 2014, 2015).
Grains of tetra-auricupride (AuCu) are often hosted in Cu-Fe sulphide grains composed of chalcocite and bornite. A total of 1595 grains of Au, Cu, and Ag compounds were found in 27 of the 30 samples using BSE imagery and EMP analysis. They are also observed in polished thin sections of the host gabbro from Au-rich mineralisation levels, such as in samples 24-1018 (Rudashevsky & Rudashevsky 2005a) and BS0304 (Cabri 2003).
The Au-Cu phases are identified based on their compositions. A total of 804 EMP analyses identify six groups of Cu-Au phases on the basis of the relative proportion of (Au+Pd+Pt+Ag) (at.%; Fig. 21). The groups are as follows: (1) 20–30 at.% auricupride (AuCu3); (2) 40–45% (Сu,Au) alloys, which may be similar to Cu-rich tetra auricupride of Zaccarini et al. (2004); (3) 45–55 at.% tetra-auricupride (AuCu); (4) 55–70 at.% (Au,Cu) alloys; (5) 70–80 at.% unnamed mineral (Au3Cu); (6) 80–100 at.% (Au,Cu,Ag) alloys. Native gold and silver are best referred to as (Ag,Au) and (Ag,Cu).
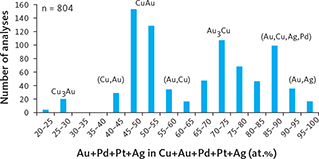
Fig. 21 Compositions and proportions of Au-Cu minerals and phases. The histogram shows the wide compositional range and the frequency of Au-rich minerals, intermetallic compounds and alloys of Au and Cu in the mineralisation. Based on compositions of a total of 804 analyses and expressed as sum of (Au+Pd+Pt+Ag) in at.%. The data set includes 0.1% unnamed compound Au3Cu and 0.1% (Au,Cu,Ag) alloy, which are not shown here. Abbreviations are as follows: CuAu: tetra-auricupride. Cu3Au: auricupride. (Au,Cu), (Cu,Au), (Au,Cu,Ag,Pd): alloys of Au, Cu and Ag.
Grains of Au, Cu and Ag were recovered from 27 samples and represent c. 30.2% of the total area of all precious metal grains found in the studied samples (Table 3). Tetra-auricupride (AuCu) dominates with 19% (row 8), followed by (Au,Cu,Ag,Pd) alloys (row 13) with 5.8% and (Au,Cu,Pd) alloys with 2.9% (row 11). All other Au-rich compositions represent <0.75% and sum to a total of 2.3% (Table 3, rows 9, 10, 12, 14–18). Average compositions of all Au, Cu and Ag minerals and compounds are listed in Table 9 and the compositional range of Au and Cu minerals are presented in Table 10. The alloys dominated by Au and Cu often contain significant concentrations of Pd, occasionally Pt and Te (Table 10). Exotic (Cu,Au) alloys with wt% Fe, Zn and Ni substitutions were also found (e.g. grain 24-1018 40#274 with Au 68.5 wt%, Pd 0.8 wt%, Cu 24.3 wt%, Fe 5.1 wt% and a total of 98.7 wt%, and grain 18-988 40#5 with Au 59.8 wt%, Ag 2.0 wt%, Cu 24.2 wt%, Fe 0.3 wt%, Zn 5.8 wt%, Ni 7.6 wt%, and a total of 99.8 wt%).
| Mineral type | Au | Pd | Pt | Ag | Cu | Fe | Te | Sum |
| (wt%) | ||||||||
| Tetra-auricupride AuCu | ||||||||
| Pd | 44.4 | 23.3 | 1.9 | n.d. | 29.6 | 0.6 | n.d. | 99.8 |
| Pd-Pt | 36.9 | 24.0 | 8.5 | n.d. | 28.4 | 1.5 | n.d. | 99.3 |
| Ag | 54.7 | 9.6 | n.d. | 8.8 | 25.8 | 0.8 | n.d. | 99.7 |
| Auricupride AuCu3 | ||||||||
| Pd | 30.0 | 13.5 | n.d. | n.d. | 51.1 | 3.5 | n.d. | 98.1 |
| Pt | 22.6 | 4.9 | 22.3 | n.d. | 48.5 | 1.2 | n.d. | 99.5 |
| Unnamed Au3Cu | ||||||||
| Pd | 55.2 | 26.7 | 2.7 | n.d. | 13.6 | 1.1 | n.d. | 99.3 |
| Pt | 51.7 | 17.9 | 18.6 | n.d. | 8.4 | 2.7 | n.d. | 99.3 |
| Pd-Ag | 80.8 | 6.7 | n.d. | 2.4 | 9.5 | n.d. | n.d. | 99.4 |
| (Au,Cu,Pd) Alloy | ||||||||
| Te | 49.1 | 23.2 | 2.7 | n.d. | 14.5 | 1.2 | 8.2 | 98.9 |
| Pt | 61.3 | 14.7 | 3.6 | n.d. | 19.0 | 1.0 | n.d. | 99.6 |
| (Cu,Au,Pd,Pt) Alloy | ||||||||
| Pd | 59.8 | 16.1 | n.d. | n.d. | 22.8 | 0.9 | n.d. | 99.6 |
| Pt | 66.0 | n.d. | 3.5 | n.d. | 28.0 | 1.3 | n.d. | 98.8 |
| (Au,Cu,Ag) Alloy | ||||||||
| Cu | 79.0 | 2.3 | n.d. | 1.5 | 14.7 | 2.0 | n.d. | 99.5 |
| Ag | 74.5 | 1.4 | n.d. | 17.9 | 3.2 | 1.1 | n.d. | 98.1 |
| Pd-Pt | 67.8 | 17.3 | 3.5 | 0.9 | 9.5 | n.d. | n.d. | 99.0 |
| Pt | 90.6 | n.d. | 3.6 | 2.0 | 3.8 | n.d. | n.d. | 100.0 |
| a EMP analyses of individual grains with maximum substitutions n.d.: not detected. | ||||||||
The relative proportions of Au- and Cu-alloys vary throughout the mineralised gabbros. In the central parts of mineralisation, the ordered compounds such as tetra-auricupride (AuCu) and auricupride (AuCu3) comprise 90.7% of all Au-Cu phases in all Au-rich mineralisation levels for which data are available (Pd1/Au in drill cores 90-24 and 90-18 and bulk sample BS0304 from ToF; Fig. 22a). In sharp contrast, Ag-rich alloys (Au,Cu,Ag) dominate (up to 100%) in samples 90-23A-798 and 90-10-434, from the Au-rich Pd4 mineralisation level in drill cores nearer to the margins of the intrusion (Fig. 22b).
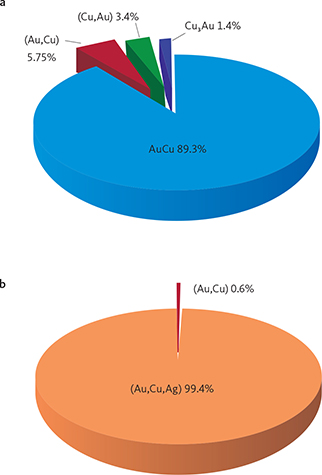
Fig. 22 Au-rich parageneses in a: mineralisation level Pd1/Au in all drill core samples from the centre of the intrusion and b: mineralisation level Pd4 near the margins of the intrusion. In (a), the average is based on data from samples 90-24-1018, 90-18-958 and bulk sample BS0304 from ToF (locations in Fig. 1) and is representative for the Au-rich levels in the central parts of mineralisation. In (b) the average is based on samples 90-23A-798 and 90-10-434. AuCu: tetra-auricupride; Cu3Au: auricupride; (Au,Cu), (Cu,Au), (Au,Cu,Ag): alloys of Au, Cu and Ag. Not shown in (a): 0.1% unnamed compound Au3Cu and 0.1% (Au,Cu,Ag) alloy.
These paragenetic variations between Pd-rich and Au-rich mineralisation levels and between the centre and margin of the intrusion are paralleled in the compositions of the Au-Cu minerals (Table 11). The average composition of tetra-auricupride (AuCu) in Pd5 is significantly enriched in Pd (22.3 wt%) and Pt (1.6 wt%; at 95% confidence level) compared to tetra-auricupride in the Pd1/Au layer (4.9 wt% Pd, 0.4 wt% Pt; Table 11, rows 1 and 2). Alloys (Au,Cu,Ag,Pd) from Pd5 in drill cores near the margins of the intrusion (samples 90-23A-806, -807, -808 and 90-10-443, -445) are enriched in Pd, Pt and Ag, compared to the overlying Au-rich Pd4 mineralisation level (Table 11, rows 3 and 4). The same type of compositional variation is shown in most of the Au-Cu minerals. They are Pd-rich in Pd5 and Pd-poor in the Au-rich mineralisation levels, irrespective of the absolute elevation of the Au peak above Pd5 (Table 11, rows 5–12).
4.3.3.1 Relationships of intermetallic compounds and (Au,Cu,Ag) alloys to Cu-Fe sulphides
The Au-rich phases are mostly found at the margins of sulphide grains (Fig. 23a). Common droplet-like sulphide globules as well as irregular grains of sulphides host microdroplets of Au-minerals. The unique textures of these types of ‘two-liquid’ grains include:
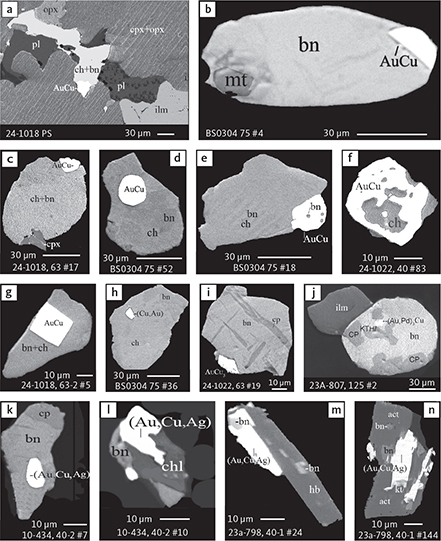
Fig. 23 BSE images showing the petrographic relations between (Au,Cu) phases and rock-forming minerals of the gabbroic host and sulphides. a: polished thin section of gabbro with interstitial sulphide and tetra-auricupride (AuCu). b–n: polished monolayer thin sections of HS concentrates. Panels a–i are from samples in the central part of the intrusion, and j–n are from samples near the margins of the intrusion. Table 3 provides formulae for the precious metal minerals. Formulae for common rock-forming minerals and base metal sulphides are found in Appendix 1. Grain numbers and scales included in the images. Abbreviated names of minerals, compounds and alloys are as follows: AuCu: tetra-auricupride. (Cu,Au), (Au,Cu,Ag): alloys of Au, Cu and Ag. (Au,Pd)3Cu: unnamed Au3Cu. kt: kotulskite (PdTe). bn: bornite. ch: chalcocite. cp and CP: chalcopyrite. opx: orthopyroxene. cpx: clinopyroxene. pl: plagioclase. ilm: ilmenite. hb: hornblende. act: actinolite. kth: keithconnite. mt: magnetite. chl: chlorite.
- droplets of Au-phases (Au,Cu) at the margins of droplet-like sulphide grains (Fig. 23b, c, e)
- metal droplets inside sulphide hosts (Fig. 23d, k)
- microdroplets of Cu-sulphide inside larger droplets of precious metal (Fig. 23e, f).
In addition, Au-rich minerals also form idiomorphic cubic and cuboctahedral crystals in sulphide hosts (e.g. Au in Fig. 23g and (Cu,Au) in Fig. 23h). These occurrences of Au phases are all related to sulphide grains (Fig. 23) with few exceptions.
Near the margins of the intrusion in drill cores 90-10 and 90-23A, however, the Au phases are commonly separated spatially from the sulphides. In these gabbros, the Au phases are unattached to sulphides (Fig. 23l–n) and commonly form elongated grains related to hydrous silicates in interstitial spaces (also illustrated in Godel et al. (2014)).
Free grains of Au minerals, as well as more irregular droplet-like particles of (Au,Cu,Pd) and (Au,Cu,Ag) alloys and grains with compositions of tetra-auricupride (AuCu), auricupride (Cu3Au) and the unnamed mineral Au3Cu (Fig. 24a–j) are common in HS concentrates. More complex grains are referred to as micronuggets and may have formed by amalgamation of smaller grains.
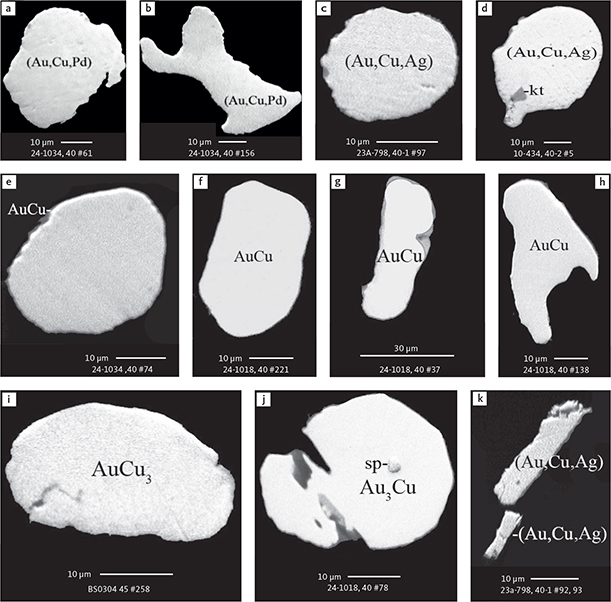
Fig. 24 BSE images of free grains of Au and Cu minerals in monolayer polished thin sections of HS concentrates. Abbreviated names of minerals, compounds and alloys are as follows: AuCu: tetra-auricupride. AuCu3: auricupride. Au3Cu: unnamed alloy. (Au,Cu,Pd), (Au,Cu,Ag): alloys of Au, Cu, Pd and Ag. sp: sperrylite. kt: kotulskite. Table 3 provides formulae for the precious metal minerals. Formulae for common rock-forming minerals and base metal sulphides are found in Appendix 1. Grain numbers and scales included in the images.
4.3.3.2 Grain intergrowths of more Au-Cu minerals
Au-rich grains from the central and upper Au-rich Pd2 and Pd1 mineralisation levels are commonly zoned (Fig. 25a–g; Table 12). Observed types of zoning include:
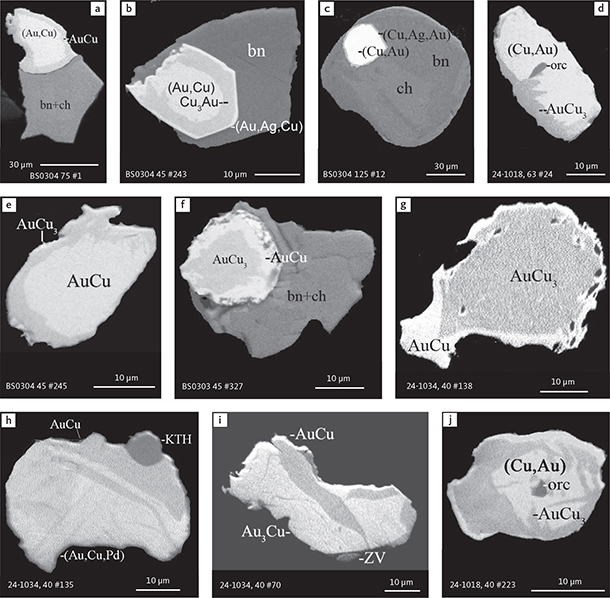
Fig. 25 BSE images of zoned grains of Au minerals, Cu minerals and exsolution textures in polished thin sections of HS concentrates. Note the solid state exsolution of auricupride (panel j). Table 3 provides formulae for the precious metal minerals. Formulae for common rock-forming minerals and base metal sulphides are found in Appendix 1. Grain numbers and scales included in the images. Abbreviated names of minerals, compounds and alloys are as follows: Au3Cu: unnamed compound. AuCu: tetra-auricupride. AuCu3 and Cu3Au: auricupride. (Au,Cu), (Cu,Au), (Au,Cu,Pd), (Cu,Ag,Au), (Au,Ag,Cu): alloys of Au, Cu, Ag and Pd. ZV: zvyagintsevite. KTH: keithconnite. orc: orcelite (Ni5-xAs2). bn: bornite. and ch: chalcocite.
- (Au,Cu) alloy rimmed by AuCu (Fig. 25a)
- (Cu,Au) alloy rimmed by AuCu3 followed by (Au,Ag,Cu) alloy (Fig. 25b)
- (Cu,Au) alloy rimmed by (Cu,Ag,Au) alloy (Fig. 25c)
- (Cu,Au) alloy rimmed by AuCu3 (Fig. 25d)
- AuCu rimmed by AuCu3(Fig. 25e)
- AuCu3 rimmed by AuCu (Fig. 25f, g)
These types of zoned grains occur in HS concentrates in intergrowths with the sulphides bornite, chalcocite, chalcopyrite and as free grains. Intergrowths of Au and Cu minerals with solid exsolution-like textures were also observed (Fig. 25h, j; Table 13) and include (Au,Cu,Pd) alloy with lamellae of tetra-auricupride (AuCu), (Cu,Au) alloy with auricupride (AuCu3), and unnamed Au3Cu mineral with tetra-auricupride (AuCu).
4.3.3.3 Relationships of intermetallic compounds and (Au,Cu,Ag) alloys with PGEs
Intergrowths between tetra-auricupride (AuCu) and tellurides are very common in the Au-rich Pd1/Au mineralisation level (Fig. 26a, b). The most common telluride is kotulskite (PdTe), followed by merenskyite (PdTe2), melonite (NiTe2, Fig. 26e) and keithconnite (Pd3-xTe; Fig. 26c). Small inclusions of arsenides can also be found in tetra-auricupride and include the minerals sperrylite (PtAs2; Fig. 26f) and orcelite (Ni5-xAs2; Fig. 25d, j).
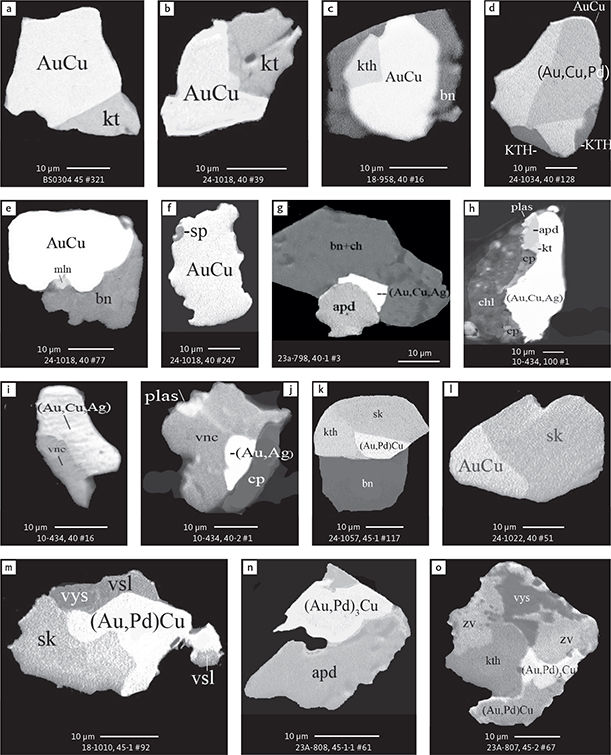
Fig. 26 BSE images of the petrographic relations between Au minerals and Cu minerals with PGEs in polished monolayer thin sections of the heavy mineral HS concentrates. The Au and Cu minerals are associated with virtually all other precious metal phases of the mineralisation. Table 3 provides formulae for the precious metal minerals. Formulae for common rock-forming minerals and base metal sulphides are found in Appendix 1. Grain numbers and scales included in the images. Abbreviated names of minerals, compounds and alloys are as follows: AuCu: tetra-auricupride. (Au,Pd)Cu: tetra-auricupride. (Au,Pd)3Cu: unnamed compound. (Au,Cu,Pd), (Au,Cu,Ag): alloys of Au, Cu, Pd and Ag. (Au,Ag): native gold. sk: skaergaardite (PdCu). kt: kotulskite (PdTe). kth and KTH: keithconnite (Pd3-xTe). mln: melonite (NiTe2). sp: sperrylite. apd: arsenopalladinite. plas: palladoarsenide. vnc: vincentite. vys: vysotskite. vsl: vasilite. zv: zvyagintsevite. bn: bornite. ch: chalcocite. cp: chalcopyrite. chl: chlorite.
In Pd5 and Pd4 mineralisation levels from drill cores 90-10 and 90-23A from near the margins of the intrusion, (Au,Cu,Ag,Pd) alloys are associated with Pd arsenides and Pt arsenides such as arsenopalladinite ((Pd,Cu)8As3; Fig. 26g, h), palladoarsenide (Pd2As; Fig. 20h, j), and sperrylite (PtAs2; Fig. 20i, k); vincentite (Pd,Cu)3As (Fig. 26h–j) and isomertieite Pd11As2(Sb,Sn)2 (Fig. 32h, i). In the Au-rich Pd4 horizon, kotulskite (PdTe) often occurs in intergrowths with (Au,Cu,Ag,Pd) alloy (Fig. 26h).
Cu-Au minerals are rare in the skaergaardite dominated Pd6 and Pd5 mineralisation levels in central drill cores and sampling sites. Here, the Cu-Au phases are associated with skaergaardite, keithconnite (Pd3-xTe; Fig. 26k, l), and the Pd sulphides vasilite ((Pd,Cu)16S7) and vysotskite ((Pd,Cu,Ni)S; Fig. 26m). In contrast, Cu-Au minerals comprise up to 28% of the parageneses in the uppermost metre of Pd5 in drill cores near the margins of the intrusion (Nielsen et al. 2003e, Rudashevsky et al. 2012d). Here, the Cu-Au phases are related to Pd-intermetallic compounds, arsenides and sulphides such as zvyagintsevite (Pd3Pb), atokite (Pd3Sn), keithconnite (Pd3-xTe), vysotskite ((Pd,Ni)S), arsenopalladinite (Pd8As3), vincentite ((Pd,Cu)3As), palladoarsenide (Pd2As), and sperrylite (PtAs2).
4.3.3.4 Relationships between Au-Cu compounds and rock-forming minerals
Intermetallic compounds and alloys of Au and Cu occur in intergrowths with the primary rock-forming minerals pyroxenes, plagioclase, FeTi oxides and olivine (Fig. 27a–j). Near the margins of the intrusion in drill cores 90-10 and 90-23A, Au-Cu minerals are also found in veins between grains of Cu-Fe sulphides and typical late- to post-magmatic hydrous minerals, such as hornblende, actinolite, biotite, chlorite and talc (Fig. 27k–p).
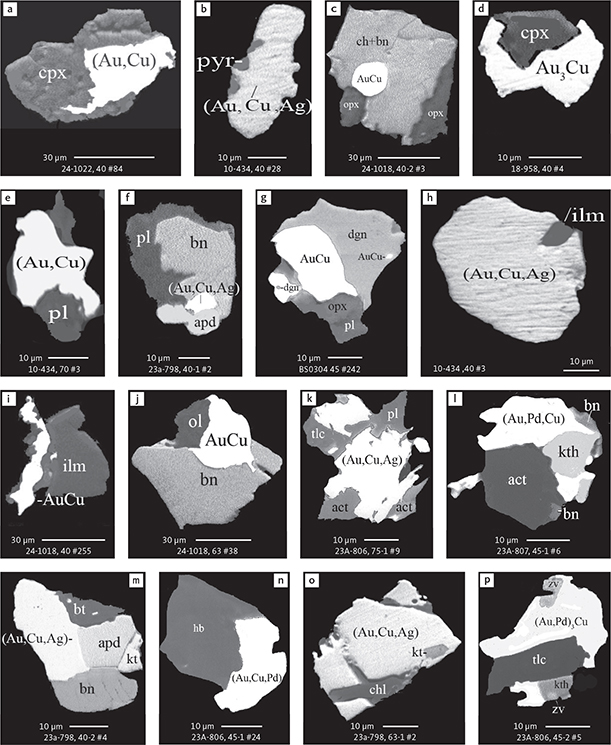
Fig. 27 Relationship between Au and Cu minerals and rock-forming minerals of the gabbroic host in polished monolayer thin sections of HS concentrates. Note that Au-Cu phases in general coexist with ‘dry’ parageneses in the centre of the intrusion (samples from drill cores 90-24 and 90-18, and bulk sample BS0304), and with hydrous silicate parageneses near the margins (samples from drill core 90-10 and 90-23A). Table 3 provides formulae for the precious metal minerals. Formulae for common rock-forming minerals and base metal sulphides are found in Appendix 1. Grain numbers and scales included in the images. Abbreviated names of minerals, compounds and alloys are as follows: AuCu: tetra-auricupride. (Au,Cu), (Au,Cu,Ag), (Au,Pd,Cu), (Au,Cu,Pd): alloys of Au, Cu, Pd and Ag. Au3Cu and (Au,Pd)3Cu: unnamed compounds. apd: arsenopalladinite (Pd8As3). zv: zvyagintsevite (Pd3Pb). kth: keithconnite (Pd3-xTe). kt: kotulskite (PdTe). cpx: clinopyroxene. opx: orthopyroxene. pyr: pyroxene. pl: plagioclase. ol: olivine. ilm: ilmenite. hb: hornblende. act: actinolite. bt: biotite. chl: chlorite. tlc: talc. bn: bornite. ch: chalcocite. dgn: digenite.
4.3.4 PGE sulphides and S-bearing Ag minerals
PGE sulphides account for 3.8% of all studied PGEs and Au-rich grains (Table 3, rows 23–33). They are found at all mineralisation levels but are most common in drill cores from the western part of the intrusion, such as in samples 90-18-988, 90-18-972, 90-10-445 and 90-10-443, where Pd, Cu and Ag sulphides constitute 40–70% of the precious metal parageneses (see Nielsen et al. 2019a). Their relative proportion is reduced to <1% in the Au-rich mineralisation levels of cores 90-10 and 90-18 (Fig. 10; see also Nielsen et al. 2019a, Table 4 and Fig. 9).
Vysotskite ((Pd,Ni,Cu)S) and vasilite ((Pd,Cu)16S7) are the most common PGE-sulphides and account for 1.7% and 1.6% of all precious metal phases, respectively (Fig. 28). The compositional ranges and the average compositions of a total of 100 grains of vysotskite and of 52 grains of vasilite are shown in Table 14. In some cases, the vysotskite grains divide into two contrasting sub-grains, with 3.6 wt% and 22.5 wt% Pt, respectively (Fig. 28d; Table 14, rows 2 and 3). The remaining 0.5% include exotic sulphides rich in Ag (Ag,Pd,Cu), Cu (Cu,Pd,Ag) or Pd (Pd,Ag,Cd,Hg,Tl) (Table 3, rows 25–32; Fig. 29). The substituting elements are the formulae listed in order of decreasing proportion.
| Row no. | Sample no. | Grain no. | Type | Pd | Pt | Cu | Fe | Ni | S | Te | Sum | |
| Vysotskite (Pd,Ni,Cu,Pt)(S,Te) | ||||||||||||
| 1 | 18-1010 | 45#106 | ‘Pure’ a | wt% | 75.0 | n.d. | n.d. | n.d. | 0.9 | 23.0 | n.d. | 98.9 |
| prop. | 0.98 | - | - | - | 0.02 | 1.00 | - | 2.00 | ||||
| 2 | 18-988 | 40#18 | Ni-Pt | wt% | 66.8 | 3.6 | 1.0 | n.d. | 5.0 | 23.9 | n.d. | 100.2 |
| prop. | 0.84 | 0.02 | 0.04 | - | 0.11 | 1.00 | - | 2.00 | ||||
| 3 | 18-988 | 40#18 | Pt | wt% | 48.2 | 22.5 | 1.1 | 0.9 | 2.5 | 21.1 | n.d. | 99.4 |
| prop. | 0.69 | 0.20 | 0.03 | 0.03 | 0.06 | 1.00 | - | 2.00 | ||||
| 4 | 18-988 | 40#18 | Cu | wt% | 65.3 | n.d. | 8.6 | 1.2 | n.d. | 24.2 | n.d. | 99.3 |
| prop. | 0.8 | - | 0.18 | 0.03 | n.d. | 0.99 | - | 2.00 | ||||
| 5 | 18-1010 | 45-46 | Ni | wt% | 63.1 | n.d. | 1.3 | 0.7 | 8.6 | 25.2 | n.d. | 98.9 |
| prop. | 0.76 | - | 0.03 | 0.02 | 0.19 | 1.01 | - | 2.00 | ||||
| 6 | 18-1010 | 75/2#29 | Te | wt% | 33.6 | 33.7 | 6.1 | 1.6 | n.d. | 17.2 | 6.4 | 98.6 |
| prop. | 0.52 | 0.29 | 0.16 | 0.05 | n.d. | 0.9 | 0.08 | 2.00 | ||||
| 7 | Multiple | ave. of 100 grains | wt% | 71.1 | 0.8 | 1.5 | 0.6 | 1.8 | 23.6 | 0.1 | 99.5 | |
| prop. | 0.91 | 0.01 | 0.03 | 0.01 | 0.04 | 1.00 | - | 2.00 | ||||
| SD | 5.75 | 4.31 | 1.48 | 0.45 | 2.41 | 0.95 | 0.64 | - | ||||
| Vasilite (Pd,Cu,Fe)16S7 | ||||||||||||
| 8 | Multiple | ave. of 52 grains | wt% | 72.2 | 14.0 | 0.5 | n.d. | n.d. | 12.7 | n.d. | 99.4 | |
| prop. | 11.97 | 3.88 | 0.17 | - | - | 6.99 | - | 23.00 | ||||
| SD | 1.26 | 0.96 | 0.41 | - | - | 0.20 | - | - | ||||
| a close to empirical formula PdS. ave.: average. prop: atomic proportions. SD: standard deviation. n.d.: not detected. - indicates no data. | ||||||||||||
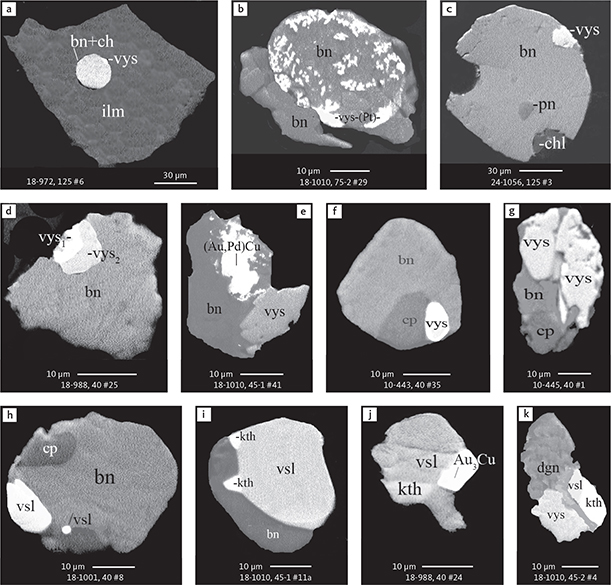
Fig. 28 BSE images of vysotskite and vasilite in polished monolayer thin sections of HS concentrates. The precious metal sulphides form as exsolutions in sulphide droplets, as exsolutions on the margins of sulphide globules and as irregular grains intergrown with other precious metal phases. Table 3 provides formulae for the precious metal minerals. Formulae for common rock-forming minerals and base metal sulphides are found in Appendix 1. Grain numbers and scales included in the images. Abbreviations: vys: vysotskite, including Pd-rich vys1 and Pt-rich vys2. vys-(Pt): vysotskite with no Pt. vsl: vasilite. kth: keithconnite. (Au,Pd)Cu: tetra-auricupride. Au3Cu: unnamed compound. bn: bornite. ch: chalcocite. cp: chalcopyrite. dgn: digenite. pn: pentlandite. ilm: ilmenite. chl: chlorite.
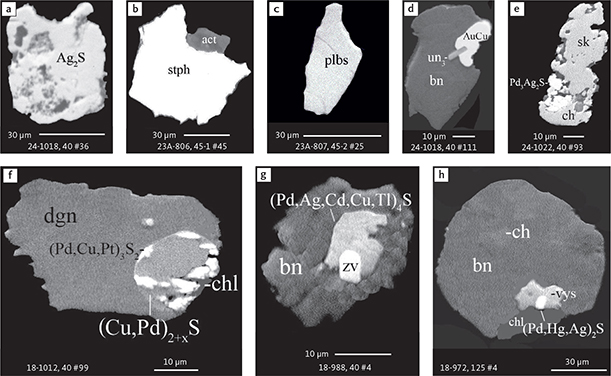
Fig. 29 BSE images of rare PGE sulphides in polished monolayer thin sections of HS concentrates. All phases are rare and some are found only as single grains. Table 3 provides formulae for the precious metal minerals. Formulae for common rock-forming minerals and base metal sulphides are found in Appendix 1. Formulae are given here for rare minerals that are not listed in Table 3 or Appendix 1. Abbreviated names of minerals, compounds and alloys are as follows: AuCu: tetra-auricupride. Ag2S: acanthite/argentite. stph: stephanite (Ag5SbS4). plbs: polybasite (Ag16Sb2S11). Pd3Ag2S: coldwellite. sk: skaergaardite. un3: unnamed compounds, including (Pd3Cu6S3Te2), (Pd,Hg,Ag)2S, (Cu,Pd)2-xS, (Pd,Cu,Pt)3S2 and (Pd,Ag,Cd,Cu,Tl)4S. zv: zvyagintsevite. vys: vysotskite. bn: bornite. ch: chalcocite. dgn: digenite. act: acanthite. chl: chlorite. Grain numbers and scales included in the images.
Single grains of stephanite (Ag5SbS4), polybasite (Ag16Sb2S11) and acanthite/argentite (Ag2S; Fig. 29a–c) were also found and are all near-stoichiometric. Compositions of very rare and exotic unnamed sulphides composed of Pd, Cu, Pt, Ag, Cd, Hg and Tl (Table 15) include coldwellite (Pd3Ag2S; McDonald et al. 2015; Fig. 29e; Table 15, row 1).
Irregular and droplet-like inclusions of the sulphides include ideal droplets of bornite, chalcocite and vysotskite (PdS) in ilmenite (Fig. 28a), a droplet of bornite and vysotskite in a bornite host (Fig. 28b) and microdroplets of vysotskite and vasilite (Pd16S7) in bornite and chalcopyrite-bornite host globules (Fig. 28c–i). Polymineralic grains of vysotskite and vasilite with other Pd-intermetallic compounds occur in samples near the margins of the intrusion. The intermetallic compounds include zvyagintsevite (Pd3Pb), keithconnite (Pd3-xTe) and arsenides, such as arsenopalladinite (Pd8As3), palladoarsenide (Pd3As) and vincentite ((Pd,Pt)3(As,Sb,Te)), in association with Cu-Fe sulphides and hydrous silicates (e.g. Fig. 26o).
These Pd sulphides appear to form one single paragenesis with Cu-Pd intermetallic compounds and alloys, mostly with skaergaardite (CuPd; Fig. 19b–d), and with Au and Cu minerals (Figs 26m–o, 28e, j) in Cu-Fe sulphide globules together with keithconnite, zyagintsevite and other PGEs.
4.3.5 Intermetallic compounds of Pd, Cu and Ag with Pb, Te, Sn, Sb and Bi
Intermetallic compounds of Pd, Cu and Ag with Pb, Te, Sn, Sb and bismuth (Bi) are widespread in the mineralisation (Table 3, rows 40–54), but account for no more than 2.6% of all observed precious metal phases. They include 1.6% zvyagintsevite (Pd3Pb), 0.5% keithconnite (Pd3-хTe), 0.2% atokite (Pd3Sn), 0.1% kotulskite (Pd(Te,Bi)2-x; Fig. 30a–i) and 0.18% non-stoichiometric (Pd,Cu,Sn,Pb,Te) alloys (Table 3, row 52). The group includes some very rare phases, sometimes represented by only a single grain, such as cabriite (Pd2CuSn), merenskyite (PdTe2), sopcheite (Ag4Pd3Te4), telargpalite ((Pd,Ag)3(Te,Pb)), hessite (Ag2Te), naldrettite (Pd2(Sb,Sn)), froodite (PdBi2), unnamed (Pd2Te), (Pd2CuTeBi) and ((Pd,Ag)2Te). They represent 0.5% of the total precious metal paragenesis in this study (Fig. 31).
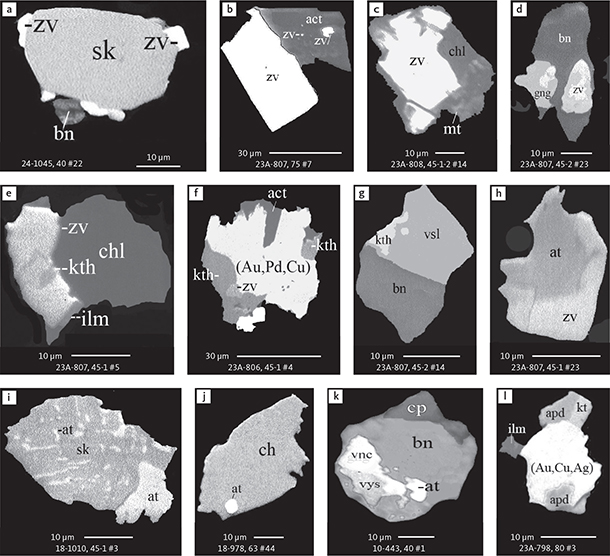
Fig. 30 BSE images of Pd, Cu and Ag intermetallic compounds with Pb, Te, Sn, Sb and Bi in polished monolayer thin sections of HS concentrates. Zvyagintsevite (Pd3Pb) is the dominant Pd phase in samples from the eastern margin, commonly in association with actinolite. Table 3 provides formulae for the precious metal minerals. Formulae for common rock-forming minerals and base metal sulphides are found in Appendix 1. Abbreviated names of minerals, compounds and alloys are as follows: zv: zvyagintsevite. kth: keithconnite. kt: kotulskite. vnc: vincentite. gng: guanglinite (obsolete and renamed to vincentite). apd: arsenopalladinite. at: atokite. sk: skaergaardite. vys: vysotskite. vsl: vasilite. (Au,Pd,Cu) and (Au,Cu,Ag): alloys Au, Cu and Pd. bn: bornite. cp: chalcopyrite. ch: chalcocite. ilm: ilmenite. mt: magnetite. act: actinolite. chl: chlorite. Grain numbers and scales included in the images.
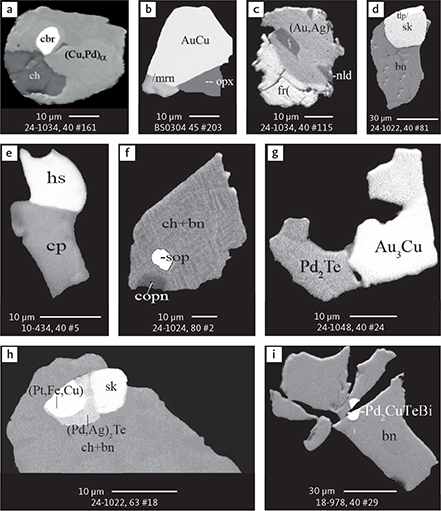
Fig. 31 BSE images of rare intermetallic compounds of precious metals in polished monolayer thin sections of HS concentrates. The rare occurrence of these phases illustrates parageneses buffered by very localised geochemical conditions. Table 3 provides formulae for the precious metal minerals. Formulae for common rock-forming minerals and base metal sulphides are found in Appendix 1. Formulae are given here for rare minerals that are not listed in Table 3 or Appendix 1. Abbreviated names of minerals, compounds and alloys are as follows: cbr: cabriite (Pd2CuSn). mrn: merenskyite (PdTe2). nld: naldrettite (Pd2(Sb,Sn)). tlp: telargpalite ((Pd, Ag)3Te). hs: hessite (Ag2Te). sop: sopcheite (Ag4Pd3Te4). fr: froodite (PdBi2). Pd2Te, (Pd,Ag)2Te and Pd2CuTeBi: unnamed compounds. sk: skaergaardite. AuCu: tetra auricupride. (Cu,Pd)α: unnamed compound. (Au,Ag): native gold. Au3Cu: unnamed compond. (Pt,Fe,Cu): alloy of Pt, Fe and Cu. bn: bornite. cp: chalcopyrite. copn: cobaltian pentlandite. ch: chalcocite. opx: orthopyroxene. Grain numbers and scales included in the images.
Intermetallic compounds of Pd, Cu, and Ag with Pb, Te and Sn are found in all mineralisation levels. They are common in the samples from the marginal part of the intrusion, for example in drill core 90-23A, samples 23A-808 and 807 where they reach 69% and 60% respectively (Nielsen et al. 2003b, e) . They reach 35% in sample 10-443 from the sulphide dominated drill core 90-10 (Rudashevsky et al. 2012d). They are rare in the centre of the mineralisation (<1.5%; Fig. 10). The Te phases show a stratigraphic variation from keithconnite, typical for Pd5, to Te-rich kotulskite, merenskyite and non-stoichiometric (Pd,Cu,Sn,Pb,Te) alloys in the Au-rich Pd1/Au levels of central drill cores.
Zvyagintsevite (Pd3Pb) dominates in samples from mineralisation level Pd5 of drill core 90-23A from near the eastern margin at the Palaeogene lavas. In the lower part of Pd5, zvyagintsevite accounts for 73% of the precious metal paragenesis and forms crystals up to 69 μm in size (Nielsen et al. 2003e). It is closely associated with individual grains of keithconnite (Pd3-xTe) and atokite (Pd3Sn), with Pd sulphides and arsenides, as well as with (Au,Cu,Ag,Pd) alloys in aggregates with Cu-Fe sulphides and H2O-bearing minerals including biotite, actinolite, chlorite and talc (Figs 26o, 27p, 30b–d, h). In Pd5 samples from central parts of the mineralisation, zvyagintsevite, occurs as rare and small grains <10 μm. They nucleated on skaergaardite (PdCu) globules in association with vasilite (Pd16S7) and vysotskite (PdS; Fig. 19d). Like all other precious metal minerals, these intermetallic compounds show compositional variations that reflect the local geochemical environment. The variation in compositions and the average for a total of 145 grains of zvyagintsevite from all studied samples are found in Table 16, for 63 analyses of keithconnite and 13 analyses of kotulskite in Table 17, for 14 analyses of atokite and 5 of cabriite (Pd2CuSn) in Table 18 and rare intermetallic compounds in Table 19.
| Sample no. | Grain no. | Type | Pd | Pt | Au | Cu | Fe | Sn | Te | Pb | As | Sum | |
| 23А-808 | 45/1#11 | ‘Pure’ a | wt% | 60.5 | n.d. | n.d. | n.d. | n.d. | n.d. | n.d. | 39.1 | n.d. | 99.6 |
| prop. | 3.00 | - | - | - | - | - | - | 1.00 | - | 4.00 | |||
| 23A-808 | 45/1#41 | Pt | wt% | 56.6 | 6.8 | n.d. | n.d. | 0.7 | 2.8 | n.d. | 31.9 | n.d. | 98.8 |
| prop. | 2.81 | 0.18 | - | - | 0.07 | 0.12 | - | 0.81 | - | 4.00 | |||
| 23A-807 | 45/2#67 | Au | wt% | 52.6 | n.d. | 9.4 | 0.9 | n.d. | n.d. | n.d. | 33.8 | 1.3 | 98.0 |
| prop. | 2.68 | - | 0.26 | 0.08 | - | - | - | 0.89 | 0.09 | 4.00 | |||
| BS0301 | 75/2#16 | Cu | wt% | 55.6 | n.d. | n.d. | 3.6 | 0.6 | n.d. | n.d. | 40.7 | n.d. | 100.5 |
| prop. | 2.66 | - | - | 0.28 | 0.06 | - | - | 1.00 | - | 4.00 | |||
| 23A-806 | 45/1#28 | Zone 1 | wt% | 57.0 | 2.5 | 1.6 | n.d. | 0.7 | 2.2 | n.d. | 35.5 | n.d. | 99.5 |
| prop. | 2.82 | 0.07 | 0.04 | - | 0.07 | 0.10 | - | 0.90 | - | 4.00 | |||
| 23A-806 | 45/1#28 | Zone 2 | wt% | 55.4 | n.d. | n.d. | n.d. | 9.2 | n.d. | 9.9 | 20.8 | 4.6 | 99.9 |
| prop. | 2.24 | - | - | - | 0.71 | - | 0.34 | 0.44 | 0.27 | 4.00 | |||
| 23A-808 | 45-1#28 | Sn | wt% | 62.4 | 1.2 | 3.2 | n.d. | n.d. | 10.4 | n.d. | 22.0 | n.d. | 99.2 |
| prop. | 2.91 | 0.03 | 0.08 | - | - | 0.44 | - | 0.53 | - | 4.00 | |||
| 23A-808 | 45-1#15 | As | wt% | 66.4 | n.d. | n.d. | n.d. | 1.2 | n.d. | n.d. | 23.6 | 7.5 | 98.7 |
| prop. | 2.90 | - | - | - | 0.10 | - | - | 0.53 | 0.47 | 4.00 | |||
| Multiple | ave. of 145 grains | wt% | 58.2 | 0.8 | 1.0 | 0.2 | 0.5 | 0.4 | 0.2 | 37.3 | 0.2 | 99.4 | |
| prop. | 2.90 | 0.02 | 0.03 | 0.02 | 0.04 | 0.02 | 0.01 | 0.95 | 0.02 | 4.00 | |||
| SD | 2.51 | 1.33 | 1.68 | 0.51 | 0.85 | 1.50 | 1.29 | 5.10 | 1.04 | - | |||
| a Close to empirical formula Pd3Pb. ave.: average. prop.: atomic proportion. SD: standard deviation. n.d.: not detected. - indicates no data. | |||||||||||||
| Sample no. | Grain no. | Type | Pd | Pt | Au | Cu | Fe | Sn | Te | Pb | As | Sb | Bi | Sum | |
| Keithconnite Pd3-x(Te,Sn,Pb) | |||||||||||||||
| BS0304 | 45#240 | ‘Pure’ a | wt% | 63.0 | n.d. | n.d. | 1.2 | 0.6 | n.d. | 32.4 | 1.1 | n.d. | n.d. | n.d. | 98.3 |
| prop. | 2.69 | - | - | 0.09 | 0.05 | - | 1.15 | 0.02 | - | - | - | 4.00 | |||
| 23A-806 | 45/2#7 | Au | wt% | 62.8 | n.d. | 2.6 | n.d. | 0.7 | n.d. | 28.8 | 4.9 | n.d. | n.d. | n.d. | 99.8 |
| prop. | 2.73 | - | 0.06 | - | 0.06 | - | 1.04 | 0.11 | - | - | - | 4.00 | |||
| 18-1012 | 125#1 | Cu | wt% | 63.6 | n.d. | n.d. | 5.0 | n.d. | n.d. | 30.1 | 1.4 | n.d. | n.d. | n.d. | 100.1 |
| prop. | 2.60 | - | - | 0.34 | - | - | 1.03 | 0.03 | - | - | - | 4.00 | |||
| 18-958 | 40#5 | Pb | wt% | 60.6 | n.d. | n.d. | 1.1 | 1.1 | n.d. | 29.2 | 6.4 | n.d. | n.d. | n.d. | 98.4 |
| prop. | 2.63 | - | - | 0.08 | 0.09 | - | 1.06 | 0.14 | - | - | - | 4.00 | |||
| 18-972 | 40#30 | Sn | wt% | 70.2 | n.d. | n.d. | n.d. | 1.6 | 7.0 | 16.6 | n.d. | 3.8 | n.d. | n.d. | 99.3 |
| prop. | 2.84 | - | - | - | 0.13 | 0.25 | 0.56 | - | 0.22 | - | - | 4.00 | |||
| 23A-806 | 45/1#26 | As | wt% | 69.2 | n.d. | n.d. | n.d. | 0.6 | n.d. | 15.8 | 6.3 | 6.2 | n.d. | n.d. | 98.1 |
| prop. | 2.90 | - | - | - | 0.05 | - | 0.55 | 0.37 | 0.37 | - | - | 4.00 | |||
| 23A-808 | 45/1#20 | As-Pb-Sb | wt% | 68.5 | n.d. | n.d. | n.d. | 0.6 | n.d. | 15.7 | 4.7 | 6.4 | 2.6 | n.d. | 98.1 |
| prop. | 2.84 | - | - | - | 0.05 | - | 0.54 | 0.10 | 0.38 | 0.09 | - | 4.00 | |||
| Multiple | ave. of 63 grains | wt% | 67.9 | 0.0 | 0.2 | 0.5 | 0.5 | 0.9 | 25.8 | 2.1 | 1.1 | - | - | 99.2 | |
| prop. | 2.86 | 0.00 | 0.01 | 0.04 | 0.04 | 0.03 | 0.91 | 0.05 | 0.07 | - | - | 4.00 | |||
| SD | 2.77 | 0.13 | 0.84 | 1.03 | 0.42 | 1.53 | 5.23 | 2.35 | 2.36 | - | - | - | |||
| Kotulskite Pd(Te,Pb,Bi) | |||||||||||||||
| 10-434 | 40/2#5 | Au | wt% | 40.4 | n.d. | 6.2 | n.d. | n.d. | n.d. | 52.5 | n.d. | n.d. | n.d. | n.d. | 99.1 |
| prop. | 0.92 | - | 0.08 | - | - | - | 1.00 | - | - | - | - | 2.00 | |||
| 23A-806 | 75/1#6 | Pb | wt% | 42.8 | n.d. | n.d. | 0.4 | 1.1 | n.d. | 52.0 | 3.1 | n.d. | n.d. | n.d. | 99.4 |
| prop. | 0.95 | - | - | 0.01 | 0.05 | - | 0.96 | 0.04 | - | - | - | 2.00 | |||
| 23A-798 | 63#2 | Bi | wt% | 42.5 | n.d. | n.d. | n.d. | n.d. | n.d. | 48.2 | n.d. | n.d. | n.d. | 9.1 | 99.8 |
| prop. | 1.00 | - | - | - | - | - | 0.92 | - | - | - | 0.08 | 2.00 | |||
| Multiple | ave. of 13 grains | wt% | 43.6 | n.d. | 1.2 | 0.1 | 0.2 | n.d. | 53.1 | 0.2 | n.d. | n.d. | 1.2 | 99.6 | |
| prop. | 0.97 | - | 0.01 | 0.00 | 0.01 | - | 0.99 | 0.00 | - | - | 0.01 | 2.00 | |||
| SD | 1.76 | - | 2.25 | 0.12 | 0.39 | - | 2.31 | 0.80 | - | - | 2.92 | - | |||
| a Close to empirical formula Pd3-xTe. ave.: average. prop.: atomic proportions. SD: standard deviation. n.d.: not detected. - indicates no data. | |||||||||||||||
| Sample no. | Grain no. | Type | Pd | Pt | Au | Cu | Fe | Sn | Te | Pb | As | Sb | Sum | |
| 10-445 | 40/2#1 | ‘Pure’ a | wt% | 72.9 | n.d. | n.d. | n.d. | n.d. | 26.7 | n.d. | n.d. | n.d. | n.d. | 99.6 |
| prop. | 3.01 | - | - | - | - | 0.99 | - | - | - | - | 4.00 | |||
| 10-443 | 40#33 | Pt-As | wt% | 61.7 | 16.6 | n.d. | n.d. | n.d. | 14.2 | n.d. | n.d. | 7.3 | n.d. | 99.8 |
| prop. | 2.63 | 0.39 | - | - | - | 0.54 | - | - | 0.44 | - | 4.00 | |||
| 10-443 | 40#11 | Au-Pb | wt% | 66.2 | 2.1 | 3.8 | n.d. | n.d. | 24.1 | n.d. | 3.3 | n.d. | n.d. | 99.5 |
| prop. | 2.86 | 0.05 | 0.09 | - | - | 0.93 | - | 0.07 | - | 4.00 | ||||
| 23A-806 | 45/2#25 | Au-As-Te | wt% | 69.2 | n.d. | 2.6 | n.d. | 0.5 | 14.5 | 3.0 | n.d. | 6.9 | 2.1 | 99.2 |
| prop. | 2.80 | - | 0.06 | - | 0.04 | 0.53 | 0.10 | - | 0.40 | 0.07 | 4.00 | |||
| 10-443 | 40/2 | Pb | wt% | 65.8 | n.d. | n.d. | n.d. | 0.7 | 13.1 | n.d. | 19.8 | n.d. | n.d. | 99.4 |
| prop. | 2.96 | - | - | - | 0.06 | 0.53 | - | 0.46 | - | - | 4.00 | |||
| Multiple | ave. of 14 grains | wt% | 68.1 | 2.8 | 0.8 | 0.4 | 0.2 | 21.2 | 0.2 | 3.9 | 1.6 | 0.2 | 99.3 | |
| prop. | 2.88 | 0.06 | 0.02 | 0.05 | 0.02 | 0.80 | 0.01 | 0.09 | 0.09 | 0.01 | 0.99 | |||
| SD | 3.58 | 4.81 | 1.38 | 0.64 | 0.36 | 5.49 | 0.80 | 6.91 | 2.90 | 0.56 | - | |||
| Multiple | ave. of 5 grains | wt% | 53.7 | n.d. | n.d. | 17.5 | 0.7 | 27.3 | 0.3 | 0.2 | n.d. | n.d. | 99.7 | |
| prop. | 1.96 | - | - | 1.08 | 0.05 | 0.90 | 0.01 | - | - | - | 4.00 | |||
| SD | 1.15 | - | - | 0.71 | 0.45 | 2.76 | 0.58 | 0.40 | - | - | - | |||
| a Close to empirical formula Pd3Sn. ave.: average. prop.: atomic proportions. SD: standard deviation. n.d.: not detected. - indicates no data. | ||||||||||||||
| Sample no. | Grain no. | Type | Pd | Pt | Au | Cu | Fe | Sn | Te | Pb | As | Sb | Sum | |
| Arsenopalladinite Pd8As3 | ||||||||||||||
| 10-434 | 40#8 | ’Pure’ a | wt% | 77.0 | n.d. | n.d. | 0.7 | 0.7 | n.d. | n.d. | n.d. | 21.0 | n.d. | 99.4 |
| prop. | 7.75 | - | - | 0.12 | 0.13 | - | - | - | 3.00 | - | 11.00 | |||
| 23A-798 | 40#2 | Au-Sn | wt% | 69.7 | n.d. | 6.9 | 1.4 | n.d. | 5.1 | n.d. | n.d. | 16.8 | n.d. | 99.9 |
| prop. | 7.35 | - | 0.39 | 0.25 | - | 0.49 | - | - | 2.51 | - | 11.00 | |||
| 23A-806 | 45/1#11 | Cu | wt% | 74.7 | n.d. | n.d. | 3.4 | 0.3 | n.d. | n.d. | n.d. | 21.4 | n.d. | 99.8 |
| prop. | 7.37 | - | - | 0.56 | 0.06 | - | - | - | 3.01 | - | 11.00 | |||
| 23A-807 | 45/2#35 | Te-Sn-Sb | wt% | 71.0 | n.d. | n.d. | 1.7 | 0.7 | 6.2 | 8.9 | n.d. | 9.1 | 2.2 | 99.8 |
| prop. | 7.58 | - | - | 0.30 | 0.15 | 0.59 | 0.80 | - | 1.38 | 0.20 | 11.00 | |||
| Multiple | ave. of 67 grains | wt% | 73.6 | n.d. | 1.7 | 1.7 | 0.6 | 2.0 | 0.2 | n.d. | 19.6 | 0.1 | 99.4 | |
| prop. | 7.48 | - | 0.09 | 0.29 | 0.11 | 0.18 | 0.02 | - | 2.83 | 0.01 | 11.00 | |||
| SD | 2.90 | - | 2.26 | 1.11 | 0.45 | 0.15 | 2.15 | - | 2.20 | 0.10 | - | |||
| Palladoarsenite Pd2As | ||||||||||||||
| 18-972 | 80#2 | ‘Pure’ b | wt% | 71.8 | n.d. | n.d. | 1.2 | 0.4 | n.d. | n.d. | n.d. | 26.0 | n.d. | 99.4 |
| prop. | 1.93 | - | - | 0.05 | 0.02 | - | - | - | 0.99 | - | 3.00 | |||
| 10-434 | 40/2#1 | Pt | wt% | 59.7 | 12.4 | n.d. | 1.8 | 1.0 | n.d. | n.d. | n.d. | 24.5 | n.d. | 99.4 |
| prop. | 1.69 | 0.19 | - | 0.08 | 0.05 | - | - | - | 0.98 | - | 3.00 | |||
| 23A-808 | 40/1#17 | Cu-Fe | wt% | 65.8 | n.d. | n.d. | 4.6 | 2.3 | n.d. | n.d. | n.d. | 27.0 | n.d. | 99.7 |
| prop. | 1.70 | - | - | 0.20 | 0.11 | - | - | - | 0.99 | - | 3.00 | |||
| Multiple | ave. of 6 grains | wt% | 67.2 | 3.9 | n.d. | 1.8 | 0.9 | 0.6 | n.d. | 0.4 | 24.7 | n.d. | 99.5 | |
| prop. | 1.84 | 0.06 | - | 0.08 | 0.04 | 0.02 | - | 0.01 | 0.96 | - | 3.00 | |||
| SD | 6.32 | 6.03 | - | 1.78 | 0.73 | 1.47 | - | 0.90 | 1.68 | - | - | |||
| a Close to empirical formula Pd8As3. b Close to empirical formula Pd2As. prop.: atomic proportions. SD: standard deviation. n.d.: not detected. - indicates no data. | ||||||||||||||
| Sample no. | Grain no. | Type | Pd | Pt | Au | Cu | Ni | Fe | Sn | Te | Pb | As | Sb | Sum | |
| Vincentite/Guanglinite Pd3As | |||||||||||||||
| 10-445 | 40/1#2 | ‘Pure’ a | wt% | 81.5 | n.d. | n.d. | n.d. | n.d. | n.d. | n.d. | n.d. | n.d. | 18.8 | n.d. | 100.3 |
| prop. | 3.01 | - | - | - | - | - | - | - | - | 0.99 | - | 4.00 | |||
| 10-443 | 40#33 | Pt | wt% | 74.7 | 4.6 | n.d. | n.d. | n.d. | 0.6 | 3.1 | n.d. | n.d. | 16.4 | n.d. | 99.4 |
| prop. | 2.86 | 0.10 | - | - | - | 0.04 | 0.11 | - | - | 0.89 | - | 4.00 | |||
| 23A-806 | 45/1#7 | Au-Sn | wt% | 69.7 | n.d. | 6.7 | 1.0 | - | 0.6 | 4.5 | n.d. | n.d. | 16.1 | n.d. | 98.6 |
| prop. | 2.71 | - | 0.14 | 0.07 | - | 0.04 | 0.16 | - | - | 0.89 | - | 4.00 | |||
| 18-988 | 40#7 | Cu-Te-Pb | wt% | 68.2 | n.d. | n.d. | 4.1 | n.d. | 0.7 | n.d. | 11.8 | 6.4 | 8.1 | n.d. | 99.3 |
| prop. | 2.70 | - | - | 0.27 | - | 0.05 | - | 0.39 | 0.13 | 0.45 | - | 4.00 | |||
| 10-443 | 70#4 | Sn | wt% | 78.4 | n.d. | n.d. | n.d. | n.d. | n.d. | 7.7 | n.d. | n.d. | 13.6 | n.d. | 99.7 |
| prop. | 3.00 | - | - | - | - | - | 0.26 | - | - | 0.74 | - | 4.00 | |||
| 23A-808 | 45/1#51 | Pb | wt% | 70.3 | n.d. | n.d. | n.d. | n.d. | 0.4 | n.d. | 2.8 | 19.1 | 7.2 | n.d. | 99.8 |
| prop. | 3.01 | - | - | - | - | 0.03 | - | 0.10 | 0.42 | 0.44 | - | 4.00 | |||
| 23A-808 | 45/1#18 | Sb | wt% | 75.2 | n.d. | n.d. | 1.0 | n.d. | 0.3 | n.d. | n.d. | n.d. | 12.1 | 11.0 | 99.6 |
| prop. | 2.88 | - | - | 0.07 | - | 0.02 | - | - | - | 0.66 | 0.37 | 4.00 | |||
| Multiple | ave. of 64 grains | wt% | 76.0 | 0.3 | 0.3 | 0.6 | n.d. | 0.5 | 2.6 | 1.7 | 1.6 | 14.9 | 0.4 | 98.8 | |
| prop. | 2.91 | 0.01 | 0.01 | 0.04 | - | 0.04 | 0.09 | 0.06 | 0.04 | 0.80 | 0.01 | 4.00 | |||
| SD | 4.12 | 1.45 | 2.10 | 1.26 | - | 0.48 | 2.63 | 4.73 | 6.07 | 4.62 | 3.47 | - | |||
| Isomertieite (Pd,Cu)11As2(Sb,Sn)2 | |||||||||||||||
| Multiple | ave. of 15 grains | wt% | 71.4 | 0.3 | 0.4 | 1.8 | n.d. | 1.0 | 1.1 | 1.2 | n.d. | 9.5 | 12.6 | 99.4 | |
| prop. | 10.38 | 0.02 | 0.02 | 0.45 | - | 0.27 | 0.13 | 0.15 | - | 1.97 | 1.61 | 15.00 | |||
| SD | 1.79 | 0.67 | 0.58 | 0.91 | - | 0.97 | 1.79 | 1.93 | - | 0.49 | 2.42 | - | |||
| Majakite PdNiAs | |||||||||||||||
| 22-977 | 125#1 | wt% | 44.3 | n.d. | n.d. | n.d. | 24.5 | 0.7 | n.d. | n.d. | n.d. | 30.5 | n.d. | 100.0 | |
| prop. | 1.00 | - | - | - | 1.00 | 0.03 | - | - | - | 0.98 | - | 3.00 | |||
| Unnamed Pd11As2Sn2 | |||||||||||||||
| 10-445 | 40/2#1 | wt% | 75.3 | n.d. | n.d. | n.d. | n.d. | n.d. | 14.6 | n.d. | n.d. | 9.5 | n.d. | 99.0 | |
| prop. | 11.09 | - | - | - | - | - | 1.93 | - | - | 1.99 | - | 15.00 | |||
| a Close to empirical formula Pd3 As. prop.: atomic proportions. ave.: average. SD: standard deviation. n.d.: not detected. - indicates no data. | |||||||||||||||
Atokite (Pd3Sn) is associated to zvyagintsevite (Figs 19g, 30h–j), but is rare, especially in drill cores (90-23A, 0.2% of the paragenesis; Table 3). Keithconnite (Pd3-xTe) is found in 25 out of the 30 samples of this study, but only in very small proportions (0.5% of all PGE and Ag-Au minerals; Table 3). Keithconnite was not found in the samples from the Au-rich Pd1/Au mineralisation level from the centre of the intrusion.
Keithconnite (Pd3-xTe) forms irregular grains on skaergaardite usually <10 μm, but up to 25 μm in size (Fig. 19b–d, k). It is closely associated with Au minerals, such as tetra-auricupride, unnamed (Au3Cu) and (Au,Cu,Pd,Ag) alloys, zvyagintsevite atokite, vysotskite, vasilite and Pd-arsenides (Figs 19j, k, 25h, 26c, d, o, 27l, p, 30e–g). Keithconnite is also associated with Cu-Fe sulphides, and is observed in drill cores near the margins, commonly also associated to or intergrown with hydrous minerals, such as actinolite, talc and chlorite (Figs 27l, p, 30e, f).
4.3.6 Arsenides of Pd, Pt and Ni
Arsenides of Pd, Pt and Ni represent c. 2.1% of all precious metal minerals of the mineralisation (Table 3, rows 33–38). The arsenide grains have irregular outlines and are 10–20 μm in size. The largest grain has an ECD of 69 μm (sperrylite in Table 3). In general, they are associated with the Pd minerals zvyagintsevite, keithconnite, atokite and kotulskite, the Pd sulphides vysotskite and vasilite, the Au minerals (Au,Cu,Ag,Pd) alloys, unnamed Au3Cu, tetra-auricupride, rare native gold, Cu-Fe sulphides and hydrous silicates, such as biotite, hornblende, actinolite and talc (Figs 20h–l, 24j, 25d, j, 26f–j, n, 27f, 30d, k, l, 32). In some cases, vincentite forms rims to zvyagintsevite (Fig. 30d).
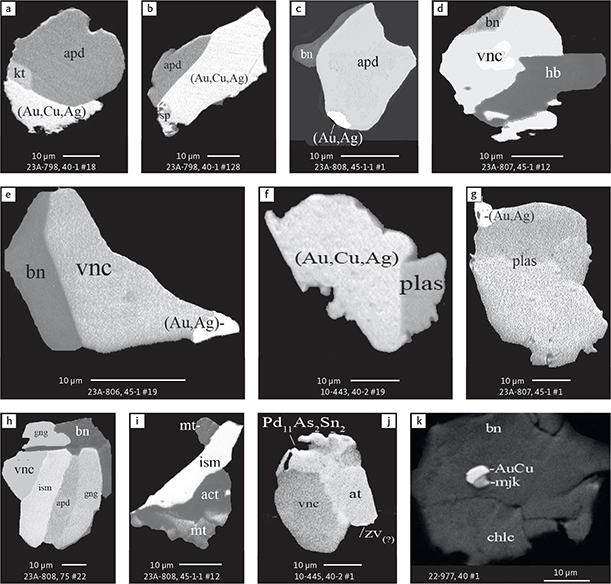
Fig. 32 BSE images of PGE arsenides in polished monolayer thin sections of HS concentrates. As for the intermetallic compounds (see text and Fig. 31), arsenides are related to a wide range of precious metal phases and sulphides, while local geochemical balances control the parageneses. Table 3 provides formulae for the precious metal minerals. Formulae for common rock-forming minerals and base metal sulphides are found in Appendix 1. Formulae are given here for rare minerals or compositional varieties that are not listed in Table 3 or Appendix 1. Abbreviated names of minerals, compounds and alloys are as follows: apd: arsenopalladinite/stillwaterite (Pd8As3). kt: kotulskite. sp: sperrylite. vnc: vincentite. gng: guanglinite (obsolete and renamed to vincentite). plas: palladoarsenide. ism: isomertiete (Pd11As2(Sb,Sn)2). mjk: majakite. zv: zvyagintsevite. at: atokite. Pd11As2Sn2: unnamed compound. AuCu: tetra-auricupride. (Au,Cu,Ag): alloys dominated by Au and Cu. (Au,Ag): native gold. bn: bornite. chlc: chalcocite. hb: hornblende. act: actinolite. mt: magnetite. Grain numbers and scales included in the images.
Arsenopalladinite (Pd8As3) represents 1%, followed by vincentite ((Pd,Pt)3(As,Sb,Te)) with 0.9% (Table 3). The identification of arsenopalladinite is based on optical properties and EMP analysis only. Rare sperrylite (PtAs2) accounts for 0.07% and palladoarsenide (Pd2As) 0.06% of all precious metal phases (Table 3). A few grains of isomertieite (Pd11As2(Sb,Sn)2), majakite (PdNiAs) and unnamed Pd11As2(Sn,Sb)2 were also recorded. Representative compositions of the arsenides and their average compositions are listed in Tables 20 and 21 and include data from 67 grains of arsenopalladinite, 6 grains of palladoarsenide, 64 grains of vincentite, 5 grains of isomertieite, a single grain of majakite and one of unnamed Pd11As2(Sn,Sb)2.
5 Discussion: constraints for the mineralisation model
Orthomagmatic origins were advocated for the Skaergaard PGE-Au Mineralisation by Andersen et al. (1998), Nielsen et al. (2005), Holwell & Keays (2014), Holwell et al. (2015, 2016) and Keays & Tegner (2016). The proposed models assume fractionation and enrichment in precious metals, Cu and S until sulphide saturation was reached and led to gravitational accumulation of sulphide melt with precious metals in the intermittent floor of the magma chamber. The sulphide – precious metal paragenesis subsequently re-equilibrated during cooling. Existing models are, among others, inspired by the Merensky Reef of the Bushveld Complex (Naldrett 2004).
A more complex but nevertheless comparable gravitational model involves a first stage of crystallisation and fractionation below the roof of the magma chamber, scavenging of precious metals by immiscible sulphide melt in crystal mush, followed by dissolution in dense Fe-rich immiscible silicate melts and slumping to the floor (Nielsen et al. 2015). The difference between this and the classic model is that the first stage of sulphide saturation occurs in evolved mush melt below the roof of the intrusion rather than in contemporary and lesser evolved bulk melt.
In the floor mush, gravitational sorting resulted in macrorhythmic layers with stratigraphic concentrations of mush melt in which fractionation once again led to sulphide saturation and concentration of precious metals and subsequently to reaction with residual and immiscible Fe-rich mush melt. The reactions led to very high precious metal to Cu ratios and transport of precious metals in upwardly-migrating mush melts (Nielsen et al. 2015).
A third model (e.g. Wernette et al. 2020) argued for scavenging of precious metals by upwardly-migrating fluids and possibly residual silicate melt (Boudreau 2004) from precious metal–bearing interstitial sulphides deep in already crystallised gabbros of the intrusion. This later model was developed for the J-M Reef in the Stillwater Igneous Complex (Boudreau et al. 1986).
The models are very different, but all revolve around the timing of crystallisation processes relative to the loss of residual mush melts, the timing of sulphide saturation, the permeability of the gabbroic mush and the role of free volatile phases for transport and deposition of precious metals, especially Au. The three model types can be simplified to a downward accumulation model, a dissolution and upward accumulation model, and the model by Nielsen et al. (2015) that combines the two contrasting models into two successive stages. A first concentration of precious metals in the floor was caused by slumping of enriched crystal mushes that originated from under the roof of the magma chamber. This was followed by a second stage of fractionation and deposition of precious metals in upwardly-migrating mush melts of the macrorhythmic layers.
In the following sections, we constrain the precious metal composition of the remaining bulk liquid at sulphide saturation, the temperatures and the relative timing of the processes that led to the now observed mineralisation. The discussion is based on an integration of the stratigraphic and temporal relationships presented in Nielsen et al. (2015, 2019a), and the summaries of petrography and compositions of sulphides and precious metal phases of the Skaergaard PGE-Au Mineralisation presented here.
5.1 Concentrations of PGE and Au in the magma at sulphide saturation
A high FeO total (FeO*) in the remaining bulk liquid ensured that precious metals were retained until sulphide saturation. The formation of the Skaergaard PGE-Au Mineralisation was delayed until upper MZ crystalised, when three quarters of the bulk magma had solidified (Nielsen 2004; Andersen 2006). Exceptions are observed halfway up MZ due to local sulphur saturation in mushes and in reaction with rafts of roof rocks or other lithic inclusions (e.g. Bird et al. 1991; Nielsen et al. 2015).
The composition of plagioclases in equilibrium with the sulphides of the mineralisation corresponds to plagioclase in UZa gabbros, when 18% (F-value 0.18) of the bulk liquid remained (Nielsen et al. 2019a). The macrorhythmic layers that host the mineralisation in the upper MZ, however, formed when 27% (F-value 0.27) of the volume of the bulk magma remained (Nielsen et al. 2015). This discrepancy supports that sulphide saturation occurred in the crystal mush.
The mush formed below the roof of the intrusion, and was enriched in PGEs, Au, dense phases (pyroxene, magnetite and ilmenite) and immiscible Fe-rich silicate melt (formed at F = 0.1; Nielsen et al. 2015). Convection carried the dense mush to the floor and built the succession of macrorhythmic layers that now host the mineralisation. This crystallisation and mineralisation model was fully developed by Nielsen et al. (2015, 2019a), while Nielsen et al. (2019b) modelled the corresponding evolution of the bulk liquid in the intrusion.
In upper MZ, sulphide saturation in the mushes of proto-macrorhythmic layers would therefore have taken place after crystallisation of approximately one third of the bulk composition of material in the macro-layers, while F decreased from 0.27 to 0.18. The residual melt in the crystal mush of the proto-macrorhythmic layers would, due to the density contrasts between solids and melts (i.e. plagioclase floats in the silicate melt; Nielsen et al. 2019b), be concentrated in the lower part of the plagioclase layers that forms the tops of the proto-macrorhythmic layers (Nielsen et al. 2015).
Ideally, and assuming no loss of Cu or precious metals, the remaining bulk liquid would at this stage have FeO* c. 22 wt%, Pt 10 ppb, Pd 63 ppb, and Au 42 ppb at 27% remaining bulk liquid (Nielsen et al. 2019b). The mush melt would reach sulphide saturation after crystallisation of one third of its volume and ideally contain Pt c. 15 ppb, Pd 94 ppb and Au 63 ppb. These elemental concentrations apply only to the melts in mushes below the roof of the intrusions from where precious metals were fed to the floor (Nielsen et al. 2015). The relative proportions between crystal mush residing at the intermittent floor and new mush descending from the roof of the magma chamber are not constrained. It is therefore at present not possible to estimate the compositions of mush melt and the thickness of the mush at the floor. Thicknesses of mush between a few metres and >100 m are estimated in Holness et al. (2017) and apparently vary across the intermittent floor of the magma chamber.
5.2 Constraints on the timing and temperature of sulphide saturation
The mineralisation is hosted in gabbros in the upper 100 m of MZ. Based on the stratigraphic height in the LS and following Thy et al. (2013), these gabbros would have crystallised at temperatures between 1030 and 1050°С. This temperature estimate is based on the correlation between the composition of liquidus plagioclase and temperatures on the LLD (Liquid Line of Descent) of the bulk liquid (Thy et al. 2013). Another constraint on the relative timing of the mineralisation is the correlation between Pd5, the main PGE mineralisation level, gabbros rich in ilmenite and Ti-magnetite and a high plagioclase to clinopyroxene ratio (plag/px) of c. 2 (Nielsen et al. 2015). This concentration of the liquidus phases with the highest and lowest densities in the one and the same concordant cumulus layer is at first enigmatic. Nielsen et al. (2015) suggested that plagioclase is on the liquidus in the contemporary bulk liquid, and that Fe and Ti-rich paragenesis crystallised from immiscible Fe-rich interstitial silicate melt left behind in the layer. Crystallisation from contrasting melt compositions is evidenced by resorption and replacements of plagioclase by symplectites at contacts with anhedral FeTi oxides (fig. 6 in Nielsen at al. 2015). This is supported by the presence of large euhedral apatite crystals (in fig. 5e in Nielsen et al. 2015) inside anhedral magnetite, reaction rims and symplectites adjacent to the liquidus clinopyroxene and resorbed plagioclase (see fig. 6 in Nielsen et al. 2015). These petrographic relations show that the anhedral magnetites crystallised from highly evolved mush melts comparable to the bulk liquid at the base of UZb (F = 0.1).
The upward density-controlled layering in precious metal–rich macrorhythmic layers (Nielsen et al. 2015) includes from base to top: (1) melanocratic gabbro with increasing plag/px, with or without accumulations of FeTi liquidus crystals; (2) average gabbro; (3) a zone that is high in plag/px, rich in interstitial FeTi oxides, and host to Pd concentrations, for example, Pd5 in ML0; (4) a plagioclase-rich top grading into a high plag/px gabbro that is poor in FeTi oxides at the transition to the overlying macrorhythmic layer (Nielsen et al. 2015). The density stratification is stable, assuming that the plagioclase-rich gabbros with high proportions of FeTi oxide and high plag/px are composed of crystals of liquidus plagioclase and pyroxene that are out of equilibrium with the interstitial Fe-rich silicate melt from which the FeTi oxides crystallised (Nielsen et al. 2019a).
The base of UZb and the ponding of immiscible Fe-rich melts (Nielsen et al. 2019b) occurred at c. 1015°С (Thy et al. 2013). The reaction between the already formed sulphide droplets and interstitial Fe-rich melt in the mushes of the proto-mineralisation would then, assuming the same liquidus temperatures in mush melt, have occurred at c. 1015°C. The temperature interval for sulphide saturation and formation of droplets of sulphide melt would be 35°C at most and may be as little as 15°C.
5.3 Petrographic evidence for an initial high-T origin of the mineralisation
A first orthomagmatic stage in the development of the Skaergaard Cu-Fe sulphides and PGE-Au Mineralisation is evidenced by sulphide droplets hosted in primary ilmenite and pyroxenes of the gabbroic host (Nielsen et al. 2005; Godel et al. 2014; Holwell et al. 2015; Nielsen et al. 2015; Rudashevsky et al. 2015). Numerous droplets of Fe-Cu sulphides have been imaged and analysed (see Fig. 7g–n), some with shapes of negative crystals indicating trapping during the growth of the host (Nielsen et al. 2015). The droplets often contain precious metal minerals and alloys, such as (Pd,Cu) alloys (Fig. 18), Pd sulphides, (Au,Cu) alloys (Fig. 14a, b) and (Cu,Au) alloys (Fig. 24a–j). The presence of droplets of sulphide melt with precious metal grains and crystals was further demonstrated in the HRXCT study of Godel et al. (2014). These sulphide droplets in liquidus phases of the gabbroic host are up to several hundred microns across (Fig. 15), have a sphericity >0.9 and contain grains and crystals of skaergaardite (PdCu) with an average grain size of 19.2 µm from a total of 25 sulphide grains.
The wide distribution of droplets of Cu-Fe sulphide melts and precious metals (Figs 16a–l, 17a–k, m) is exceptional. These polyphase grains of Cu-Fe sulphide, Cu-Fe sulphide with grains of (Cu,Pd) alloys and of (Cu,Pd) alloys occur in primary rock-forming minerals (Figs 6d–g, 7a, b, d) as well as between rock-forming minerals (Figs 6b, c, 7c, e). Similar compositions of (Cu,Pd)β and (Cu,Pd)α alloys are found in free droplets, in intergrowths with skaergaardite (CuPd) and nielsenite (Cu3Pd; Fig. 17), as well as in grains related to Cu-Fe sulphides.
The occurrence of isolated droplets of (Сu,Pd)α alloy and chalcocite in the ilmenite host is critical (Fig. 6f). It demonstrates the formation and presence of more types of sulphide droplets during the crystallisation of the rock-forming minerals. The ratio of sulphide to precious and other metals in droplets and globules varies widely (Fig. 16a–l) and reflects the lack of simple equilibrium with a common bulk silicate liquid. Monomineralic microdroplets of (Pd,Cu)α are also observed in host-rock ilmenite (Fig. 6e) and in (Pd,Cu) alloys within Cu-Fe sulphide droplets in all the precious metal–bearing mineralisation levels (Figs 16c, 17c).
The compositional differences between the Cu-Pd dominated Pd5 in the lowest and central parts of the mineralisation (Table 7) and the Cu-Au dominated upper Au-rich Pd2-Pd1/Au mineralisation levels (Table 11), agree with the decrease in distribution coefficients (D-values) from Pd to Au between sulphide and silicate melts. Consequently, the difference between the Pd5 and Pd2-Pd1/Au levels is consistent with high-temperature, and the magmatic nature of the first-formed sulphide-precious metal paragenesis.
The formation of (Cu,Pd) droplets is a consequence of a Cu-rich and S-poor system with variable ratios of Cu to precious metals (e.g. Karup-Møller et al. 2008). High skaergaardite (PdCu) would crystallise in equilibrium with bornite and a precious metal–rich and very low-S melt with a composition close to that of skaergaardite at T ≥ 900°C (Karup-Møller & Makovicky 1999). The solubility of precious metals in Cu-rich sulphide melts is generally too high to allow nucleation of (Cu,Pd) and (Cu,Au) compounds (Liu & Brenan 2015) and the Skaergaard (Cu,Pd) compounds may have formed from unprotected sulphide droplets subjected to resorption and loss of Cu and S, caused by reaction with interstitial Fe-rich silicate melt in the crystal mush (Nielsen et al. 2015). Primary Pd sulphides, including vysotskite and vasilite, formed at temperatures lower than those of their Cu-Pd microglobule hosts (Fig. 19b, c). The Pd sulphides probably formed by exsolution from the sulphide melt, like the globules themselves.
Constraints on the relative timing of the formation of the precious metal phases and parageneses are provided by the common observation of ‘droplets within a droplet’. For example, droplets of vysotskite and vasilite in bornite, or droplets of pentlandite in chalcopyrite (Fig. 28), as well as grain zonation and exsolution textures. The almost perfect vysotskite-bearing chalcocite-bornite droplet enclosed in primary ilmenite in Fig. 28a illustrates the trapping of a droplet of Cu-rich and Fe-poor sulphide melt while the ilmenite host crystallised from the silicate liquid in the mush of mineralisation level Pd2a in drill core 90-18. Sulphide saturation was reached before the ilmenite grain crystallised in the mush melt of the macrorhythmic layer, and before the remaining bulk liquid had reached sulphide saturation. Figure 28b illustrates the formation of a PGE-rich globule within a bornite grain. It is interpreted to be the result of dissolution and loss of S, Cu and Fe from first-formed sulphide droplets causing enrichment in precious metals and subsequently to exsolution of an immiscible PGE-rich melt from the Cu-rich sulphide melt (see Karup-Møller & Makovicky (1999) and Karup-Møller et al. (2008) for supporting experimental evidence).
The relationships between droplet-like grains of (Au,Cu) alloy (Fig. 24) and Cu-Fe sulphide hosts in which such grains are found (Fig. 23b–e), as well as the unique relationships between sulphide and Cu-Au metallic melts (Fig. 23b–f, i–k) are similar to those observed for (Cu,Pd) alloys and indicate an initial high-T magmatic origin of the observed (Au,Cu) phases. Further support is provided by the coexistence of ordered phases like auricupride (Au3Cu), tetra-auricupride (AuCu), unnamed AuCu3, and non-stoichiometric alloys of (Au,Cu) and (Cu,Au), some of which are zoned (Fig. 25a–g; Table 12) and intergrown (Fig. 25h–j; Table 13). Although they are affected by later low-T exsolutions, they represent the original high-T grains or droplets of (Cu,Au) alloys. Additionally, Cu-Fe sulphides form interstitial aggregates with inclusions of (Cu,Au) alloys between the minerals of the gabbroic host – like those described above – as well as individual grains of the same (Au,Cu) phases (Figs 23a, 27a–j).
The same paragenesis is found throughout the Skaergaard PGE-Au Mineralisation, although with highly variable relative proportions of Cu-Fe sulphides, precious metals and groups of precious metal phases. The diversity of the parageneses and the high variability in the compositions of the precious metal phases negate that they were in equilibrium with a common bulk liquid. Local geochemical conditions controlled the compositions of the preserved paragenesis. But all parageneses formed from parental immiscible high-T sulphide melts that evolved in parallel during cooling and crystallisation of interstitial melts of mineralisation levels in the crystal mush of the intermittent floor of the intrusion.
The liquidus temperatures of non-stoichiometric (Au,Cu,Pd) and (Au,Cu,Ag) alloys (Fig. 33a, b) are estimated to be 1200–1000°C and 1050–970°C, respectively. In these three-phase diagrams, the lowest liquidus temperatures of the copper-dominated (Cu,Au,Ag) alloys with little Pd are <1100°C (labelled “6” in Fig. 33a) compared to the Au-dominated (Au,Cu,Pd) alloys with up to 1200°C (labelled “5” in Fig. 33a). Although the temperatures in Fig. 33 for (Pd,Cu) and (Ag,Cu,Au) alloys are not accurate for more complex natural systems, they do support that these primary alloys formed at magmatic temperatures during the crystallisation of the gabbroic host.
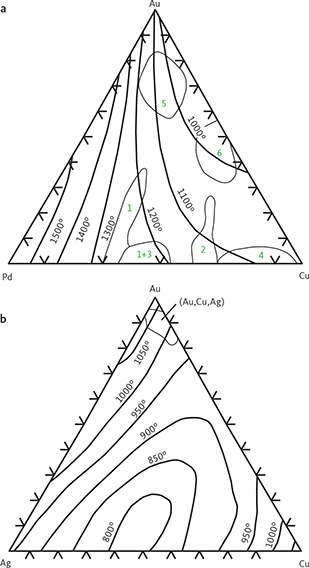
Fig. 33 Phase diagrams showing compositions (wt%) of a: primary Cu, Pd and Au and b: primary alloys of Au, Cu and Ag on experimental liquidus surfaces of the Au-Cu-Pd system (°C; after Savitsky (1984). Compositional fields shown in (a) for the Au-Cu-Pd system are as follows: 1: skaergaardite. 2: nielsenite (Cu3Pd). 3: (Pd,Cu)β alloys. 4: (Cu,Pd)α alloys. 5: (Au,Cu,Pd) alloys. 6: (Au,Cu,Ag) alloys. Compositional field shown in (b) for the Au-Cu-Ag system includes (Au,Cu,Ag) alloys.
5.4 The role of coexisting fluids in the Skaergaard PGE-Au Mineralisation
5.4.1 Evidence for coexisting magmatic fluid
The coexistence of hydrous silicate globules and globules of sulphide with precious metal phases in liquidus FeTi minerals (Fig. 15) shows that the Skaergaard PGE-Au Mineralisation formed in the presence of coexisting silicate melt, sulphide melt and a free, volatile-rich phase (Godel et al. 2014). The silicate globules are, for example, composed of tremolite, hornblende, cummingtonite, pargasite, biotite, talc, albite, quartz and magnetite. Some of the globules contain Au-phases (Holwell et al. 2016). The hydrous silicate globules are in some cases very frequent and more than 30 have been found in a single FeTi oxide grain and represent a noticeable volume (Fig. 15e). The silicate globules have a sphericity >0.95 and diameter 10–190 μm (average 57 μm; Godel et al. 2014) and coexisted with the silicate melt from which their hosts crystallised. The coexistence of silicate and sulphide melts with a free volatile phase is also described for the Norilsk-Talnakh Ni-Cu-PGE mining camp (Barnes et al. 2019).
5.4.2 Nature of the coexisting fluid phase
Gold occurs only in the atomic state Au0 in silicate melt. Due to its siderophile-chalcophile affinity, Au is selectively concentrated in sulphide melt, FeTi oxide or metal fractions in the form of alloys with Au, Cu, Pd, Pt, Ag and Ni. However, Au may exist in several forms in supercritical fluid at T < 1100°C, and, for example, as Au(OH)0 and as Au+ complexes at high temperatures in Fe-rich systems with high Fe2+ activity (e.g. Spiridonov 2010a).
The solubility of Au and Ag is high in coexisting, hydrous, magmatic fluids and leads to their upward transportation during fractional crystallisation. Cl-containing fluids are traditionally seen as transporters of Au at high temperatures in magmatic systems (e.g. Spiridonov 2010a; Zajacz et al. 2013). The presence of Cl in the fluids of gabbros from near the margins of the intrusion is shown by the occurrence of Cl-bearing hornblende with up to 2 wt% Cl (sample 23A-808), Cl-apatite and the copper chloride atacamite (Cu2Cl(OH)3; Fig. 9r) in association with PGEs and bornite and Cl-apatite in gabbros from the centre of the mineralisation. Larsen et al. (1992) and Larsen & Brooks (1994) describe the very common occurrence of fluid inclusions related to lower-T pegmatites. They equilibrated at 770–655°C and at an oxygen fugacity (ƒO2) of 1.5 to 2 log units below the quartz-fayalite-magnetite (QFM) buffer, well below both the temperature (>1000°C) and the QFM buffer at which the mineralisation first formed (Bollingberg 1995). All evidence for low ƒO2 conditions relates to FeTi oxide pairs that recrystallised and re-equilibrated at subsolidus conditions. None of these represent the ƒO2 as precious metals were first deposited in the gabbros.
Hanley et al. (2005) demonstrated that single-phase hypersaline fluids that interact with magmatic liquids and partially crystallised rocks can dissolve and transport significant amounts of Au and Pt. This may well explain the correlation between Pt and Au and low Pd/Pt ratios in the upper Au-rich mineralisation levels, as well as the high Pd/Pt and Pd/Au ratios in the lowermost Pd6–Pd4 mineralisation levels. The latter are caused by the high D-value for Pd in sulphide melt, as well as loss of Au and Pt to upward-migrating residual melts and volatile-rich fluids (Nielsen et al. 2015). Such residual melts in equilibrium with high-T fluids are enriched in Cl, H2O, Te, Se, S and HS–, and metals such as Au, Ag, Pb, Zn, Pd, Sn, Sb and Bi. They stabilise Au complexes with H2O, Cl, Bi-sulphide and arsenide-sulphide compounds, which are all important for transport and ore formation in, for example, volcanogenic and plutonic Au deposits.
Strong correlations between elemental pairs such as Au-As, Au-Te, Au-Se, Au-Bi and Au-Sb, and the high Se and Te in gabbros immediately above the Au-rich mineralisation levels (Holwell & Keays 2014; Holwell et al. 2016; Keays & Tegner 2016) show that telluride and selenide complexes played a leading role in the migration of Au-bearing hydrous residuals just as in epithermal volcanic Au deposits (e.g. Yakich et al. 2021).
Laser Ablation Inductively Coupled Plasma Mass Spectrometry (LA-IСP-MS) analyses of Cu-Fe sulphide blebs from levels Pd6 and Pd5 show anomalous levels of small chalcophile elements, such as Pd, Au, Ag, plus Se (up to c. 650 ppm) and Te (c. 100 ppm; Holwell et al. 2015). The concentrations are much higher in the Au-rich mineralisation levels, with Se and Te reaching 1000 and 1150 ppm, respectively. The high concentrations and the correlations between Au, Te and Se support transport of Au in solution in the form of hetero-polynuclear telluride, selenide and sulphide-arsenide complexes in fluids. This supports the models for transportation and deposition of gold presented in Rudashevsky et al. (2014), Nielsen et al. (2015) and Wernette et al. (2020).
The occurrence and increasing importance of stable metalloid-complexes in the coexisting fluid phase during the formation of the Au-rich mineralisation levels is reflected in the contrasting compositions of skaergaardite (PdCu). The correlation between Au and Te in skaergaardite is +0.38 at the 95% confidence level (Table 5, 1482 analyses in 24 samples) but cannot be crystallochemical as the two elements have different positions in the structure of skaergaardite. A correlation between Au and Te is supported by the factor analysis based on 311 analyses of skaergaardite (PdCu) from Pd5 sample 24-2057 (Fig. 12). The first factor (F1) is Au-Te-Cu and represents the main variation in precious metal paragenesis up through the mineralisation levels from Pd6 to Pd1/Au and Au+1 (Rudashevsky et al. 2004, 2014). The correlations and anticorrelations in these levels corroborate with the factor analysis based on bulk-rock compositions in Nielsen et al. (2019a).
5.4.3 Extent of equilibration with aqueous fluids
Hydrous silicates are very rare in gabbros in the central parts of the intrusion, except for biotite related to FeTi oxides (Holness et al. 2011), although not all residual melt and fluid escaped from the depths of the intrusion (Wernette et al. 2020) or from the mineralised levels. In stark contrast, gabbros closer to the margins (drill cores 90-10 and 90-23A) have hydrous silicate in their matrixes and preserved “paired inclusions” of Si-rich and Fe-rich melt (Holness et al. 2011). They also contain significantly higher proportions of intermetallic precious metal compounds with metalloids and fluid-related elements such as As, Pb, Te and S.
Lateral contrasts are also seen in the proportions of Te- and As-bearing minerals in the Au-rich mineralisation levels (Figs 10, 26a–e). The proportions are lower in the central parts of the mineralisation compared to gabbros nearer the margins of the intrusion. They host the characteristic association of (Au,Cu,Ag) alloys with platinum group arsenides and tellurides (Fig. 26g–j), e.g. in the Au-rich mineralisation level Pd4 in drill cores 90-10 and 90-23A (Nielsen et al. 2005, 2015, 2019a; Rudashevsky et al. 2014). Only a few grains of Au minerals, such as tetra-auricupride (AuCu), and Te minerals, such as keithconnite (Pd3-xTe), can be found in the central parts of the mineralisation. Here, the coexisting fluid that carried volatile components and metalloids was seemingly lost from the mushes. The contrast between central areas and those close to the margins of the intrusion led Nielsen et al. (2015) to suggest trapping of residual silicate melts and a free magmatic volatile phase in the faster-cooled gabbros nearer to the margins. This, however, does not exclude inflow of meteoric water (e.g. Norton & Taylor 1979) through contraction cracks in already crystallised gabbros (Norton et al. 1984; Bird et al. 1986, 1991). These fractures were filled by secondary Ca-rich clinopyroxene amphiboles ranging from actinolite to hornblende, biotite, FeTi oxides and calcic plagioclase (Manning & Bird 1986).
The tendency for larger grains of precious metal phases at ToF may reflect contrasts in the crystallisation environment between the centre and the margins of the intrusion. In addition, and possibly due to loss of permeability during cooling near the walls of the magma chamber, trapped residual melt and fluids formed late veins with small grains of precious metal phases.
5.5 Low-T re-equilibration
Cu-Fe sulphides, some with inclusions of precious metal minerals, formed from primary sulphide melts during crystallisation of the gabbroic host. The Cu-Fe sulphides display solid state exsolution textures in response to cooling (see Fig. 5k–n). The temperature of the Cu-rich sulphide (iss) exsolution is 490–350°С (Kullerud 1957, 1967; Spiridonov 2010b). An important temperature constraint is, however, provided by orthopyroxene-clinopyroxene pairs (e.g. Fig. 7c). Hot, primary droplets of the Cu-Fe sulphide melt in the margins of augites slowed the cooling of augite and exsolution of orthopyroxene. We calculated equilibrium temperatures for pyroxene pairs in samples 24-1057 and 18-1010 from Pd5 using the two-pyroxene thermobarometer of Brey & Köhler (1990). The estimated temperatures are 808–829°С (Р = 1 kbar) and 817–839°С (Р = 4 kbar) and constrain droplet formation to temperatures well above 800°C. The experimental solidi for the Cu-Pd system are 1554–1083°С and for Cu-Au 1063–1083°C at increasing Cu (Figs 34, 35; Baker et al. 1992) with continuous, structurally disordered series of cubic Cu-Pd and Cu-Au solid solutions. During slow cooling and equilibration, the Cu-Pd and Cu-Au compounds obtain ordered structures as exemplified by ‘microdroplets’ of (Cu,Pd) and (Cu,Au) alloys with sub-euhedral to euhedral habits in sulphide hosts (Figs 16m–p, 17l, 23g, h). These euhedral crystals of precious metal phases may represent droplets of precious metal melt that re-equilibrated and recrystallised at lower temperatures.
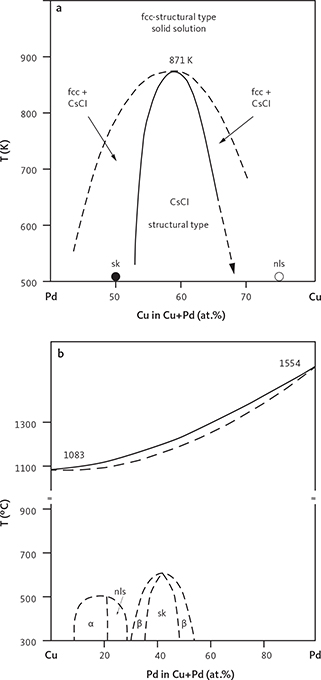
Fig. 34 Binary phase diagrams for Cu and Pd after Savitsky (1984) and Baker et al. (1992). a: Stability fields for structural types CsCl and for fcc + CsCl for composition with 0.43 < Cu < 0.70 (at.%). Abbreviations in (a) are as follows: fcc: face centered cubic. sk: skaergaardite. nls: nielsenite. b: Stability fields for coumpounds and minerals from Au to Cu. Solid lines: established boundaries of stability fields. Dashed lines: approximate positions of the boundaries. Abbreviations in (b) are as follows: nls: nielsenite (Cu3Pd). sk: skaergaardite. α: (Cu,Pd)α alloy. β: (Pd,Cu)β alloy.
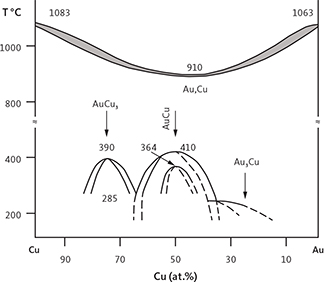
Fig. 35 Binary phase diagram for Au-Cu (Savitsky 1984; Okamoto et al. 1987) showing the stability fields of phases with falling temperature. All these phases have been found in the HS concentrates from the Skaergaard PGE-Au Mineralisation. Grey shading: temperature range for liquidus to solidus transition for (Cu,Au) alloy. Solid lines: established boundaries of stability fields. Dashed lines: approximate positions of the boundaries. Boundaries at lower temperatures separate structural types of (Cu,Au) alloys stable at decreasing temperature (see Okamoto et al. 1987 for details).
Below 871 K, equivalent to 598°C, and in the compositional range 0.43 < Cu < 0.70 at.%, the Pd-Cu phase compares to cubic CsCl (space group Pm3m). Compositions with 0.53 < Cu < 0.65 correspond to a single ordered phase, and in the intervals 0.43 < Cu < 0.53 and 0.65 < Cu < 0.70 they correspond to a single ordered phase coexisting with a disordered solid solution phase (Fig. 34a; Subramanian & Laughlin 1991). The ordered stoichiometric intermetallic PdCu compound is skaergaardite (Rudashevsky et al. 2004) and the two areas of partial ordering of the solid solution seem to correspond to the non-stoichiometric (Cu,Pd)β compound.
Ordering of PdCu3-type compositions occurs at T < 508°C (Fig. 34b; Subramanian & Laughlin 1991). At 20–25 at.% Pd (Fig. 34b), the phase has a tetragonal structure (space group P4mm) and corresponds to PdCu3 compound, nielsenite (PdCu3; МcDonald et al. 2008). In the interval 10–20 at.% Pd, it has a cubic structure similar to that of AuCu3 (space group Рm3m). This phase seems to correspond to the non-stoichiometric compound (Cu,Pd)α. The degree of Cu and Pd ordering decreases from skaergaardite (PdCu) to nielsenite (PdCu3) in parallel with the increasing disorder in PdCu3 with an excess of Pd (Schubert et al. 1955). Nielsenite (PdCu3) therefore forms at lower temperatures than skaergaardite (PdCu), which is also suggested by the occurrence of skaergaardite rimmed by nielsenite (e.g. Fig. 17g).
The mineralisation also exemplifies the high- to low-T re-equilibration of Cu-Au compositions of tetra-auricupride (AuCu), to auricupride (Cu3Au) and unnamed Au3Cu. Grains of Cu-Au minerals are zoned (Fig. 25a–g; Table 12) and intergrowths of these minerals illustrate exsolution from parental high-T compositions (Fig. 25h–j; Table 13). The Au-rich phases formed in the following order: (Au,Cu,Pd) or (Cu,Au,Pd) alloys, followed by ordered and stoichiometric compositions of AuCu or AuCu3 and silver-containing solid solutions at lowest temperature.
The complex binodes of the low-T solid solution in the Au-Cu phase diagram correspond to ordered phases of AuCu, Au3Cu, and AuCu3 (Fig. 35; Okamoto et al. 1987; Baker et al. 1992). The ordering of AuCu, Au3Cu and AuCu3 occurs at T < 410–380°C. AuCu has an orthorhombic structure at T < 410–380°C (Fig. 35) and has a tetragonal structure at T < 380°C. AuCu3 alloy is cubic and analogous to auricupride at T < 390°С (Fig. 35). In addition, AuCu, auricupride (AuCu3), and unnamed mineral Au3Cu also formed as the result of exsolutions of Au-Cu solid solutions.
Phases of Cu-Ag appear to preserve comparatively high-T origins. Rare grains of Cu and Ag with 5.8 wt% Cu (Table 3, row 1, Table 9, row 8), and appear to have formed at 720°C (Savitsky 1984).
The spatial relationship between intermetallic compounds of Cu and Pd (skaergaardite; PdCu) and intermetallic compounds of Au and Cu (tetra-auricupride; AuCu) in Fig. 19i also reflects decreasing temperatures. This is illustrated by a skaergaardite composition that equilibrated to ‘low-skaergaardite’ at c. 600°C (Subramanian & Laughlin 1991; Karup-Møller et al. 2008) and which was subsequently rimmed by tetra-auricupride (AuCu) that equilibrated at c. 380°C (Okamoto et al. 1987).
5.6 Petrographic information relevant to beneficiation of the ore
Grain size and mineralogical associations of the precious metal phases are important constraints for beneficiation of the mineralised gabbros and potential ores of the Skaergaard PGE-Au Mineralisation. The BSE images of the 30 samples presented in this study suggest a range of grain sizes from 1 to 90 µm (measured as ECD; see Tables 1 and 3). The average grain sizes of precious metal phases in samples from the central intrusion (ToF), the eastern margin (core 90-23A), and the western margin (drill core 90-10) are 23.6 ± 0.5, 19.3 ± 0.8 and 22.5 ± 1.5 µm, respectively (Fig. 36). The precious metal grains are marginally larger in more central parts of the intrusion.
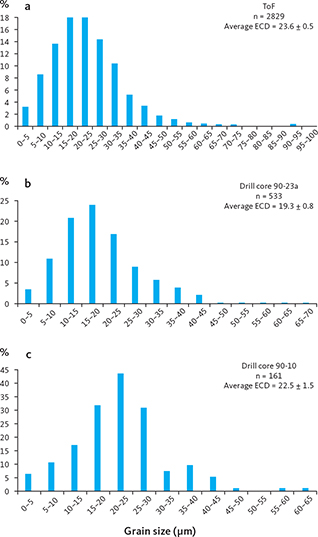
Fig. 36 Variation in grain size (μm) of precious metal grains in a: central part of the mineralisation (ToF: Toe of Forbindelsesgletscher), b: drill core 90-23A near the eastern margin and c: drill core 90-10 near the western margin. The central part of the mineralisation shows a relatively small increase in grains >30 µm.
Heavy mineral HS concentrates also show that precious metal minerals in the –125 μm fraction occur as grains that are intergrown with sulphides (type I), or with rock-forming minerals of the gabbroic host (type II) or as free grains (type III; Table 22; Fig. 37). Type I intergrowths and type III free grains of precious metal account for 73% to almost all the precious metal phases in the studied samples (Table 22; Fig. 37). The proportion of free grains (type III) reaches 63.5% in the Au+1 mineralisation level in drill core 90-18. The highest proportions of precious metals attached to FeTi oxides and silicates are found in the Au-rich mineralisation levels, represented by Au concentrations in samples 24-1022 (23.4%) and 23A-798 (26.8%). In general, sulphide intergrowths dominate in samples from Pd-rich mineralisation levels and vary from 56.3% to 79.4%, with an average of 77% in more central parts of the mineralisation and 68% toward the margins (Table 22).
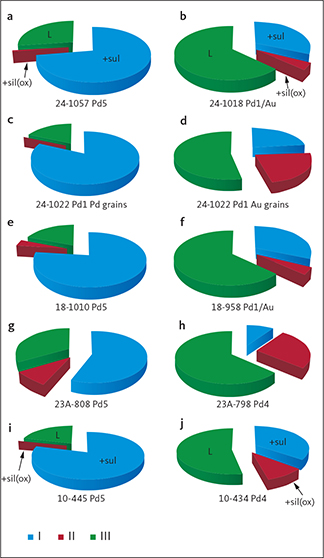
Fig. 37 Petrographic associations of precious metal mineral grains in individual samples (1 m intervals) from the lower PGE-rich (Pd5) mineralisation level and the Au-rich upper mineralisation levels (see Chapter 2) in –125 μm powders. Samples are identified by the unique number of the drill core followed by the depth in the core from where the sample was collected. E.g. sample 24-1057 collects the interval between 1057 and 1058 m in drill core 90-24. The precious metal phases are as follows: I: attached to sulphides (+sul), II: attached to silicates and FeTi oxides (+sil(ox)) or III: as liberated grains (L). Proportions of I to III are normalised to 100% and include data from drill cores 90-10, 90-18, 90-23A and 90-24 (Table 22). In the PGE-rich layer (Pd5) the precious metal minerals are associated with sulphides and occur as free phases with only small proportions associated with silicates and FeTi oxides. Conversely, the precious metal grains in the Au-rich mineralisation levels occur mostly as free grains but with high and variable proportions associated with either silicates and FeTi oxides or sulphides.
The HRXRT investigations of Godel et al. (2014) showed free grains of Au-phases between rock-forming minerals in Au-rich gabbro. Gold tends to form free interstitial grains in correlation with elevated bulk-rock Au, Te and Se (e.g. Holwell et al. 2015; Keays & Tegner 2016), and their accumulation from residual melts and fluids (Nielsen et al. 2015). In central areas the average is 60.1%, and 57.8% in the Au-rich Pd4a mineralisation levels near the margins (Table 22).
PGE-phases tend to relate to or be enclosed in sulphides while Au phases tend to occur as free grains or are attached to silicates and FeTi oxides. This also applies to individual mineralisation levels and is highlighted by the lower Pd-rich and upper Au-rich fractions of sample 24-1022, representing the 1 m interval from 1022 m to 1023 m in the drill core (Table 22, rows 5, 6; Fig. 37c, d).
Based on the grain-size information in Table 3, it is recommended that the mineralised gabbros are crushed to a grain size of c. 70 µm before floatation. Additional magnetic separation could concentrate magnetite and ilmenite to recover sulphide droplets and precious metals trapped in FeTi oxides and potentially valuable biproducts such as Ti, V and Ga (Rudashevsky et al. 2014, 2015).
6 The mineralisation processes
Sulphides can be found throughout the gabbros of the Skaergaard intrusion. In the lower part of the intrusion and prior to the formation of the PGE-Au Mineralisation, the sulphides crystallised in interstitial blebs of trapped melt (e.g. Wernette et al. 2020). The amounts of trapped melt and volatile-rich fluid can be estimated (e.g. Tegner et al. 2009), but do not account for the proportions of the host rocks that crystallised from interstitial mush melts and whose residuals were subsequently recycled into the overlying bulk magma (Nielsen et al. 2019b). Precious metal bulk-rock anomalies in the upper levels of LZc and in MZ, can be correlated to the occurrence of gabbroic and basaltic blocks from the roof zones and an associated increase in crystallisation of FeTi oxides (Nielsen et al. 2015). Increase in FeTi oxide crystallisation may have caused local sulphide saturation and increases in concentrations of precious metals (Bird et al. 1991).
Irrespectively, the Pd/Pt ratios in gabbros just below the precious metal mineralisation has only increased from c. 3 to 6. A high D-value for Pd compared to Pt would have led to systematically decreasing Pd/Pt ratios in the remaining bulk liquid. Instead, the increase in Pd/Pt is due to limited solubility of Pt compared to Pd (Nielsen et al. 2019b). Below and prior to the formation of the PGE-Au Mineralisation, sulphide saturation was reached in trapped liquids. In the upper MZ and the mineralisation, sulphide saturation was reached in melts that crystallise and evolve to residuals that were recycled to overlying mush or bulk liquid. Sulphide saturation in bulk liquid was reached during the formation of the lower UZa (Nielsen et al. 2015).
Major differences are apparent between the centre and the margins of the intrusion, despite very similar elemental distributions in mineralisation levels Pd6 and Pd5 (Andersen et al. 1998; Nielsen et al. 2005). At the margins, the entire precious metal mineralisation is hosted in Pd6, Pd5 and Pd4 over a total width of c. 15 m and in two macrorhythmic layers. This compares to 60 m and five macrorhythmic layers in the central part of the mineralisation. Total PGE, calculated as ‘grade times width’ (g*w; m x ppm), is 20 at the margins compared to 35 in the centre (Nielsen et al. 2019a). Total Au g*w is 4 near the margins and 12 in the centre (Nielsen et al. 2019a). Much less precious metal is found at the margins despite similar stratigraphic thicknesses of the gabbroic hosts.
Consequently, and during the formation and crystallisation of the macrorhythmic layers of the upper MZ, a process concentrated the precious metals, especially Au, progressively higher up in the stratigraphy and more centrally in the bowl-shaped, layered gabbros. The syn-crystallisation mobility of the precious metals in the macrorhythmic layers is key to the understanding of the processes that controlled the formation of the Skaergaard PGE-Au Mineralisation.
Here, we present a 10-step summary that integrates the mineralogical information presented here with the mineralisation model developed by Nielsen (2016) and Nielsen et al. (2015, 2019a) and the model for the evolution of the bulk liquid in Nielsen et al. (2019b). We assume that cooling was most effective at the roof of the shallow crustal magma chamber, and that mushes formed under the roof descended to the floor in convective currents. The mushes crystallised in situ in the floor and recycled residual, evolved and buoyant melts to the bulk magma (Nielsen et al. 2015, 2019a, b). The sequence of events that led to the observed mineralisation is therefore divided into two. Firstly, processes that extracted all precious metals from remaining bulk liquid and concentrated them in the ‘mushy’ floor (steps 1–3; Fig. 38a), and secondly the processes that led to the fully developed mineralisation in the floor mushes in the central parts of the intrusion (steps 4–10; Fig. 38c). Processes in the faster-cooled mush near the margins of the intrusion are subsequently discussed.
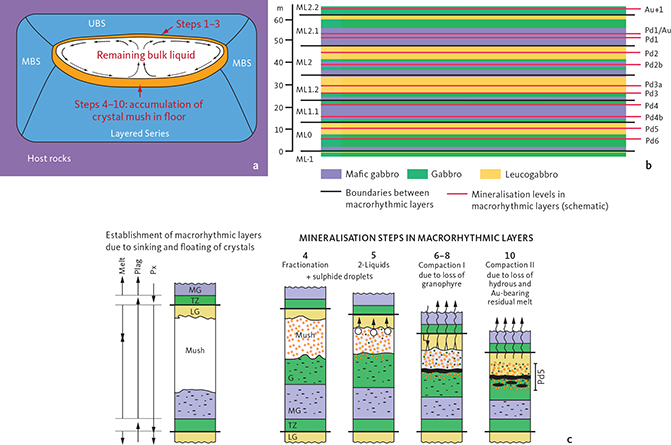
Fig. 38 Summary of the mineralisation processes in the Skaergaard PGE-Au Mineralisation, as developed in Nielsen (2016) and Nielsen et al. (2015, 2019a, b). a: Trapping and accumulation of precious metals (steps 1–3) during which the precious metals are brought to the floor mush (based on fig. 26 in Nielsen et al. 2015). Blue: solidified gabbro. Orange: mush zones with trapping. White: remaining bulk liquid. Purple: Palaeogene and Precambrian host rocks. Red arrows point to the zone of trapping of precious metals under the roof (steps 1–3) and the crystallisation and mineralisation processes in the floor mush (steps 4–10). b: Correlation between mineralisation levels and the macrorhythmic layers. The bowl shape of the layers is omitted for clarity. The lower four macrorhythmic layers host two mineralisation levels each, including a lower level due to density accumulation and an upper level due to in situ sulphide saturation in residual Fe-rich mush melt (based on fig. 8 in Nielsen et al. 2015 and fig. 5 in Nielsen et al. 2019a). c: Upward accumulation, fractionation and transport of the precious metals in mush melts. Steps 4–10 within ML0 macrorhythmic layer hosts the main PGE-mineralisation level, Pd5. Sinking of dense phases and the rise of plagioclase in the proto-macrorhythmic layers allowed mush melt to evolve in between the two. Sulphide saturation is reached due to crystallisation and fractionation of the mush melt (yellow dots with red rims) and is followed by silicate immiscibility (blue dots with black rims), and loss of Si-rich conjugate melt, ponding of dense Fe-rich silicate melts and subsequently the loss of the residual Fe-rich silicate melt and free volatile phase. Steps 4–10 are repeated in all mineralisation layers from ML0 to ML2.1 (based on fig. 22 in Nielsen et al. 2015). MBS: Marginal Border Series. UBS: Upper Border Series. ML-1 to ML2.2: macrorhythmic layers. Plag: plagioclase. Px: pyroxene. MG: melagabbro. G: gabbro. LG: leucogabbro. TZ: transitional zone.
Steps 1 to 10 for the central parts of the intrusion are illustrated in Fig. 38 and described as follows:
Steps 1–3: Processes that concentrated precious metals in the floor mush:
- Once the entire magma chamber was established, the precious metals and volatiles accumulated in the remaining bulk magma like any other incompatible element. Exceptions are precious metals and volatiles in trapped melts, and precious metals hosted in sulphides that formed as the result of the reaction between bulk liquid and roof blocks sinking into the magma chamber (Nielsen et al. 2015).
- The magma cooled from the roof, walls and floor. Sulphide saturation was first reached in mush melt under the roof, down the walls and subsequently in the mush floor. At this stage, the bulk magma had FeO* c. 22 wt%, Pt 10 ppb, Pd 63 ppb, Au 42 ppb and Cu 700 ppm. The mush liquid would have FeO*c. 22 wt% (compatible element), Pt 15 ppb, Pd 94 ppm, Au 63 ppm and Cu 1000 ppm.
- Dense sulphides and immiscible Fe-rich silicate melts that formed in the mush below the roof of the magma chamber were carried to the intermittent floor of the magma chamber in convective currents. In the floor, they mixed with residing mush. Almost all precious metals ended up dissolved in the melts of the mushy floor.
Steps 4–10: Sulphide saturation, dissolution of sulphides melt and redeposition of precious metals in floor mushes:
4. Sulphide saturation was reached at T = 1030–1050°C, when a maximum of c. 65 vol.% of mush melt remained in macrorhythmic layer ML0. Many tiny droplets of sulphide melt in suspension equilibrated with the remaining bulk liquid and preserved the Pd/Pt ratio of the bulk melt (Pd/Pt = 6–10). Only accumulated and protected sulphide and sulphide droplets that were enclosed in other minerals or otherwise protected from subsequent equilibration with interstitial melt preserved high Pd/Pt ratios. The Pd/Pt ratios are approximately five times that of the coexisting silicate liquid and reflect the high D-value of Pd between sulphide and silicate liquids.
5. The mush melt reached the two-liquid field between Si-rich and Fe-rich melts at c. 1015°C, when a maximum of c. 40% melt remained in the mushes of the macrolayers, and buoyant, immiscible Si-rich melt started to be recycled to the overlying bulk magma.
6. Unprotected sulphide droplets redissolved in contact with the residing Fe-rich melt, and redissolved Cu, Pt and Au became available for upward migration in the remaining silicate melt and coexisting supercritical aqueous fluids. The dissolution process is similar to that of Peregoedova et al. (2004).
7. Within each macrorhythmic layer, decreasing temperature led to exsolution of precious metal phases from protected and unprotected sulphide droplets.
8. Remaining mush melt enriched in volatiles, Au and high field strength elements (HFSE) migrated upwards in the overlying proto-macrorhythmic layer (Nielsen et al. 2015). A small proportion of residual melt and fluid was trapped in the upper part of the macrorhythmic layers, as reflected in locally increasing Au/Pd ratios and in common hydrothermal alteration (Nielsen et al. 2015).
9. Processes in steps 4–8 are incrementally repeated in each of the macrorhythmic layers (ML1.1, ML1.2, ML2 and ML2.1; Nielsen et al. 2019a). At each step, fluid content increases, and so do ratios of Au/Pd and Pt/Pd due to high D-values for Pd.
10. Residual fluid enriched in Au, Te and Se (see Section 5.4) rose to form the PGE-poor uppermost mineralisation levels Pd1/Au and Au+1.
The paragenetic and petrographic relations are very different near the margins of the intrusion and reflect local geochemical environments (Nielsen et al. 2019a). Zvyagintsevite (Pd3Pb) dominates toward the eastern margin, and Pd-sulphides dominate toward the western margin. At both margins, the relative proportions of these minerals decrease over a height of 15 m and up ML0. The plumbides and sulphides are followed first by arsenides, and subsequently by tellurides and (Au,Cu,Ag) alloys. We note that the detailed description of parageneses at the eastern margin in Holwell et al. (2016) does not represent the bulk of the mineralisation.
Droplets of Cu-Fe sulphide melt occur in FeTi oxides in mineralisation levels near the margins. The droplets testify to in situ sulphide saturation and processes similar to those in the centre. In the centre, the droplets are composed of bornite and chalcocite, but at the margins they are composed of bornite and chalcopyrite and represent a more S-rich paragenesis. Examples of these droplets with Pd sulphides and of compounds of Ag, Cu and Au are shown in Figs 23j, k, 24c, d, 27h.
In samples from near the margins of the intrusion, the precious metal phases are not necessarily directly related to grains of Cu-Fe sulphide but are generally spatially related to H2O-bearing silicates and other late- to post-magmatic minerals including hornblende, biotite, actinolite, chlorite, talc, magnetite and quartz (Figs 17l, 20l–n, 26h, 27o, p, 30b, c, e, f, 32e, i). Grains of solid solutions of Au, Ag, Cu and Pd in these parageneses often have elongated tabular or pseudo-prismatic shapes. They fill the interstices between late- to post-magmatic silicates (Figs 23l–n, 24k). The last-formed low-T precious metal phases are rare native gold and silver (Figs 26j, 32e, g).
At the eastern margin, towards the Palaeogene lavas, the precious metal paragenesis comprises a polymineral association of Pd-intermetallic compounds dominated by zvyagintsevite, with keithconnite, atokite and arsenides dominated by arsenopalladinite and vincentite and minor palladoarsenide, sperrylite and solid solutions of Au, Cu, and Ag. The Pd-intermetallic compounds are of very minor importance at the western margin, towards the Precambrian basement where the Pd-sulphides vysotskite and vasilite dominate, accompanied by the Pd-arsenide vicentite, the Pd intermetalloids keithconnite and (Au,Cu,Ag,Pt) alloy. These complex precious metal parageneses equilibrated with dense hydrothermal fluids trapped within the gabbros (Figs 26g–j, n, o, 27 k–p, 30b–h, k, l). They recall low-T parageneses of low-sulphide Ni-Cu occurrences (Spiridonov 2010b) and are most likely comparable to those of the Monchegorsk Magmatic Layered Complex and the Monchetundra Deposit, Kola Peninsula, Russia (Grokhovskaya et al. 2009).
The low temperature of equilibration of the hydrous silicate paragenesis, the paragenetic differences and lateral variation in, for example, PGE, Au, Ag, Te and Cu within a single stratigraphic layer of the host gabbros, suggest local controls by the coexisting fluids. The fluids were S-rich toward the Precambrian basement to the west and S-poor toward the lavas at the eastern margin. The precious metal paragenesis crystallised and re-equilibrated in equilibrium with metal-rich fluids trapped in the crystallising gabbros. These fluids were out of equilibrium with the liquidus paragenesis of the gabbroic host. Fluids as well as immiscible Si-rich melts in paired melt inclusions were trapped in these gabbros (Holness et al. 2011) and imply reduced permeability in gabbros that cooled close to the margins of the intrusion.
The stratigraphic variations and levels of elemental concentrations in Pd5 remain the same in drill cores across the intrusion (Andersen et al. 1998). Consequently, the processes that concentrated precious metal in the floor mush apply to all parts of the intrusion and steps 1–3 of the mineralisation processes therefore apply to the eastern as well as the western margins. However, due to reduced permeability and mobility of interstitial melts and aqueous fluids at the margins, the subsequent steps differ as outlined here:
- The mush melt reached the two-liquid field between Si-rich and Fe-rich melts at c. 1015°C. Fluids and silicate melts remained in the mush and equilibrium was maintained.
- As crystallisation of the gabbroic host progressed, sulphide droplets evolved and exsolved precious metal at decreasing T (Karup-Møller et al. 2008). The parageneses equilibrated with trapped fluids and residual silicate melts resulting in hydrous silicate parageneses in matrix and veins. Unprotected sulphides reacted and equilibrated with hydrous residual melts and trapped fluid.
- Zvyagintsevite (Pd3Pb) dominated the paragenesis at the eastern margin, and Pd-sulphides dominated at the western margin. The paragenetic differences between the two margins reflect local geochemical environments and seemingly also compositional differences between meteoric fluid from the Precambrian basement versus that of the Palaeogene lava successions. Thus, precious metal paragenesis formed near the margins of the intrusion cannot represent the paragenesis of the bulk of the Skaergaard PGE-Au Mineralisation.
- The proportions of zvyagintsevite at the eastern margin and of Pd-sulphides at the western margin decrease upwards in Pd5 and give way, first to Pd-arsenides and subsequently to (Au,Cu,Ag) alloys typical of parageneses in equilibrium with late magmatic hydrothermal fluids.
7 Conclusions
The contrast between precious metal parageneses and grain morphologies in the lower PGE-rich and the Au-rich upper mineralisation levels confirms the orthomagmatic origin of the Skaergaard PGE-Au Mineralisation. Pd was concentrated in droplets of an immiscible Cu and Fe sulphide melt, aided by subsequent resorption. Whereas the late accumulation of Au was the result of upwards hydrothermal transport. The mineralisation processes described here span a wide temperature interval from c. 1050°C to temperatures below the solidus.
The observed distribution of precious metals in the Skaergaard PGE-Au Mineralisation is the result of the interplay between (1) the bulk composition of the magma, (2) the solubilities of the precious metals, copper and sulphur, (3) the density control on accumulation and mobility of melts and solids and (4) contrasts in cooling conditions in the magma chamber.
Fundamental to the mineralogy, morphology and petrographic relations of the precious metal parageneses, is the timing of sulphide saturation and the mobility of residual melts and fluids. Immiscible droplets of Cu and Fe sulphide formed throughout the residual mushes of the macrorhythmic layers at temperatures of 1050 to 1030°C. Some droplets accumulated and were protected in the lower mineralisation levels, and the remainder disseminated in the upper parts of individual macrorhythmic layers. Subsequent silicate immiscibility at c. 1015°C led to resorption and syn-magmatic rather than post-solidification loss of S. The sulphide droplets exsolved precious metals in droplets of melts that crystallised as, for example, ‘high skaergaardite’. Cooling also led to diffusion of precious metals from sulphides to the remaining mush melts and fluid, which were then made available for upward migration. All sulphides and precious metal phases equilibrated with the remaining mush melts and fluids as temperatures dropped following known phase relations. These processes led to the stratification of the mineralisation and the fractionation of upward-decreasing Pd/Pt ratios and increasing Au/Pd ratios, and the total dominance of skaergaardite (PdCu) with upward-increasing Au in the bulk of the Skaergaard PGE-Au Mineralisation.
At the margins of the intrusion, faster cooling reduced permeability, hence the mobility of residual melts and fluids was hampered. This resulted in the absence of resorption of sulphide droplets and the preservation of a bornite-chalcopyrite sulphide paragenesis. Only residual fluids containing Au and elements carried in high-T magmatic systems escaped from the lowermost macrorhythmic layer. Subsequent recrystallisation and equilibration to hydrous, low-T parageneses with sulphides, arsenide and intermetallic compounds was controlled by local geochemical constraints, comparable to late magmatic parageneses known from PGE and Au deposits elsewhere.
The Skaergaard PGE-Au Mineralisation is seemingly unique in its extensive preservation of sulphide droplets the subsequently crystallised precious metal minerals and the preservation of exsolved droplets of precious metals. As such, the mineralisation provides insights into the early stages of precious metal mineralisation in layered intrusions that are often obliterated by subsequent hydrothermal reactions at lower temperatures and remobilisation of the metals.
Our detailed record of the mineralogy and petrographic relations across the Skaergaard intrusion testify to the significant complexity in metal distributions, mineralogy and genesis of Skaergaard-type PGE-Au mineralisations. Almost all models proposed and demonstrated for the formation of precious metal mineralisations in layered gabbro complexes apply to one or another part or formation stage of the Skaergaard PGE-Au Mineralisation. No classic orthomagmatic model, nor a model advocating fluid redistribution of precious metals from already solidified parts of the intrusion can account for our observations, but a combination of the two models can. The concentration of the precious metals is the result of syn-magmatic sulphide saturation below the roof of the intrusion, followed by repeated sulphide saturation in floor mushes, re-equilibration and redistribution by mush melts and fluids in the accumulating gabbros.
Additional information
Author contributions
NSR and VNR: laboratory analyses, preparation of reports on which this study is based, writing of the manuscript. TFDN: project design, selection and collection of samples, development of petrogenetic models, editing of the manuscript and main author of the introduction, discussion and conclusions.
Acknowledgements
These investigations could not have been carried out without the continued support by late Dr. Leif Thorning, head of the Department for Petrology and Economic Geology, GEUS. Guest editor Rune B. Larsen and GEUS Bulletin editor in-chief Catherine Jex, are thanked for their most helpful comments and advice. Reviews by Frederica Zaccarini and Eduardo Mansur were of great help during revision of the manuscript. Artwork was produced with valuable help from Susanne Rømer and the drawing office of GEUS.
References
Appendix 1 Formulae for common host-rock minerals and base metal sulphides
Rock-forming minerals
Olivine: (Mg,Fe)2SiO4
Forsterite: Mg2SiO4
Fayalite: Fe2SiO4
Pyroxene group
Orthopyroxene: (Mg,Fe)SiO3
Clinopyroxene: Ca(Mg,Fe)Si2O6
Plagioclase: (Na,Ca)[(Si,Al)AlSi2]O8
Anorthite: CaAl2Si2O8
Albite: NaAlSi3O8
FeTi oxides
Titanomagnetite: Fe2+(Fe3+,Ti)2O4
Ilmenite: FeTiO3
Magnetite: Fe3O4
Apatite Ca5(PO4)3(Cl/F/OH)
Biotite: K(Mg,Fe)3AlSi3O10(OH)2 (simplified)
Amphibole group
Hornblende: (Ca,Na)2(Mg,Fe,Al)5(Al,Si)8O22 (OH)2 (simplified)
Actinolite: Ca2(Mg,Fe)Si8O22(OH)2
Tremolite: Ca2Mg5(Si8O22)(OH)2
Cummingtonite: Mg7(Si8O22)(OH)2
Pargasite: NaCa2(Mg4Al)(Si6Al2)O22(OH)2
Talc: Mg3Si4O10(OH)2
Chlorite: (Mg,Fe)3(Si,Al)4O10(OH)2·(Mg,Fe)3(OH)6
Serpentine: (Mg,Fe,Ni, Mn,Al,Zn)3[Si2O5](OH)4
Ferrosaponite: Ca0.3(Fe2+,Mg,Fe3+)3((Si,Al)4O10)(OH)2 · 4H2O
Calcite: CaCO3
Quartz: SiO2
Rare accessory minerals
Baddeleyite: ZrO2
Zircon: ZrSiO4
Thorianite: ThO2
Monazite: REE(PO4)
Uraninite: UO2
Thiospinel: variety carrollite Cu(Co,Fe,Ni)2S4
Base metal sulphides
Bornite: Cu5FeS4
Chalcocite: Cu2S
Digenite: Cu9S5
Chalcopyrite: CuFeS2
Pyrrhotite: Fe1-xS
Galena: PbS
Sphalerite: ZnS
Pentlandite: (Fe, Ni)9S8
Cobaltian pentlandite: (Co,Ni,Fe)9S8