RESEARCH ARTICLE
Fingerprinting sources of salinity in a coastal chalk aquifer in Denmark using trace elements
Christian Knudsen* , Klaus Hinsby
  , Rasmus Jakobsen
  , Lars Juul Kjærgård, Per Rasmussen
Geological Survey of Denmark and Greenland, Copenhagen, Denmark
Citation: Knudsen et al. 2021: GEUS Bulletin 47. 5336. https://doi.org/10.34194/geusb.v47.5336
Copyright: GEUS Bulletin is an open access, peer-reviewed journal published by the Geological Survey of Denmark and Greenland (GEUS). This article is distributed under a CC-BY 4.0 licence, permitting free redistribution, and reproduction for any purpose, even commercial, provided proper citation of the original work. Author(s) retain copyright.
Received: 20 Aug 2020 Accepted: 12 Mar 2021 Published: 23 July 2021
Competing interests and funding: None declared
The study was conducted as part of the SUBSOL project (www.subsol.org) that received funding from the European Union’s Horizon 2020 research and innovation programme under grant agreement no. 642228.
*Correspondence: [email protected]
Keywords: fingerprinting, groundwater, chalk aquifer, trace elements, selforganising map
Abbreviations:
b.s.: below surface
BMU: best matching units
DGU: Danish Geological Survey
GEUS: Geological Survey of Denmark and Greenland
ICP-MS: inductively coupled plasma mass spectrometry
SOM: self-organising map
Edited by: Julian Koch (GEUS, Denmark)
Reviewed by: Søren Munch Kristiansen (Aarhus University, DK), Sascha Müller (University of Copenhagen, DK), Boris van Breukelen (TU Delft, NL)
Abstract
Salinity levels above the drinking water standard (>250 mg/l Cl–) are observed at shallow depth in a Maastrichtian chalk aquifer on the island of Falster, south-eastern Denmark. To understand the source of the salt, 63 samples from 12 individual, 1 m, screened intervals between 14 and 26 m b.s. were collected from 1 May to 4 June 2018. The samples were collected during a tracer test to estimate the dual porosity properties of the chalk and were analysed for a wide range of elements. Furthermore, samples from the Baltic Sea and from deeper saline aquifers in the area (40 and 85 m b.s.) were analysed for comparison. The geochemical data were analysed using an unsupervised machine-learning algorithm, self-organising maps, to fingerprint water sources. The water composition in the screened intervals at various stratigraphic levels has specific geochemical fingerprints that are maintained for the first days of pumping and are distinct amongst the different levels. This suggests an evolution in water composition because of reaction with the chalk. Water composition is distinct from both seawater from the nearby Baltic Sea and salty water from deeper levels of the reservoir. Thus, neither up-coning of salty water nor intrusion of seawater caused the elevated salinity levels in the area. The slightly saline composition of groundwater in the shallow aquifer (14–26 m b.s.) is more likely because of incomplete refreshing of the salty connate water in the chalk during the Pleistocene and Holocene. Furthermore, the geochemical fingerprint of salty water from the deeper aquifer at 40 m was similar to water from the Baltic Sea, suggesting a Baltic Sea source for salt in the aquifer at 40 m b.s., c. 100 m from the coast. Statistical analysis based on self-organising maps is an effective tool for interpreting a large number of variables to understand the compositional variation in an aquifer and a useful alternative to linear dimensionality-reduction methods such as principal component analysis. The approach using the multi-element analysis combined with the analysis of self-organising maps may be useful in future studies of groundwater quality.
1 Introduction
Sustainable water resources management and saltwater intrusion in coastal aquifers are huge challenges globally, and these challenges are projected to be more severe in the future due to climate change and sea-level rise (Hinsby et al. 2016; Rasmussen et al. 2013).
Saltwater intrusion may be the most important challenge in coastal aquifers, and there is a strong need for the development and implementation of effective mitigation and remediation measures (Hinsby et al. 2018). Designing efficient mitigation and remediation measures requires an understanding of the sources and occurrence of the saltwater. Possible sources include saltwater from nearby seas, marine deposits in or adjacent to the aquifers or saline groundwater recharge due to decreasing and/or increasing precipitation and evaporation. All these sources may affect the salinity of the aquifers in some areas, while in others perhaps only one of the sources is of significance.
The final decision on which method should be implemented to protect coastal water resources ultimately relies on a sound understanding of the location and nature of the salinisation sources. Here, we propose a new approach based on self-organising maps (SOMs) for fingerprinting the sources of increasing salinity in aquifers using an example from a coastal confined chalk aquifer on southern Falster, Denmark (Fig. 1A).
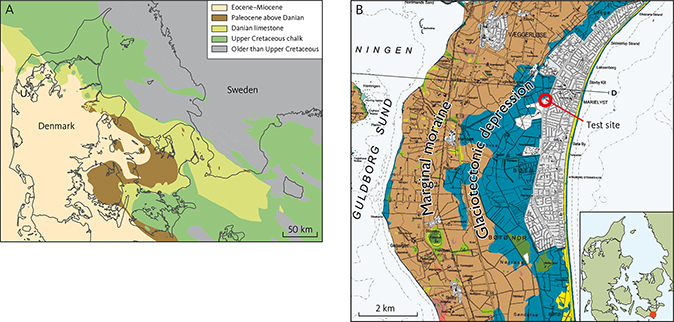
Fig. 1 Location and geological setting of the study site. A: Geology of Denmark. B: Focussed view of the test site on the island of Falster, south-eastern Denmark. The location of the test site (Fig. 3) is indicated by a red circle. Modified from Pedersen et al. (2018).
Elevated salinity levels were observed at shallow depth in a Maastrichtian chalk aquifer on the island of Falster, south-eastern Denmark (Fig. 1) as early as 1936 (Ødum & Christensen 1936). Chloride concentrations of c. 200–300 mg/l Cl– are locally found down to c. 25 m below the surface (m b.s.). The chloride content is generally below the WHO/EU drinking-water standard of 250 mg/l Cl– but high compared with the recent groundwater recharge and frequently above a threshold value of c. 200 mg/l Cl– proposed for Danish groundwater bodies based on the European Water Framework and Groundwater Directives and related guidelines (Hinsby et al. 2008). Below this, between 25 and 45 m b.s., the salinity is c. 500 mg/l Cl– and it increases with depth to c. 4000 mg/l Cl– at 80 m depth and further to c. 20 000 mg/l Cl– at about 150 m b.s. (Rasmussen et al. 2013). A recent status assessment of Danish groundwater bodies has identified the chalk aquifer on Falster as having poor chemical and quantitative status due to indications of freshwater mining and saltwater intrusion in several areas (Henriksen et al. 2019). This agrees with a previous assessment, which concluded that new innovative subsurface water solutions involving managed aquifer recharge (Zuurbier et al. 2017) will most probably be required to secure future sustainable water supply at least in the southern part of Falster (Hinsby et al. 2018).
The objective of this study was to investigate the origin of the elevated salinity in the area: is it caused by intruding saltwater from the Baltic Sea, up-coning of salt connate water (water trapped in the pores of the chalk when deposited) from below due to pumping, incomplete leaching of connate water in the upper part of the chalk aquifer or by infiltration of recharge through Holocene marine sediments above the chalk aquifer (Hinsby et al. 2012; Rasmussen et al. 2013)? Understanding the sources of the saltwater have implications for the choice of measures implemented to control further increases of chloride in water supply wells in the area (e.g. Zuurbier et al. 2017).
To understand the sources of chloride (saltwater) in water-supply wells, we analysed (1) water from the Baltic Sea, (2) connate water from deeper levels in the chalk, (3) water from filters in wells in the chalk at depths from where the water company abstracts drinking water and (4) the variation of the composition over time while pumping on the wells.
The main aquifer in the area consists of Maastrichtian chalk in which the Quaternary glaciations have caused intense fracturing in the upper 10–43 m of the chalk. The glacial disturbances include dislocation and development of a chalk-glaciotectonite locally containing Quaternary sediments (Pedersen et al. 2018). Below 45 m b.s., the gamma-ray signal increases suggesting that the chalk is marly and the transmissivity in the chalk is lower here.
In Danish chalk aquifers, the residual saltwater is usually completely flushed out in the upper 50–80 m (Bonnesen et al. 2009). Below this follows a transitional zone with increasing salinity to depths of 150–200 m where the chloride concentration exceeds 19 000 mg/l, similar to deeper parts of the chalk in, for example, England (Edmunds et al. 1987). This level of salinity is similar to oceanic seawater and may represent connate water.
The low-lying glacial depression south-east of the marginal moraine (Fig. 1B) formed a shallow lagoon in the Holocene until land reclamation was initiated in the early 1860s, and it became operational from around 1900. The area is now covered by a thin layer of Holocene marine sand (Figs 2, 3B).
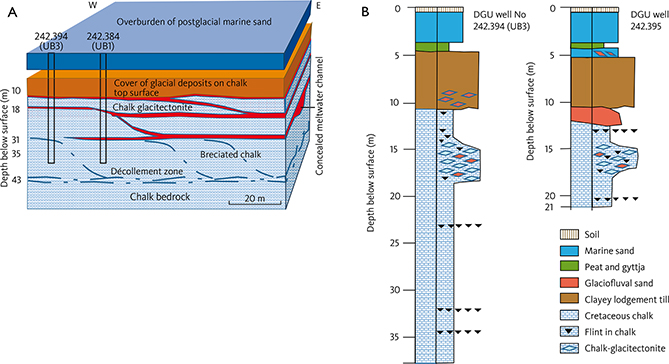
Fig. 2 A: Block diagram of the test site. Note that a significant part of the tracer tests described in this study takes place in the glacitectonite between 15 and 20 m b.s. (modified after Pedersen et al. 2018). Two wells are shown: DGU well no. 242.394 (UB3) and 242.384 (UB1). B: Schematic geological logs in two wells, DGU well no. 242.394 (UB3) and 242.395.
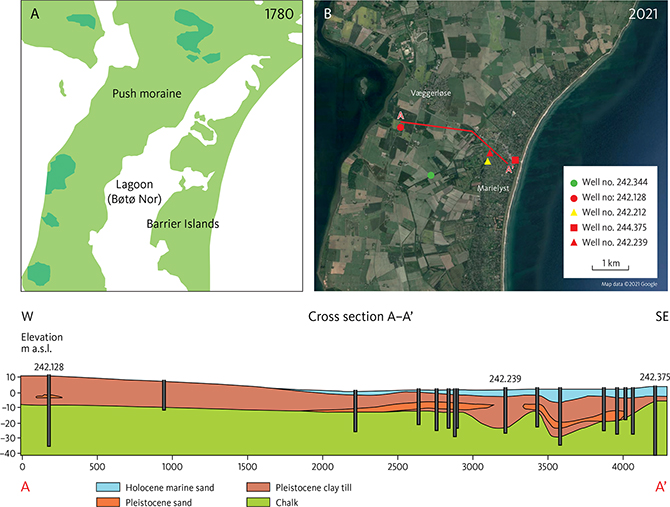
Fig. 3 A: The study area in 1780, about 80 years before land reclamation was initiated. B: The study area in 2021 with drainage canals developed in the land reclamation project initiated in 1861. The tracer test site investigated in this study (Fig. 4) is established at well no.: 242.212 (yellow triangle). The cross-section A–A’ through the study area and tracer test site is shown in the lower panel. The local water works abstracts groundwater from 11 wells in the upper 10 m of the chalk in the area.
2 Methods
2.1 Sampling strategy
Groundwater is pumped from well UB2 and re-injected in well UB1 creating a dipole flow system between the two wells (Fig. 4). The tracer (NaCl) is injected in well T2, and the breakthrough is observed in samples collected from the 14 screens in wells CMT 1 and 2. The location of these wells is marked on Fig. 4. Trace elements (measured by ICP-MS, details given) and chloride (measured by ion chromatography) were analysed in samples collected from CMT 1 and 2 wells. Electrical conductivity was continuously monitored in the same wells by WTW instruments using the calibrated WTW electrodes. The aim of the tracer test was to assess the dual porosity characteristics of the chalk.
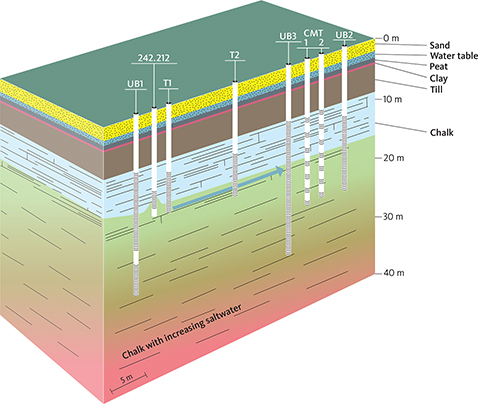
Fig. 4 Design of the tracer test site and wells (UB1, T1, T2, UB3, CMT1 and 2 and UB2). Red colours from about 30 m b.s. indicate high salinity with depth. The supply well is well 242.212, location on Fig 3. Green arrow indicates direction of the flow during the tracer test.
2.2 Sample collection and analysis
Two closely spaced multi-level monitoring wells (CMT 1 and 2), about 20 m downstream of a water supply well (242.212), were sampled in the Maastrichtian chalk aquifer (Fig. 4). A total of 58 ground water samples were taken from 12 1-m screens, between 14 and 26 m b.s. The samples were collected during continuous pumping on the wells between 1 May and 4 June 2018.
In the period from 1 May to 22 May 2018, 4.9 m3/h were pumped from a well (UB2) 3 m downstream (in the direction of the regional flow during the tracer test) from the monitoring wells (CMT 1 and 2), and 2.6 m3/h were re-injected into the well (UB1) c. 30 m upstream from the monitoring wells (Fig. 4). The constant pumping created a constant flow field during the dipole tracer test passing through the monitoring wells, such that the water sampled from a given sampling screen should represent the same volume of the aquifer for the pumping period. From 22 May to 4 June 2018, the pumping was set to 9.1 m3/h, and the re-injection was set to 5.3 m3/h.
A further five samples were collected from two other wells in the area about halfway through the experiment (17–18 May): three samples representing marine water from the Baltic Sea, one sample from 40 m b.s. (well site DGU 242.375, 100 m from the Baltic Sea; Fig. 3) and one sample representing deeper groundwater from 85 m b.s. (well site DGU 242.344, 2.8 km from the Baltic Sea; Fig. 3B). The purpose of this sampling was to obtain the composition of possible end-members for comparison.
All samples for the analysis of trace elements were collected by syringes and injected directly into prepared and acidified 20 ml polyethylene vials through 0.45 µm filters and kept at c. 8° Celsius until analysis. The samples from the multi-level wells (CMT 1 and 2) were collected by syringes directly from the 4 mm tubing constantly discharging water from the different screens at c. 80 ml per min.
The samples were analysed for trace elements at GEUS using inductively coupled plasma mass spectrometry (ICP-MS) and the Perkin–Elmer ‘TotalQuant’ method. Methods are provided in Supplementary File S1, online. We analysed for the following elements: Al, As, B, Ba, Ca, Ce, Co, Cr, Cs, Cu, Fe, K, La, Li, Mg, Mn, Mo, Na, Ni, P, Rb, Sc, Se, Si, Sr, Th, Ti, U, V, Y and Zn (the data are available online in Supplementary File S2).
2.3 Self-organising map analysis
The unsupervised machine-learning algorithm, self-organising map (SOM), provides a non-linear method for visualising multi-dimensional data, and it is used here to analyse the geochemical data. The SOM may be viewed as a two-dimensional grid onto which the multi-dimensional input data are projected or mapped. Here, we aim to reduce the complexity of our large dataset (27 elements analysed in 63 samples) into a set of geochemical fingerprints for each sample. These fingerprints can be represented in two dimensional maps, such that similar objects are close together, and dissimilar objects are far away from each other. In other words, the SOM processing finds an approximation of the data by mapping the input data into another dataset, which has fewer datapoints than the initial dataset. This approximation, referred to as the best matching units (BMUs), has the same amount of data types (i.e. same dimensionality) as the input data. The BMUs are presented in the SOM as a two-dimensional map and referred to as the SOM-space. Each BMU is associated with a cell in the matrix or SOM-space, and they are ordered in the matrix such that similar BMUs are adjacent to each other in the two-dimensional map. Although the SOM is two-dimensional, the multi-dimensionality of the input data is retained by the dimensionality of the BMU. Each of the input datapoints has a BMU to which the data are most similar. Several input data may be associated with the same BMU, in which case the SOM presentation may be viewed as a classification of the input data. The SOM is discretised in a pre-selected number of rows and columns (grid or matrix representation). Thus, the original multi-dimensional data are mapped into a new data space with only two dimensions and fewer data. In our case, the number of rows and columns are 5 and 11, respectively (Fig. 5A). The number of cells or elements defines the data reduction applied to the initial data. In this case, a reduction from 63 data samples analysed for 27 elements = 1701 datapoints reduced to a maximum of 5 × 11 = 55 datapoints (Fig. 5). The grid size is determined based on a heuristic approach. Large maps produce a large number of small but ‘compact’ clusters (records assigned to each cluster are quite similar). Small maps produce fewer but more generalised clusters. A ‘right number of clusters’ does not exist, especially in real-world datasets. It all depends on the detail in which you examine your dataset. The grid size used in this study is calculated by SOM based on the size of the dataset.
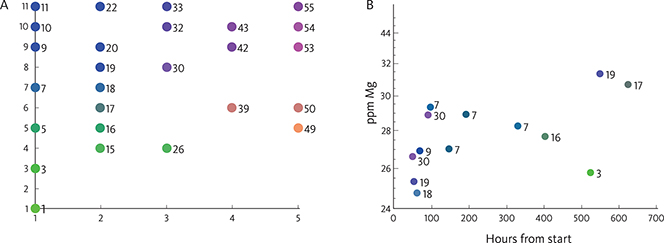
Fig. 5 Self-organising maps (SOMs): A: Each original datapoint is associated with a best matching units (BMU) point and only 26 out of 55 BMU points are selected. No units. B: Example SOM for Mg (ppm) versus time: the original datapoints with the associated BMU colours and numbers are displayed.
The SOM analysis is based on the commercial software package SiroSOM™. The grid size used in this article is calculated by SiroSOM based on the size of the dataset. The BMU colours are generated by SiroSOM, and the timeline and cross-plots are generated using a Matlab script developed by the Geological Survey of Denmark and Greenland (GEUS). The procedure used here is further described in Supplementary File S1.
The positions of the datapoints (Fig. 5B) represent the analytical results, whereas the colours of the dots represent their position in the entire dataset. The colour scale is chosen by the algorithm, but the colours are chosen so that points with colours close to each other represent samples with compositions that are close to each other in the 27-dimensional space. Detailed information on SOM can be found in Kohonen (1982, 1990, 2001, 2013) and Kalteh et al. (2008). The SOM method has recently been used in the analysis of groundwater geochemical data in a coastal aquifer near Venice (Dalla Libera et al. 2020) and in geochemical pattern recognitions of deep thermal groundwater in South Korea (Kim et al. 2020).
3 Results
The arrival of the tracer is seen as an increase in the conductivity in the monitoring wells (Fig. 6). The timing varies among the three different levels with maximum effect c. 100 h after the start of the experiment at 15.5 m, whereas the tracer peak arrives later at the 19.5 and 23.5 m levels and is much more diffuse. Another injection of tracer was initiated on 23 May 2018 peaking on 25 May at 15.5 m. The increased pumping and reinjection rate effects the time it takes for the tracer to pass the monitoring well (Fig. 6). The gap in the measurements of electrical conductivity (EC) in Fig. 6 was caused by power loss on the EC meter.
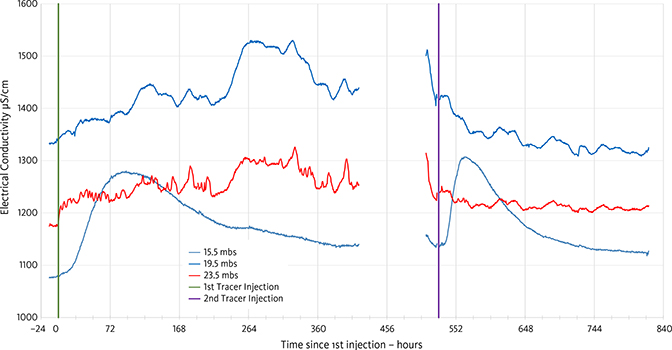
Fig. 6 Electrical conductivity (µS/cm) of the water in the monitoring wells as a function of time. The NaCl tracer was injected twice during the period on 1 May 2018 at 16.00 and 23 May 2018 at 14.24, indicated by green and purple vertical lines. Abstraction from UB2 was increased from 4.9 to 9.1 m3/h during the second tracer test resulting in a faster breakthrough.
3.1 Hydro-chemical fingerprints vary both with stratigraphy and time
Concentrations of, for example, Na, Mg, Mn, Co, Sr and Zn vary with depth in the wells and with time during the conducted tracer test, 1 May to 4 June 2018 (Fig. 7). For the first c. 75 h, the composition of the water is rather constant at the three levels (Fig. 7). The contents of Na, Mg, Sr, Zn, Mn and Co are high at the 19.5 m level relative to the 15.5 and 23.5 m levels and distinctly different from both the 15.5 and the 23.5 levels. The contents of Mg, Sr and Zn at the 15.5 m level are low, and the content of Mn is high relative to the 23.5 m level; the compositions of the water at the different stratigraphic levels are all distinct from each other.
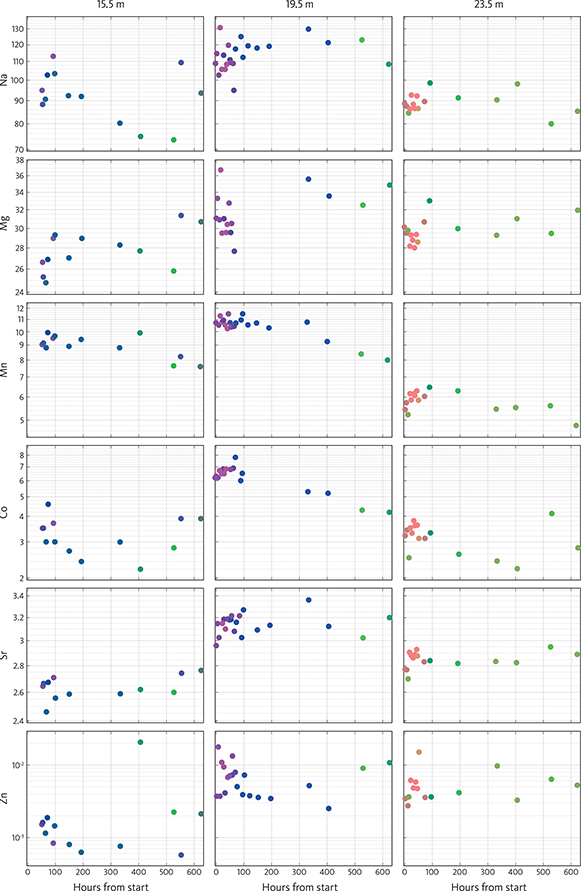
Fig. 7 Concentrations (ppm) of Na, Mg, Mn, Co, Sr and Zn in the extracted water from the three filters at 15.5 m, 19.5 m and 23.5 m as a function of time (hours) from 1 May to 4 June 2018. Depth of sampling points is shown at the top. Note that the Y-axis is on a log scale apart from Mg. The position of the points represents the actual measurements, whereas the colour of the points represents the SOM derived geochemical fingerprint.
The content of Na varies among the different stratigraphic levels (Fig. 7). The content of Mg is relatively low in the upper (15.5 m) level compared with both the middle (19.5 m) and lower (23.5 m) level, and the concentration stays more or less constant over the duration of the experiment, presumably because it is part of the carbonate rock itself. The content of Mn is relatively high in the upper and middle level compared with the lower level with a slight decrease over time. With respect to Co, the middle level is high relative to both the upper and lower levels and also shows a slight decrease over time. The Sr content is high in the middle level, low in the upper level and intermediate in the lower level, and the Sr content seems to be fairly stable in all levels. The content of Zn is low in the upper level relative to both the middle and lower levels. Collectively, the contents of Na, Mg, Mn, Co, Sr and Zn make the composition of each level distinct for the whole duration of the experiment.
The composition of the water when taking the complete analysis (all 27 elements) into account is reflected by the colour of the dots in Fig. 7. In the upper level (15.5 m), the dots range from purple and blue colours to blue–green during the first c. 80 h. Then, the composition is fairly stable (blue-green colours) for the next 300 h after which it changes to compositions dominated by green colours. In the middle level (19.5 m), the compositions are marked with pink and purple colours in the first c. 80 h; after this, the compositions are marked blue for the next 300 h before turning green as is seen in the upper (15.5 m) level. At the lower level (23.5 m), the compositions are dominantly marked with light brown and brown colours for the first c. 80 h. After which green colours also dominate.
3.2 Comparison with sea water and water from deeper levels
The composition of the water from the monitoring wells is compared with the composition of water from the Baltic Sea as and water from two deeper wells in the area (Fig. 8). The Mg concentrations of the seawater and the deeper wells are generally high compared with the monitoring wells (Fig. 8). Furthermore, the proportions (ratios) between the elements are different from the monitoring wells. An example is the very high Mn/Mg, Co/Mg, Zn/Mg and Sr/Mg ratios in the monitoring wells compared with the seawater (yellow dots in Fig. 8). There is a linear relationship between Sr and Mg in the monitoring wells (grey on Fig. 8). The deep well with a sample from 85 m b.s. (DGU 242.344) has a high chloride content and most trace-element contents are also high (light green dot in Fig. 6). The sample from 40 m b.s. also has elevated contents of trace elements (yellow dot in grey circle in Fig. 8), and the Sr/Mg, Co/Mg and Zn/Mg ratios are more like those in seawater samples. However, the Mn/Mg ratio is different. The hypothetical mixing lines between the infiltrating water and the deep, saline connate water (light green) and Baltic Sea water (yellow) are shown in Fig. 8. The composition of the infiltrating water is inferred to be rainwater containing c. 1% Baltic Sea water due to the near-coastal position and influx of wind-carried salty aerosols. This corresponds to a chloride concentration of about 40 mg/l, which has been observed in three nearby water-supply wells in chalk about 1 km north-west of the tracer test site, which seem to have been completely freshened during the Holocene. The composition of the infiltrating water is indicated by the trend lines on Fig. 8.
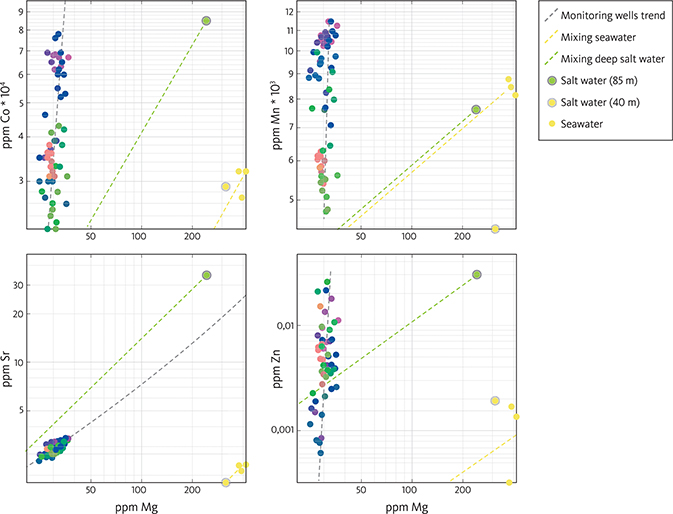
Fig. 8 Concentrations (ppm) of Co, Mn, Sr and Zn and versus ppm Mg in samples from the pumping experiment compared with Baltic seawater and two deeper wells on Falster at 85 m b.s. and 40 m b.s. Note that it is a log–log plot.
The water sample from 40 m (marked with a grey ring) has the same colour as the dots representing the seawater (yellow; Fig. 8). This implies that their hydro-chemical fingerprints are alike, that is, they are very close to each other in the 27-dimensional space of the geochemical dataset.
4 Discussion
Trace-element analysis of freshwater has previously been tested as a method for understanding the water–rock interactions in a system. Schürch et al. (2004) suggested that the groundwater geochemistry in a chalk aquifer is dominated by incongruent reactions with the fine-grained carbonate sediments, which release trace-element impurities into the water. Khadra et al. (2017) found that the chemical differences between limestone and dolomitic limestone were important factors in explaining the observed variation in the concentration of trace elements in fresh groundwater.
Yuan et al. (2019) found that multi-element fingerprinting can be useful for assessing hydrological connectivity across the landscape and indicate that element concentrations are affected not only by land use but also by hydrogeological characteristics.
The trace-element composition of the groundwater at 15.5, 19.5 and 23.5 m b.s. (Fig. 7) is distinct from each other at early times in the experiment, before the composition of the water is homogenised by the recirculation. Apart from Na, these elements occur in different minerals in the chalk with Mg and Sr mainly in carbonates, Zn and Co mainly in sulphides and Mn mainly in oxides. The content, composition and/or reactivity of these minerals presumably vary among the different stratigraphic levels. The most likely explanation for the variation and distinct chemistry of the water at the different stratigraphic levels at the start of the experiment is that the different trace-element distributions in the water reflect the variable composition of the chalk with depth, that is, the content of clay minerals, carbonates and sulphides and variable trace-element composition of these minerals. This implies that the water composition has evolved due to geochemical reactions with the chalk at various stratigraphic levels, as suggested by Schürch et al. (2004). This could be due to variations in trace-element composition at the time of formation of the chalk, a result of post-depositional solution or precipitation or some other type of reaction, such as sorption of the trace elements on the mineral surfaces or variations in the contents of minerals due to glaciotectonic redistribution of sediments. However, the mechanism controlling the variation in trace-element concentrations is not clear.
Up-coning and seawater intrusion were suggested to be responsible for increasing salinity in wells close to each other in a similar coastal carbonate aquifer about 100 km north of the Falster test site (Thorn 2011). If the trace element concentrations in the aquifer were a result of simple mixing between meteoric water and Baltic Sea water, the samples should fall on a mixing line between the two sources. Furthermore, the colour of the dots representing the compositional variation should reflect this (Fig. 8). However, this is not the case, and thus, the elevated salinity in the monitoring wells is unlikely to be the result of simple dilution of Baltic Sea water. Similarly, if the trace element concentrations in the aquifer were a result of simple mixing between meteoric water and connate water from deeper levels, the samples should likewise fall on a mixing line between these two sources. This is not the case, as the trace-element composition is also distinct from the connate saline water from the deeper levels of the chalk aquifer (Fig. 8), suggesting that elevated salinity in the wells is not simply caused by up-coning of saline water from below.
After c. 80 h, the composition of the water in the monitoring wells changes slightly at all three levels as seen in the change of the colours of the dots marking the geochemical fingerprint of the water derived from the SOM analysis (Fig. 7). The geochemical fingerprint of the water is very distinct at the 19.5 m level with bright pink dots and light brown dots at the 23.5 m level. At the 19.5 m level, the composition changes after c. 80 h and is marked by blue dots for the following 300 h. The composition of the water at this level is still rather different from the other two levels, and the reason for the conservative nature of the composition here may be caused by the fairly high levels of trace elements in the water. After c. 500 h, the composition at the 19.5 m level changes, reflected by green dots (Fig. 7). At the 23.5 m level, the change to green dots occurs after c. 80 h, and at the 15.5 m level, the green dots occur after c. 500 h. However, the colour of the dots at the 15.5 m level becomes blue–green after c. 80 h indicating that the composition is developing towards the green dots after 500 h at 19.5 m and after 80 h at 23.5 m. At 15.5 m, the tracer concentration peaks earlier than at deeper levels (Fig. 6) and seems to be flushed out earlier than the other levels. This is probably because the chalk is heavily fractured here (Fig. 2B).
The shift towards greenish colours over time at all levels indicates that the samples become statistically more homogeneous, which is most likely an effect of the recirculation mixing the water from all levels and smoothing out their characteristic fingerprints. This indicates that the fingerprint characteristics must be a feature that develops over time through water–rock interactions.
The water analysed from 40 m b.s. in the DGU 242.375 well located 100 m from the Baltic Sea is very similar to the water from the Baltic Sea (Fig. 8) with respect to the content of Mg, Sr and Co. Furthermore, the dot that reflects the overall geochemical fingerprint, taking all the 27 elements into account, has the same colour as that for seawater (yellow). This implies that the geochemical fingerprint in this well is similar to the seawater and that the water here is derived from the Baltic Sea. The different Mn content may be caused by trapping of Mn on oxides towards the well and/or the well screen.
The present position of the saltwater–freshwater interface at c. 30–40 m b.s. (c. –30 to –40 m a.s.l.) is controlled by the depth and distribution of hydraulic active fractures in the chalk, as was found for sites on the island of Sjælland, c. 100 km to the north of Falster where the interface is found between –45 and –70 m a.s.l. (Larsen et al. 2006). The thinner freshwater zone on the island of Falster might be explained by a number of processes, including the ablation history of retreating glaciers during past glaciations, the marine setting of the aquifer during most of the Holocene and finally more recent land reclamation on Falster, which resulted in very low groundwater recharge since the early 1860s.
Multi-element fingerprinting of water is not commonly used in Northern Europe, and the results of the present investigation suggest that this can be a useful method to investigate water–rock interactions, water provenance and the sources of dissolved chloride. This information is important when planning measures to control saltwater intrusion and protect drinking water resources such as managed aquifer recharge of desalinised brackish groundwater from deeper parts of the aquifer. The results of this study and of previous studies by Rasmussen et al. (2013), Pedersen et al. (2018) and Hinsby et al. (2018) clearly demonstrate that a sound understanding of local geological and geochemical features of aquifers is a prerequisite for the protection of water-supply wells from saltwater intrusion of various sources in coastal areas.
5 Conclusions
Water extracted from a slightly saline aquifer on Falster has distinctly different hydro-chemical fingerprints depending on the stratigraphic levels from where it is extracted. This suggests that the composition has evolved by interaction with the rock. The slightly saline character of the water is probably due to incomplete refreshing of the aquifer during the Holocene. This could again be caused by the very low relief and flow in the area.
Water composition changes with time during the tracer experiment, probably caused by the flushing of the reservoir with re-injected water. Introduction of the (NaCl) tracer may also have caused ion exchange, thus mobilising other cations in the reservoir.
Comparisons of aquifer water with Baltic Sea water and deep connate water show that the observed compositions cannot be generated by mixing these sources with the meteoric recharge. However, the hydro-chemical composition/fingerprint of the water in another well extracted at 40 m b.s. is very close to seawater, suggesting that the water here contains a high fraction of seawater. This is likely because the well is located close to (c. 100 m from) the Baltic Sea.
The statistical analysis, based on an unsupervised machine-learning algorithm, SOM, has proved to be a very effective way to facilitate interpretation of a large number of variables and thus understand the compositional variation in an aquifer. Using multi-element analysis combined with SOM analysis/fingerprinting may also be useful in future studies of variations in groundwater quality and, for example, in characterising the source of chloride in coastal aquifers.
Acknowledgements
The authors would like to thank Olga Nielsen (GEUS) for the analytical work, Per Jensen (GEUS) for help during the fieldwork and Peer Jørgensen (Copenhagen University) for the development of the partly automated sampling and monitoring system in CMT wells.
Additional information
Author contributions
All: Investigation and writing (original draft, review and editing). CK and LJK: Data curation and methodology. KH: Project administration, conceptualisation and funding acquisition. RJ: Conceptualisation and methodology. PR: Conceptualisation.
Additional files
Two additional files are available at: https://doi.org/10.22008/FK2/Q8YF8V
References
Bonnesen, E.P., Larsen, F., Sonnenborg, T.O., Klitten, K. & Stemmerik, L. 2009: Deep saltwater in Chalk of North-West Europe: origin, interface characteristics and development over geological time, Hydrogeology Journal 17, 1643–1663. https://doi.org/10.1007/s10040-009-0456-9
Dalla Libera, N., Pedretti, D., Tateo, F., Mason, L., Piccinini, L. & Fabbri, P. 2020: Conceptual model of arsenic mobility in the shallow alluvial aquifers near Venice (Italy) elucidated through machine learning and geochemical modeling. Water Resources Research 56, e2019WR026234. https://doi.org/10.1029/2019wr026234
Edmunds, W.M., Cook, J.M., Darling, W.G., Kinniburgh, D.G., Miles, D.L., Bath, A.H., Morgan-Jones, M. & Andrews, J.N. 1987: Baseline geochemical conditions in the Chalk aquifer, Berkshire, U.K.: a basis for groundwater quality management. Applied Geochemistry 2, 251–274. https://doi.org/10.1016/0883-2927(87)90042-4
Henriksen, H.J., Voutchkova, D., Troldborg, L., Ondracek, M., Schullehner, J. & Hansen, B. 2019: National Vandressource Model Beregning af udnyttelsesgrader, afsænkning og vandløbspåvirkning med DK model 2019. GEUS report 2019/32, 84 pp.
Hinsby, K., Condesso de Melo, M.T. & Dahl, M. 2008: European case studies supporting the derivation of natural background levels and groundwater threshold values for the protection of dependent ecosystems and human health. Science of the Total Environment 401, 1–20. https://doi.org/10.1016/j.scitotenv.2008.03.018
Hinsby, K., Jessen, S., Larsen, F. & Postma, D. 2012: A groundwater chemistry and multi-tracer study of sources of salt water intrusion – the Island of Falster, Denmark. 22nd Salt Water Intrusion Meeting, SWIM2012, 18–22 June, Buzios, Brazil.
Hinsby, K., Johnsen, A.R., Rasmussen, P., Sonnenborg, T.O., Sørensen, S.R., Postma, D., Thorn, P., Scharling, P.B. & Gudbjerg, J. 2016: Water4Coasts – new methods for integrated management and protection of coastal aquifers, 160 pp. Copenhagen: Danish Ministry of Environment and Food.
Hinsby, K. et al. 2018: D2.2 Road map for full scale implementation of SWS for fractured chalk aquifer. 68 pp. Deliverable for the EU project SUBSOL. www.subsol.org
Kalteh, A.M., Hjorth, P. & Berndtsson, R. 2008: Review of the self-organizing map (SOM) approach in water resources: analysis, modelling and application. Environmental Modelling & Software 23, 835–845. https://doi.org/10.1016/j.envsoft.2007.10.001
Khadra, W.M., Stuyfzand, P.J. & van Breukelen, B.M. 2017: Hydrochemical effects of saltwater intrusion in a limestone and dolomitic limestone aquifer in Lebanon. Applied Geochemistry 79, 36–51. https://doi.org/10.1016/j.apgeochem.2017.02.005
Kim, K.H., Yun, S.T., Yu, S., Choi, B.Y., Kim, M.J. & Lee, K.J. 2020: Geochemical pattern recognitions of deep thermal groundwater in South Korea using self-organizing map: identified pathways of geochemical reaction and mixing. Journal of Hydrology 589, 125202. https://doi.org/10.1016/j.jhydrol.2020.125202
Kohonen, T. 1982: Self-organized formation of topologically correct feature maps. Biological Cybernetics 43, 59–63. https://doi.org/10.1007/BF00337288
Kohonen, T. 1990: The self-organizing map. Proceedings of the IEEE 78, 1464–1480. https://doi.org/10.1109/5.58325
Kohonen, T. 2001: Self-organizing maps. Heidelberg: Springer-Verlag Berlin. https://doi.org/10.1007/978-3-642-56927-2
Kohonen, T. 2013: Essentials of the self-organizing map. Neural Networks 37, 52–65. https://doi.org/10.1016/j.neunet.2012.09.018
Larsen, F., Sonnenborg, T., Madsen, P. 2006: Saltvandsudvaskning i Danienkalk og Skrivekridt: detailundersøgelser i Karlslunde værkstedsområde [Saltwater transport in the Danian Limestone and Chalk: detailed studies from Karlslunde study area]. Partial report no. 6, 2006/21, 1–103. Copenhagen: Geological Survey of Denmark and Greenland.
Ødum, H. & Christensen, W. 1936: Danske Grundvandstyper og deres geologiske optræden. Danmarks Geologiske Undersøgelse III. Række 26, 183 pp.
Pedersen, S.A.S., Gravesen, P. & Hinsby, K. 2018: Chalk-glacitectonite, an important lithology in former glaciated terrains covering chalk and limestone bedrock. Geological Survey of Denmark and Greenland Bulletin 41, 21–24. https://doi.org/10.34194/geusb.v41.4333
Rasmussen, P., Sonnenborg, T.O., Goncear, G. & Hinsby, K. 2013: Assessing impacts of climate change, sea level rise, and drainage canals on saltwater intrusion to coastal aquifer. Hydrology and Earth System Sciences 17, 421–443. https://doi.org/10.5194/hess-17-421-2013
Schürch, M., Edmunds, W.M. & Buckley, D. 2004: Three-dimensional flow and trace metal mobility in shallow Chalk groundwater, Dorset, United Kingdom. Journal of Hydrology 292, 229–248. https://doi.org/10.1016/j.jhydrol.2004.01.004
Thorn, P. 2011: Groundwater Salinity in Greve, Denmark: determining the source from historical data. Hydrogeology Journal 19(2), 445–461. https://doi.org/10.1007/s10040-010-0680-3
Yuan, Y., Zhu, X., Mushet, D.M. & Otte, M.L. 2019: Multi-element fingerprinting of waters to evaluate connectivity among depressional wetlands. Ecological Indicators 97, 398–409. https://doi.org/10.1016/j.ecolind.2018.10.033
Zuurbier, K., Raat, K.J., Paalman, M., Oosterhof, A.T. & Stuyfzand, P.J. 2017: How subsurface water technologies (SWT) can provide robust, effective, and cost-efficient solutions for freshwater management in coastal zones. Water Resources Management 31, 671–687. https://doi.org/10.1007/s11269-016-1294-x