RESEARCH ARTICLE
Comparison of ASTER and Sentinel-2 spaceborne datasets for geological mapping: a case study from North-East Greenland
Sara Salehi*1, Christian Mielke2, Christian Brogaard Pedersen1 and Simun Dalsenni Olsen1
*Corresponding author: Sara Salehi | E-mail: [email protected]
1Geological Survey of Denmark and Greenland (GEUS), Øster Voldgade 10, DK-1350, Copenhagen K, Denmark.
2Helmholtz Center Potsdam, GFZ German Research Center for Geoscience, 14473 Potsdam, Germany.
GEUS Bulletin Vol 43 | e2019430205 | Published online: 17 July 2019
https://doi.org/10.34194/GEUSB-201943-02-05
Spaceborne remote sensing is a suitable tool for early mineral exploration and surveying large areas of high Arctic environment in a fast and cost-effective manner. While spaceborne data have been used widely to map geology in arid areas, similar approaches for remotely-sensed geological mapping of Arctic environments is yet to be developed. Freely available spaceborne optical data provides detailed information of high-quality that could potentially reduce resource exploration risk in remote regions. To this end, this study compares the use of two different multispectral spaceborne datasets (i.e. the Advanced Spaceborne Thermal Emission and Reflection Radiometer (ASTER) and Sentinel-2) to map geological units in and around Wollaston Forland, North-East Greenland – an area rich in Jurassic and Cretaceous sedimentary rocks and important targets for offshore petroleum exploration. Multispectral image sensors simultaneously capture image data within multiple wavelength ranges (bands) across the electromagnetic spectrum. Each band is commonly described by the band number and the band wavelength centre position. Here, we identify the bands most suitable for geological mapping in an Arctic setting, using the Wollaston Forland area as an example. We compare the results obtained by processing spaceborne data with a published geological map for the area (Henriksen 2003).
Geological setting
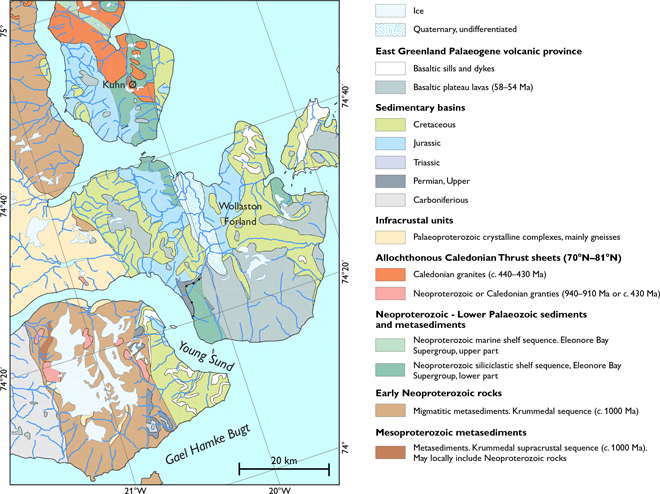
North-East Greenland comprises three main geological units – a Palaeoproterozoic crystalline gneiss-granite basement, a Mesoproterozoic high-grade metasedimentary unit and a slightly deformed and metamorphosed Neoproterozoic – Lower Palaeozoic sedimentary sequence – as well as a Mesozoic sedimentary and volcanic basin (Fig. 1). The basal part of this sequence constitutes the Eleonore Bay Supergroup, marine siliciclastic and carbonate sediments intruded by Caledonian granites (Sønderholm & Tirsgaard 1993).

Fig. 1. Geological map of North-East Greenland (modified from Henriksen 2003).
Wollaston Forland is dominated by Jurassic and Cretaceous sedimentary rocks. The Upper Permian siliciclastic and carbonate sediments are overlain by shallow- and deep-water sandstones and shales deposited during continuous rifting in the Triassic, Jurassic and Cretaceous (Fig. 1). The extensive Paleogene plateau basalts on Wollaston Forland, as well as basaltic sills and dykes in the Mesozoic sediments, belong to the East Greenland Tertiary volcanic province (Henriksen et al. 2009). The Upper Permian to Early Eocene deposits and break-up related flood basalts, dikes and sills are moderately exposed, where limited exposure is, in most places, due to the erosional and depositional processes of the Quaternary glaciations.
Spaceborne datasets
The ASTER sensor covers a broad spectral region with 14 bands ranging from visible-near infrared (VNIR) and short-wave infrared (SWIR) to thermal infrared (TIR), with 15 m, 30 m, and 90 m spatial resolution, respectively (see Fig. S1 in supplementary information). This sensor has been widely used for geological mapping applications since its launch in 1999 (Abdeen et al. 2001; Amer et al. 2010). Sentinel-2 covers 13 bands in the VNIR and SWIR wavelength regions, with four bands at 10 m, six bands at 20 m and three bands at 60 m spatial resolution (Fig. S1). The potential for using Sentinel-2 for geological remote sensing in arid and semi-arid regions has been evaluated before (Al-Nahmi et al. 2017; Mielke et al. 2014; van der Meer et al. 2014; van der Werff & van der Meer 2016).
Several pre-processing steps were applied on both datasets prior to performing the mapping approaches. The datasets were first atmospherically corrected. Features associated with clouds, ice, snow and ocean were then masked out. Removal of these unwanted features improved the visualisation of slight differences between spectrally similar minerals, and mineral mixtures such as clays and other hydrous phases resulting from alteration of primary rock-forming silicates. We adopted the following four approaches to identify the bands most suitable for differentiating rock types in the Wollaston Forland area:
- Enhanced false colour composite images using VNIR and SWIR bands: a technique known as decorrelation stretch is used to remove the inter-band correlation found in the input pixels and enhance the colour differences representative of different lithological units
- Principal component analysis (PCA) of ASTER and Sentinel-2 reflectance data (i.e. VNIR and SWIR bands)
- Classification based on band ratios
- Band-depth colour composites computed from three spectral bands (two continuum and one centre band).
ASTER false colour composite images
Generating true- and false-colour composite images from ASTER and Sentinel-2 band combinations or band ratio combinations can reveal important mineralogical/lithological information. Here, we generate false colour composite images using VNIR and SWIR reflectance bands (Figs 2A, C) and TIR radiance bands (Fig. 2B) to separate the main lithological groups exposed in the study area. In addition, we apply a decorrelation stretch (Wahi et al. 2013) on the false colour composite images, which enhances the discrimination between lithological units.

Fig. 2. False colour composite images. A: ASTER VNIR-SWIR (red: band 6, green: band 4, blue: band 3). B: ASTER TIR (red: band 10, green: band 14, blue: band 12). C: Sentinel-2 (red: band 12, green: band 4, blue: band 8a). Images are available in high resolution as supplementary data (Fig. S2).
In the ASTER VNIR-SWIR false colour composite image (Fig. 2A), exposed lithologies are highlighted by red, green and purple colours corresponding to the variable content of silicate and clay minerals and iron-oxides, respectively. Rocks enriched in quartz, feldspar and silica are best detected using the ASTER TIR false colour composite (Fig. 2B). For example, migmatitic and siliciclastic metasediments in the geological map are highlighted in detail by green coloured pixels. The basaltic plateau lavas (predominantly silica oversaturated tholeiites) are not well identified in the Sentinel-2 false colour composite image (sparse olive-green pixels in Fig. 2C), unlike the ASTER TIR false colour composite image, which clearly depicts these units in pink (Fig. 2B).
These units are rich in silica and feldspars and Sentinel-2 does not have thermal bands to resolve these features. Sentinel-2 is, however, better able to delineate clay, gossan and ferric-oxides (purple and blue pixels in Fig. 2C) using the bands at 2190 nm and 900 nm and 560 nm, compared with the ASTER VNIR-SWIR false colour composite image.
Principal component analysis
We employed PCA to enhance and separate spectral signatures from the background and to qualitatively identify differences in lithology for both datasets. PCA of reflectance data provides a new layer of information that complements geological maps, e.g. by mapping offsets between lithological boundaries, which may resemble important structural or stratigraphic contacts. The first principal component (PC) band contains the highest variance, the second PC band contains second high variance and the last PC band contains the lowest variance and the highest noise (Richards & Xiuping 1999).
Not all Sentinel-2 bands are suitable for geological applications and only 9 out of 13 are used in the PCA. Excluded bands comprise band 8 due to its wide bandwidth and bands with 60 m spatial resolution (see Fig. S1) that are positioned in an atmospheric absorption feature as an aid in atmospheric correction (i.e. water vapour absorption bands and bands for cirrus cloud detection – bands 1, 9, 10). For the ASTER image, only VNIR-SWIR bands are used in this step.
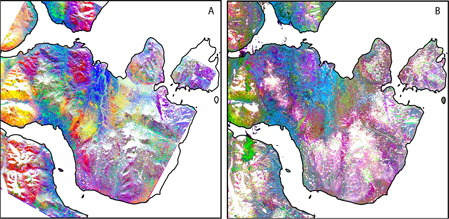
We retrieved nine principal components for each dataset, of which, principal component bands with the largest amounts of data variance were employed to give the best discrimination between the various lithological units. In both scenarios, the results revealed geological features that were not previously identified in the geological map used in this study. Band combinations of PC3 (red), PC5 (green) and PC4 (blue), were best able to delineate different lithological units in the ASTER images (Fig. 3A). In Sentinel-2 images, lithological units were best identified by band combinations of PC4 (red), PC9 (green) PC5 (blue) (Fig. 3B).

Fig. 3. False colour composite images based on principal component analyses (PCA). A: ASTER data. Red pixels: PC3. Green: PC5: Blue: PC4. Palaeoproterozoic crystalline gneiss-granite appears as bright yellow pixels and the Neoproterozoic-Lower Palaeozoic sedimentary sequence as magenta. B: Sentinel-2 data. Red pixels: PC4. Green: PC9. Blue: PC5. The lava series are depicted by pink colours. Mafic dykes and sills are visible in cyan. See Fig. 1. for reference. Images are available to download in high resolution as supplementary data (Fig. S3).
Classification using band ratios
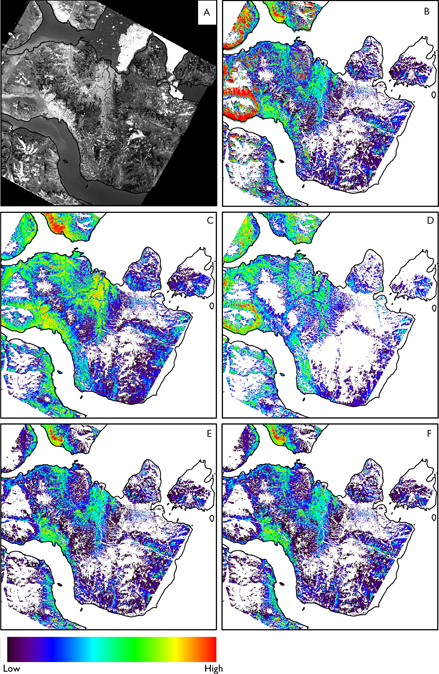
During the past two decades, ASTER-derived band ratios have been successfully used as proxies for mapping mineral assemblages or individual mineral groups in arid regions (Amer et al. 2010; Gad & Kusky 2006; Pournamdari et al. 2014). Band ratios are known to eliminate shadow and topographic effects from images, and therefore suit complex terrains such as those found in the Arctic (Salehi et al. 2019). However, they do not indicate the occurrence of a mineral with absolute certainty or with any idea of quantity, so ground truthing is essential. That said, every terrain is different, and band ratios that work in some areas for a particular mineral or assemblage may not work elsewhere. Therefore, spaceborne data should be used in conjunction with geological maps, geochemistry, ground spectral references, and any other available data for the most accurate interpretation. Figure 4A illustrates albedo vs. absorption contrast in the ASTER scene. Dark pixels in this image correspond to areas where the overall albedo is low and/or minerals have shallow features. This means that ASTER band ratios in these regions cannot delineate (or poorly delineate) different lithological units.

Fig. 4. Classification using ASTER data. A: Albedo vs. absorption contrast band ratio B: Ferrous iron (band5 / band3 + band1 / band2). C: Gossan (band4 / band2). D: Ferric-oxides (band4 / band3). E: Sericite/muscovite/illite/smectite ((band5 + band7) / band6). F: Normalised vegetation index ((band3 – band2) / (band3 + band2)), in which the red colour represents a higher relative abundance of the minerals. White areas show background values. Images are available to download in high resolution as supplementary data (Fig. S4).
Medium to high band ratio values for ferrous iron (green to red colours in Fig. 4B) align well with migmatitic and siliciclastic metasediments in the geological map (dark green units in Fig. 1). The results derived from gossan (Fig. 4C) and ferric-oxide (Fig. 4D) band ratios are similar. In some regions, medium to high values in these maps have quite high normalised vegetation index values (see red and green colours in Figs 4C, D, which align with green colours in Fig. 4F) and may be caused by vegetation coverage. High values in the sericite, muscovite, illite and smectite image (Fig. 4E) correspond to the Palaeoproterozoic crystalline gneiss-granite basement and migmatitic and siliciclastic metasediments in the geological map (see yellow, brown and green units in Fig. 1).
Band-depth colour composites
Wavelength position, depth, width and asymmetry of an absorption band are the most essential information used in spectroscopy that can be directly linked to mineral types and their abundances, as well as to subtle changes in the chemical composition of minerals (van der Meer 2004; van der Meer et al. 2018; van Ruitenbeek et al. 2014). This information is particularly useful in areas where field validation is sparse, and imagery contains shallow spectral absorption features. The depth of absorption features for iron, clay and epidote/ serpentine/carbonate minerals are calculated for the ASTER scene and visualised as a false colour composite image (Fig. 5A). The RGB colour combination for the iron feature depth at c. 900 nm (green peak at 560 nm; sensitive to total chlorophyll in vegetation) in the ASTER image, and the feature depth at 1610 nm for Sentinel-2 (Fig. 5B), agrees best with the geological map (Fig. 1). Sentinel-2 allows us to highlight dykes and sills (dark blue and cyan pixels in Fig. 5B). The Lava series is also cleared identified (cyan colours in ASTER, and yellow in Sentinel-2). Quaternary rocks (enriched in clay/silicates) are more clearly visible in the ASTER images (dark blue pixels), and as purple and green colours in the Sentinel-2 band-depth colour composite. Both datasets provide detailed information of the spatial distribution of lithologies.

Fig. 5. Absorption feature depth colour combination. A: ASTER. B: Sentinel-2. Images are available to download in high resolution as supplementary data (Fig. S5).
For example, red pixels in Fig. 5A indicate iron-rich regions that add complementary information to the geological map.
Conclusions
In this study, ASTER outperformed Sentinel-2 in discriminating between the lithological units in the Wollaston For-land area. The success can be attributed to the fact that ASTER has six SWIR bands whereas Sentinel-2 has only two. Moreover, Sentinel-2 does not contain TIR bands. However, Sentinel-2 is better suited to mapping iron-bearing minerals since it has several bands that cover the 900 nm iron absorption feature, while ASTER has only one band covering this feature. Image enhancement (decorrelation stretch) has also been shown to be effective in the identification and visualisation of different rock units. Using absorption feature-depth colour composition yielded the best results in delineating different lithologies. It should be noted that the band ratio combination approach only uses three bands at a time, thus knowledge-based classification (e.g. Argialas & Goudoula 2003; Harvey & Fotopoulos 2016) using those band ratios is recommended as the next step to improve these classification results.
Acknowledgments
We thank the reviewers, Veronika Kopačková and Asger Ken Pedersen, whose comments and suggestions improved the manuscript.
References
Abdeen, M.M., Thurmond, A.K., Abdelsalam, M.G. & Stern, R.J. 2001: Application of ASTER band-ratio images for geological mapping in arid regions: the Neoproterozoic Allaqi Suture, Egypt. Proceedings of the Geological Society of America Annual Meeting, 5–8 November 2001. Boston.
Al-Nahmi, F., Saddiqi, O., Hilali, A., Rhinane, H., Baidder, L. & Khanbari, K. 2017: Application of remote sensing in geological mapping, case study Al Maghrabah area – Hajjah region, Yemen. ISPRS Annals of the Photogrammetry, Remote Sensing and Spatial Information Sciences 4, 63–71. https://doi.org/10.5194/isprs-annals-iv-4-w4-63-2017
Amer, R., Kusky, T. & Ghulam, A. 2010: Lithological mapping in the Central Eastern Desert of Egypt using ASTER data. Journal of African Earth Sciences 56, 75–82. https://doi.org/10.1016/j.jafrearsci.2009.06.004
Argialas, D.P. & Goudoula, V. 2003: Knowledge-based land use classification from IKONOS imagery for Arkadi, Crete, Greece. In: Ehlers, M. (eds): Remote Sensing for Environmental Monitoring, GIS Applications, and Geology II. Proceedings of the International Society for Optics and Photonics 4886, 193–205. https://doi.org/10.1117/12.463282
Gad, S. & Kusky, T. 2006: Lithological mapping in the Eastern Desert of Egypt, the Barramiya area, using Landsat thematic mapper (TM). Journal of African Earth Sciences 44, 196–202. https://doi.org/10.1016/j.jafrearsci.2005.10.014
Harvey, A. & Fotopoulos, G. 2016: Geological mapping using machine learning algorithms. ISPRS – International Archives of the Photogrammetry, Remote Sensing & Spatial Information Sciences XLI–B8, 423–430. https://doi.org/10.5194/isprs-archives-xli-b8-423-2016
Henriksen, N. 2003: Caledonian orogen of East Greenland 70°N–82°N: Geological map of Greenland 1:1 000 000. Copenhagen: Geological Survey of Denmark and Greenland.
Henriksen, N., Higgins, A., Kalsbeek, F. & Pulvertaft, T.C.R. 2009: Greenland from Archaean to Quaternary. Geological Survey of Denmark and Greenland Bulletin 18, 126 pp.
Mielke, C., Boesche, N., Rogass, C., Kaufmann, H., Gauert, C. & de Wit, M. 2014: Spaceborne mine waste mineralogy monitoring in South Africa, applications for modern push-broom missions: hyperion/OLI and EnMAP/Sentinel-2. Remote Sensing 6, 6790–6816. https://doi.org/10.3390/rs6086790
Pournamdari, M., Hashim, M. & Pour, A.B. 2014: Spectral transformation of ASTER and Landsat TM bands for lithological mapping of Soghan ophiolite complex, south Iran. Advances in Space Research 54, 694–709. https://doi.org/10.1016/j.asr.2014.04.022
Richards, J.A. & Xiuping, J. 1999: Remote sensing digital image analysis. Berlin Heidelberg: Springer. https://doi.org/10.1007/978-3-662-03978-6
Salehi, S., Olsen, S.D., Pedersen, C.B. & Thorning, L. 2019: ASTER data analysis applied to mineral and geological mapping in North-East Greenland. Documentation of the NEG ASTER Project. Geological Survey of Denmark and Greenland report 2019/7, 64pp.
Sønderholm, M. & Tirsgaard, H. 1993: Lithostratigraphic framework of the Upper Proterozoic Eleonore Bay Supergroup of East and North-East Greenland. Bulletin Grønlands Geologiske Undersøgelse 167, 38 pp.
van der Meer, F. 2004: Analysis of spectral absorption features in hyper-spectral imagery. International journal of applied earth observation and geoinformation 5, 55–68. https://doi.org/10.1016/j.jag.2003.09.001
van der Meer, F., Kopačková, V., Koucká, L., van der Werff, H.M., Van Ruitenbeek, F.J. & Bakker, W.H. 2018: Wavelength feature mapping as a proxy to mineral chemistry for investigating geologic systems: An example from the Rodalquilar epithermal system. International Journal of Applied Earth Observation and Geoinformation 64, 237–248. https://doi.org/10.1016/j.jag.2017.09.008
van der Meer, F., van der Werff, H. & Van Ruitenbeek, F. 2014: Potential of ESA’s Sentinel-2 for geological applications. Remote sensing of environment 148, 124–133. https://doi.org/10.1016/j.rse.2014.03.022
van Der Werff, H. & Van Der Meer, F. 2016: Sentinel-2A MSI and Land-sat 8 OLI provide data continuity for geological remote sensing. Remote sensing 8, 883. https://doi.org/10.3390/rs8110883
van Ruitenbeek, F.J., Bakker, W.H., van der Werff, H.M., Zegers, T.E., Oosthoek, J.H., Omer, Z.A., Marsh, S.H., van der Meer, F.D. 2014: Mapping the wavelength position of deepest absorption features to explore mineral diversity in hyperspectral images. Planetary and Space Science 101, 108–117. https://doi.org/10.1016/j.pss.2014.06.009
Wahi, M., Taj-Eddine, K. & Laftouhi, N. 2013: ASTER VNIR & SWIR band enhancement for lithological mapping – a case study of the Azegour Area (Western High Atlas, Morocco). Journal of Environment and Earth Science 3, 33–45.
How to cite
Salehi, S., Mielke, C., Brogaard Pedersen, C. & Dalsenni Olsen, S. 2019: Comparison of ASTER and Sentinel-2 spaceborne datasets for geological mapping: A case study from North-East Greenland. Geological Survey of Denmark and Greenland Bulletin 43, e2019430205. https://doi.org/10.34194/GEUSB-201943-02-05